Crude Oil Intraday Trading Levels for Scalping - 11OCT2021Crude Oil Intraday Trading Levels for Scalping - 11OCT2021
Crudeoilforecast

Crude Oil Intraday Trading Levels for Scalping - 07OCT2021Crude Oil Intraday Trading Levels for Scalping - 07OCT2021

Crude Oil Intraday Trading Levels for Scalping - 06OCT2021Crude Oil Intraday Trading Levels for Scalping - 06OCT2021

Crude Oil Intraday Trading Levels for Scalping - 29Sep2021Crude Oil Intraday Trading Levels for Scalping - 29Sep2021

Crude Oil Intraday Trading Levels for Scalping - 29Sep2021Crude Oil Intraday Trading Levels for Scalping - 29Sep2021

Usoil Double Top Monthly pattern/likely to test the 65 handle 76.50 level monthly resistance/top looks like a strong rejection level ,profit booking like pattern has already formed after the OPEC meeting and indications are clearly visible in the weekly chart. Speculative sentiment index is around 50/50 hence we are expecting the price to drop and test the 65 handle monthly support .
Signal : Sell every rise
Target ; 65 Handle
Stop loss / Buy stop : Above 76.50

Crude direction as per AstroJul 2
July 1st as per astrology it s highly pressure date for crude oil ,
so keep july 1st high low very important
predicted on 02.07.2021
Thanks & Regards
K Sureshkumar

Cruse Oil (WTI) - SHORT; SELL it here!! ........ for the better part of "Eternity". (Well, at least for the foreseeable future.) A soon-to-bottom U$D also will not help WIT's cause. This market was, is and remains, at these levels, nothing more than just one part of the global speculative bubble. We shall meet again at $30.

Wednesday: Crude Oil - Week 19It definitely looks like a big complex regular flat is in play. We have made a 3-wave corrective structure, so I'm looking for price-action to break the top 1 more time and then drop. I'm looking for the drop because of how the structure is developing, and the divergence in MACD and volume, which is indicating buyer-weakness.
I will update my idea as the trade progresses if any changes occur and my analysis is wrong, or need to be adapted to the new development of price-action.
-----------------------------------------------------------------------------------------------------------------------
-----------------------------------------------------------------------------------------------------------------------
SMASH that follow button! 👍
💡 Leave a comment and/or message me on how I can improve and provide better content, I'm open to suggestions to create a better experience for you!
RISK DISCLAIMER: Please be advised that I am not telling anyone how to spend or invest their money. Take all of my videos as my own opinion, as entertainment, and at your own risk. I assume no responsibility or liability for any errors or omissions in the content of this channel. This content is for educational purposes only and is not tax, legal, financial, or professional advice. Any action you take on the information in this video is strictly at your own risk. We, therefore, recommend that you contact a personal financial advisor before carrying out specific transactions and investments. There is a very high degree of risk involved in trading. Past results are not indicative of future returns. Inotfancy.com and all individuals affiliated with this channel assume no responsibility for your trading and investment results.

WTI Crude Oil - SHORT; SELL it off of 65!! ...... For at least a -50% long(er)-term drop.
The Daily;

WTI Crude Oil Long Setup
Crude Oil is still in Minuette-v correction. B-C is yet to complete. Another subminuette wave is more likely to form and breakout from 60.60 level will confirm it. 1st Target is near 57.00 and 2nd target is 54.00. And this setup wil invalidate at level 64.35
Good Luck!!


US OIL SHORT - short term bias The detailed chart tells a better story, I think we could expect US Oil to plunge further to around $50/barrel.
Disclaimer: This is only a trading idea and must not be taken as a trading signal.


CRUDE OIL could PUMP soon! Hey tradomaniacs,
Crude OIL could PUMP 👉
Would fit perfect to my risk-on-scenario that I expect for today!
CANADIAN DOLLAR will probably move up with CRUDE!
LEAVE A LIKE AND A COMMENT - I appreciate every support! =)
Peace and good trades
Irasor
Wanna see more? Don`t forget to follow me

Oil Long SetupOil Long Setup
🔵 Entry: $62.62
🟢 TP & RR: $64.61 (1.7)
⛔ Stop Loss: $61.45
Trade Reasons:
✔️ 0.618 Fib level
✔️ 0.5 Fib level
✔️ Previous Support/Resistance level

Oil Short SetupOil Short Setup
🔵 Entry: $67.20
🟢 TP & RR: $64.54 (1.96)
⛔ Stop Loss: $68.56
Trade Reasons:
✔️ Gap to fill
✔️ Overbought level
✔️ Market Structure

CRUDE OIL/US OIL - INTRADAY LEVELS FOR MARCH 2-5
SHORT below 60.90
LONG above 61.25
Price may retest the trendline before falling down further.
Use appropriate risk-reward ratio.
Always use a stop loss.
P.S: This is NOT investment advice. This chart is meant for learning purposes only. This is my personal journal. Invest your capital at your own risk.

Oil Long SetupOil Long Setup (refer to the trade marked with "2")
🔵 Entry: $62.24
🟢 TP & RR: $64.55 (2.69)
⛔ Stop Loss: $61.38
Trade Reasons:
✔️ Support Level
📝 A very basic setup relying on a support bounce. I still believe that we need to reach the 1.618 level before price reverts (the setup posted yesterday and marked with "1"). In the meantime I want to take advantage of the move up (if I even get a fill), but my position will be much smaller than usual due to the last trading day of the month.

Oil Short SetupOil Short Setup
🔵 Entry: $64.49
🟢 TP & RR: $61.02
⛔ Stop Loss: $66.14
Trade Reasons:
✔️ 1.618 Fib Level Extension
✔️ Expecting the formation of higher high price with lower high on the Market Flow indicator (divergence)
📝 This trade will probably take a while to form and will require monitoring of the entry level, to assess the situation.

Oil Long PositionOil Long Position
🔵 Entry: $62.19
🟢 TP & RR: $63.55 (2.62)
⛔ Stop Loss: $61.67
REASONS FOR THE TRADE
✔️ Resistance flipped to support
✔️ Fairly strong volume upwards
📝 I am expecting price to consolidate around the entry level and then continue trending up. Even if this long fails, I certainly don't feel comfortable shorting the trend on a move upwards (or at least until I see some divergence).

Oil Short SetupOil Short Setup
🔵 Entry: $58.51
🟢 TP & RR: $53.68 (4.24)
⛔ Stop Loss: $59.65
REASONS FOR THE TRADE
✔️ Reached upper trendline
✔️ Seems like we are going to form a lower low
✔️ Divergence in the Market Flow indicator
📝 This is continuation of the short setup I posted a few days ago (1). If you are in a trade already this additional short (2) will increase your exposure, so I suggest moving your SL down.

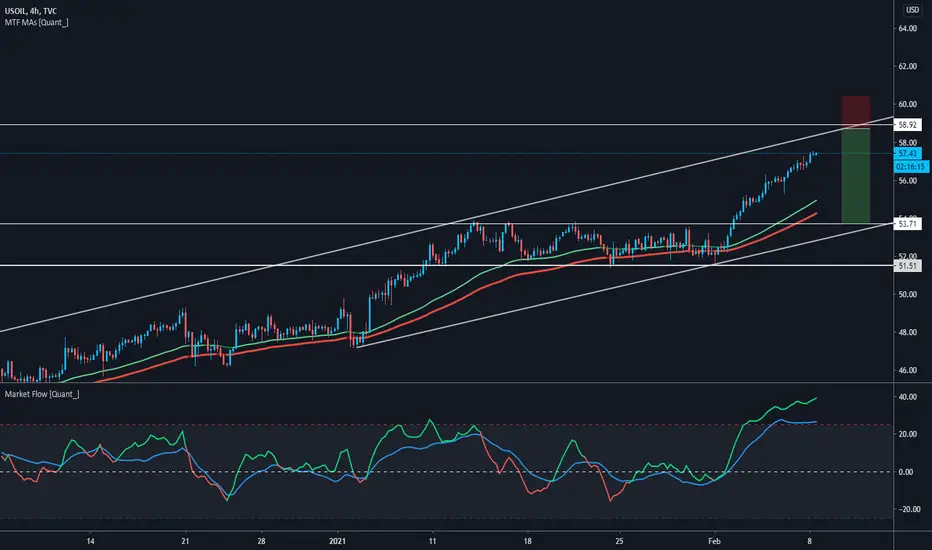
Oil Short SetupOil Short Setup
🔵 Entry: $58.73
🟢 TP & RR: $53.73 (2.91)
⛔ Stop Loss: $60.45
REASONS FOR THE TRADE
✔️ Reaching a strong resistance level
✔️ Market Flow Indicator seriously overbought
✔️ Ascending channel upper trendline resistance
✔️ 1.618 Fibonacci Level (although not plotted on the chart as it becomes a bit clustered)
📝 Stop Loss is above the $59-$60 resistance level, although if you want a more relaxed trade you may move the SL higher to about $61. The confluence of the three factors above makes me believe that the price is due for a pullback if not even trend reversion. I will be monitoring the entry level mentioned above and may open the position prematurely if I see that the price is getting ready to take a dive down.