Short CrudeOilThis is a slight tweak to my short call chart yesterday in the 1 hour view. This is my opinion on oil. There is still a potential for more upside before we go down as stated yesterday, up to you if you want to wait for more upside before shorting.
DISCLAIMER
Please note that this chart is an opinion based chart only. Please trade at your own risk
Crudeoilforecast

Crude oil ShortMy pattern earlier became invalidated once we broke 64.65. This has the potential to revisit today's low again.
DISCLAIMER
Please note that this chart is an opinion based chart only. Please trade at your own risk

Short & Buy Crudeoil IntradayFrom here, I believe we will be going down to 63.37 where buyers may want to come in again.
Disclaimer
This chart is an opinion based chart only. Please trade at your own risk.

Short oil Oil has now reached the 0.618 fibonacci line although it has gone past it slightly, which is ok. In my opinion, it hasn't reached a resistance line yet which means this has the potential for more further upside around 67-68 but of course it could just go down from here.
Oil can go straight down from here to 60.70 before going back up to 63.22 and then another down to 58.04. This is of course just my humble opinion which could be wrong, so please trade safely at your own risk.
Disclaimer
This chart is published as an opinion based chart only.

Crude Oil Weekly Report: How long will Oil rally last?U.S. WTI and Brent crude oil futures closed the week higher on Friday.
Which fundamentals drove Crude Oil prices higher this week?
Deeper-than-expected OPEC-led production cuts : Saudi Arabia is delivering on the cuts it pledged, and I have no doubt they’ll deliver on pledges to do more. As I mentioned in my previous articles the reason of the big drop on Oil Prices was a production boost from OPEC and an equity sell-off that pushed oil down during the fourth quarter, and now as both of those elements are in reverse prices are going up.
Trade Deal Optimism : Press reports suggest that the U.S. and China are making progress on trade negotiations, and President Trump has indicated he would be willing to let the talks continue past the March 1 deadline if progress was significant. Trump is expected to meet with China’s vice premier and top trade negotiator on Friday. There are still thorny issues that will be difficult to solve, but markets are welcoming the potential breakthrough in trade talks.
Meanwhile, the EIA report showed that Crude Oil Inventories stocks rose three weeks in a row.
Simply saying, The U.S production is likely to limit the gains for WTI in the near future.
WTI vs BRENT
The spread between Brent crude oil and WTI crude oil has risen from a low of $6.80 on January 31 to a high of nearly $10.00 ( Brent Crude Oil ended the week at 66.90). This is the result of a combination of the OPEC-led production cuts and the sanctions against Venezuelan exports, which are supportive for Brent crude oil, and the rising U.S. production, which is helping to limit gains for WTI crude oil.
Baltic Dry Index:
You can see view the BDI Chart on our website.
BDI rose a bit in February but it is still not promising for Global Economic Activity. Simply saying: Less economic activity, less Oil demand.
IEA is not so bullish:
According to the International Energy Agency, the global oil market will struggle this year to absorb fast-growing crude supply from outside the Organization of the Petroleum Exporting Countries (OPEC), even with the group’s production cuts and U.S. sanctions on Venezuela and Iran.
Furthermore, the IEA said it expected global oil demand this year to grow by 1.4 million bpd, while non-OPEC supply will grow by 1.8 million bpd. This doesn’t bode well for the long-term crude oil bulls.
Crude Oil Weekly Chart:
Fundamentally, there is no reason for Crude Oil prices to be traded above $ 62.50 for the time being. Its retracement zone at $59.38 to $62.50 is the primary upside target. Since the main trend is down, sellers are likely to show up on a test of this zone
On the other side, the potential downside move would be limited as well. OPEC + would not let the Oil Prices stay below $ 50.
Simply saying, potential pullbacks towards $ 50 can be used as a buying opportunity.
Near Term Trade Opportunity:
RSI Divergence H4 Chart
We will look for a short opportunity if the price breaks out the trendline. The first target of the Bears will be 56.25. The breakout of 56.25 would lead the prices 55.75 and 54.70. Those levels can be used as buying opportunities.

CRUDE Oil Forecast: Bulls control the marketPullbacks are buying opportunities
Fundamentals:
Bullish:
OPEC + solid cuts – Latest Announcement from Russia: “We won’t fight with US oil producers”. That means: They will not let the prices go down to stop US drilling activities.
Venezuela Turmoil
Optimism in US-China Trade Talks.
Now we have a new bullish factor: Weakening USD. Simply saying: Historically, weak dollar sends the oil prices higher. Below is the DXY vs WTI correlation chart.
Bearish:
Global Growth Concerns
8M Barrels increase in stocks
Have a nice trading week!

Crude Oil Forecast and Technical Analysis Week of Jan 14-19We have entered two short trades in Crude Oil and they both reached the targets. - See attached setups -
As I have mentioned in the channel, the bearish rally was triggered by weekend profit taking purposes. However, there are still concerns over rising U.S. production, and key issues with China that have to be resolved despite favorable trade talks earlier in the week. The market is underpinned by the OPEC-led production cuts.
Fundamentals which will support the Bullish Move
OPEC and Russia began reducing output by 1.2 million barrels per day on January 1. If they maintain their discipline, this move should trim the global supply glut and stabilize prices.
The US and China ended three-days of constructive trade talks which were productive enough to lead to the scheduling of further negotiations later this month. This news has created enough optimism to drive short-sellers out of the market. Positive developments on the trade talks will accelerate the bullish move.
Fundamentals which will support the Bearish Move
Concerns over the Global Growth – especially China – could add weight on the price. Most analysts have downgraded their global economic growth forecasts below 3 % for 2019.
Increasing U.S. production, which is expected to climb above 12 million bpd this month (Last two week’s EIA Data support this concern), the possibility OPEC and its allies will lose their discipline and US-China trade relations.
Technical Overview and Key Levels:
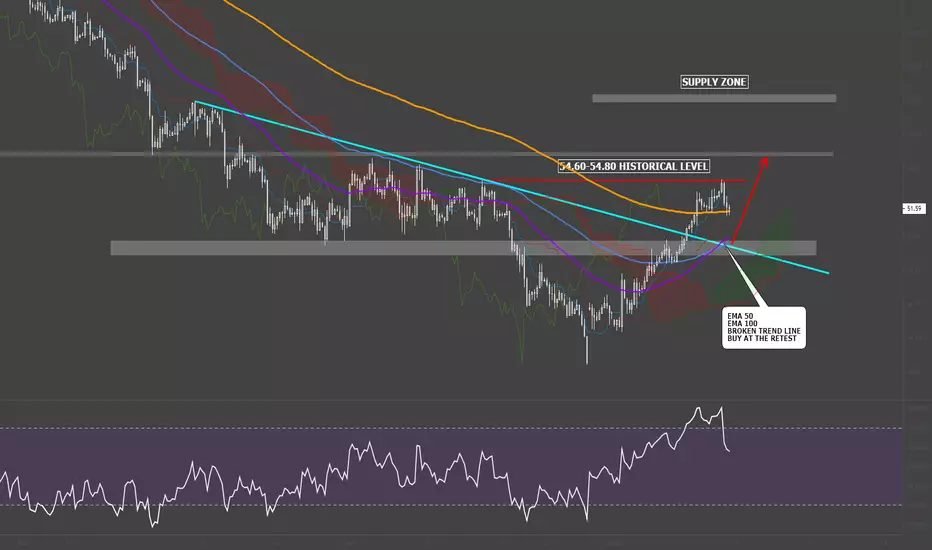
WTI Crude Oil prices rejected EMA 50 / Daily Resistance and pulled back. Crude Oil ended week at 51.59 in the upper Bollinger Band / H4 Chart.
The price is well above EMA 50 and EMA 100 / H4 Chart. Bullish move will continue as long as the WTI prices holds above 51.17.
The midterm bearish scenario would be triggered at the breakout of 51.17. As seen on the H4 Chart, we may see the prices testing the broken trend line where EMA 50/EMA 100 resides at 49.40-49.20.
A potential retest of this level can be used as buying opportunity.
As seen on the below chart, a potential Bullish Shark Pattern formation can be used as long opportunity. – I will publish the details of the pattern for the members.
We will try to use pullbacks as a buying opportunity and our target will be 54.80.
Have a nive trading week.
Crude Oil Completed Double Bottom Bullish Move TriggeredWe have published a detailed forecast and technical analysis yesterday. - See Attached -
After testing 52.70 Crude Oil prices dropped 2 USD triggered by the EIA Inventories Data.
As we have mentioned before 50.20 was a strong support.
The double Bottom formation has been completed. Crude Oil broke the 52.70. The target of the formation is 55.20.
53.13, 54.91, 54.69 will be the first three targets of the Crude Bulls.
Daily Closings above 54.59 will be the confirmation of the trend reversal from Bearish to Bullish.

CRUDE OIL Forecast: Base formation completed ?The reasons for the sell-off on Crude Oil prices:
Oversupply concerns
Global growth concerns
Trade wars and risk off concerns
Global Demand: 95 Million Barrel
Global Supply: Over 105 Million Barrel
What does the market expect from OPEC meeting?
The general expectation at the meeting on December 6 is that the Saudis and Russia agree on a cut of between 500,000 and 1.4 million barrels per day.
Technically:
Monthly Chart : Crude Oil prices tested the Ichimoku Cloud base Senku Span A and recovered. 50.00 USD is the psychological support level for the prices.
Weekly Chart: the price s below the lower Bollinger Band indicating the oversold market.
Daily Chart: The breakout of the rising trend line and the recovery trend after hard sales are noteworthy. The resistance of 51.48 USD is critical, and the closing above this level may indicate a base formation at 49 USD.
What can be done:
Long Term Traders ( Investors )
Buy : at closing 51.48
Stop: Below: 49.00
Target 1: 52.90
Target 2: 53.40
Target 3: 54.60
Target 4: 56.25
Good Luck

Crude Oil Forecast: Focus On OPEC Meeting Supply Cut rumours helping Crude Oil’s recovery. -See Attached Forecast.-
Another Supply Cut signal came from the Russian side. Russia’s Energy Minister Alexander Novak was on the wires last minutes, via Reuters, commenting on the OPEC output policy.
Key Points:
Need to make a balanced decision on OPEC production.
There has been no decision yet.
Russia is planning to sign an agreement on oil output with OPEC.
But this will be discussed in next month’s meeting.
Technically: The overall picture is still bearish. Crude Oil printed a flag pattern. It is trading below EMA 50 on H4 Chart which resides at 58.20. We need to see the price breaking above EMA 50 in order to talk about a midterm trend reversal. However, it is likely to test EMA 50 at 58.20.
Crude Oil prices are likely to trade sideways until the OPEC + meeting of December.
A bearish breakout of the flag pattern would lead to prices towards 52.00 – 50.00 U

Crude Oil Technical Overview: Falling Wedge BreakoutCrude Oil prices ended the week at 68.50 after testing 64.30 the MA 200 support of the daily charts. Bulls were ready at the main support. After three weeks decline, Crude ended the week with the gains.Dollar’s weakness is helping the Crude Oil prices to rise.
On the smaller chart timeframes, Crude Oil ended the week above the SMA 200 which is a good news for the Crude Bulls.
As seen on the H4 chart, price broke out the falling wedge – bullish continuation pattern – at 67.10.
A bearish harmonic XABCD pattern – Total – completed at 69.26 and Crude Oil prices tested 68.25 Fibonacci 23.6 of the CD. If the price breaks below 68.25, 67.90 and 67.50 can be tested.
Those levels can be used as buying opportunities targeting 69.50 and 70.25.
Break and close above 70.25 will carry the price 71.50 and 73.30.

Crude Oil Midterm Forecast : Pullbacks are buying opportunities.I tried to explain everything in the chart.
We do not need too many words.
See the attached Daily Chart. Summer of 2009.

Crude Oil Forecast And Technical Analysis 06-27-2018Total supply of 1 million barrels from Saudi Arabia and Russia in the upcoming period could cover only the half of the 2.43 million barrels/day supply cut of Iran (if all states conform to the US) .
In the current situation of Iran’s daily oil exports of 620 thousand barrels China, 560 thousand barrels of the EU, 470 thousand barrels of India, 400 thousand barrels of South Korea, 230 thousand barrels of Turkey and 140 K to Japan.. Here, 1.8 million barrels of petroleum may be withdrawn from daily world production when it is thought that China is the strongest candidate to comply with the US call. This figure cannot be easily covered by Saudi Arabia and Russia, which can increase capacity. We may see further increase in the Oil Prices.
The price action of the Crude confirms us the same. As we have written in our latest analysis, Crude opened the week with a gap, but the Bulls jumped into the arena.
Technically:
We see the golden cross in the weekly charts. This indicates a new bullish wave.
The scene is almost the same in the H4 Chart timeframe. EMA 50,100 and 200 formed Golden Cross.
US Crude Oil CLc1 is trading at 70.70 – Spot Forex 70.31 – as of writing. This is the Fibonacci 78.6% of the latest decline. An H4 closing above 70.85 – Spot Forex 70.40 – might carry the prices CLc1 71.70 and 72.60 of the latest highs.
Possible pullbacks can be used as buying opportunities. Possible pullback levels to use as buying opportunities are 70.30 and 69.40.
We can not talk about a short term trend reversal as long as the price holds above 69.40.
We will publish our trade idea for premium members separately.

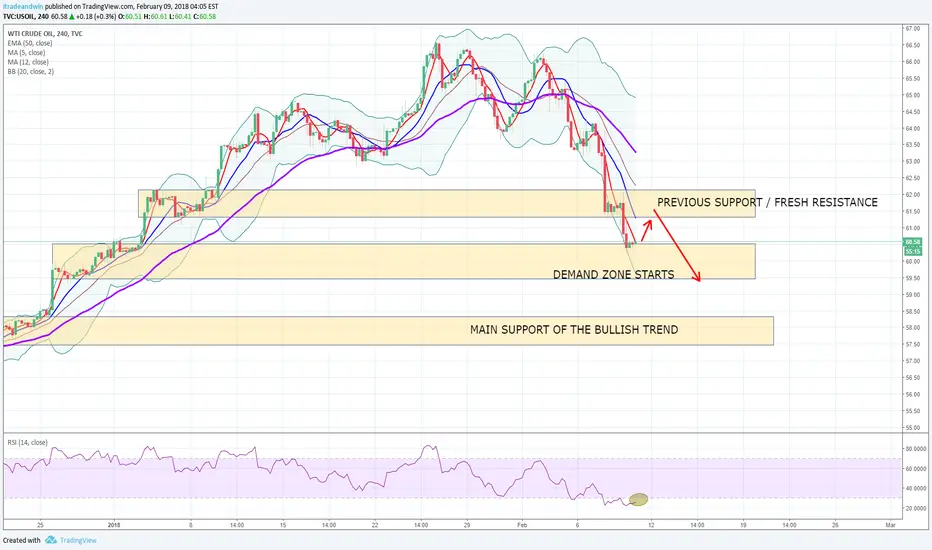
Crude Oil downside to continueCrude Oil have been strong from last year with succession of new tops and lows-whilst it just broke the multi-days bullish channel and undergoing a linear compression setup. Price action and momentum indicators are suggesting the downside to continue towards the prior support area around 61.94. I am looking to short this market around 67.27-66.20 with stop around 68.69, for a target to 61.94 over the coming days.

Crude Oil Forecast And Technical Analysis : Eyes on OPEC SummitThe rumours that Saudi Arabia and Russia might decide to increase production caused oil prices to fall to close to 3 % on Friday. Meanwhile; U.S. exports were threatened by potential Chinese tariffs on crude oil and refined products.
Saudi Arabia and Russia have already boosted production modestly, and have indicated they were prepared to increase output at that meeting.
Some investors were surprised when crude oil and other energy products were included for tariffs at a later date, the official Xinhua news agency reported, citing the Tariff Commission of the State Council.
Over the past six months, the United States has exported an average 363,000 bpd of crude oil to China, which along with Canada is the biggest buyer of U.S. crude.
Technically:
The short term trend is bearish.
A bearish flag formation completed in the H4 chart. The target of the formation is 62.80.
Crude ended the week 64.24 which meets Fibonacci 78.60 %. At the same level, we see the MM 0/8 Main Support.
From the indicator’s point of view, The price is below EMA 50 and EMA 100 in the daily chart. 62.50 is the main support of the prices.
Key Levels: On the upside 64.45 and 64.28 are the resistance levels. We plan to use possible pullbacks towards those levels as selling opportunities. 62.50 is the main support of the midterm bullish trend. A daily closing below 64.00 USD will carry the prices to 62.50.
Our Bias: BEARISH with the target 62.50
Join Our Premium Club to get the latest analysis and trade ideas with high accuracy.

Crude Oil technical analysis and levels to watchAs mentioned in the latest analysis, our LONG target was 65.25 – 65.50 region.
Then we followed the bearish harmonic pattern, and our second target was 64.06. Price reached the second target and reacted. – 110 pips were not bad –
We tried to explain the bullish and bearish fundamentals of Crude Oil.
The main trend is bullish.
Intraday Levels to keep eye on :
64.84 is the first support. The bullish move will continue as long as the price holds above 64.84.
65.26 and 65.63 are the next targets. Daily closing above 65.63 will take the price 66.41 and 67.49.
If the breaks below 64.84, 64.45 and 64.06 will be the targets of Crude Oil.
63.33 is the EMA support and can be used as buying opportunity.
Good Luck

Crude Oil Forecast And Technical AnalysisFundamentally, tensions in the Middle East supporting the Bullish Move in Crude Oil prices.
However; climb in U.S. production is capping WTI oil prices and undermining efforts from the Organization of the Petroleum Exporting Countries (OPEC) to prop up prices by withholding production.
DXY is also important in the midterm direction of Crude Prices. We need to wait FED's decision and markets reaction.
Technically:
The main trend is still bullish. On the H4 chart, the price is above all major EMAs. And we see the golden cross of EMA 50,100 AND 200 which indicates a stronger bullish bias.
Key Levels.
63.30 remains as a strong resistance.
Support zone is 61.70 – 61.30
Pullbacks towards 61.70 can be used as buying opportunities.
Another buying opportunity is close above 63.30 and the target will be 65.40-65.60
Intraday Levels:
62.50 MM 8/8. Bullish intraday bias will continue as long as the price remains above 62.50.
On the downside: 62.11, 61.72 and 61.33 ( Pullback Levels to use as buying opportunities )
On the upside: 62.89 and 63.28. ( Above 63.28, the new midterm target will be 65.40)
DISCLAIMER: This is a technical analysis study, not an advice or recommendation to invest money on.

CRUDE OIL Retests 66.50, what will be the next target?I will keep it simple and short.
I have entered LONG trade from 46.70
And the target was 68.00.
Today we have reached the critical point again.
Crude will retest 66.40-66.60 regions.
Weak USD is helping Crude’s bullish move.
However, rising US production and inventories limit the upside move.
If Crude breaks and makes a few closings above 66.60, 67.18 and 68.00 levels will be the next targets. If fails to break above, 65.60, 64 and 62.50 will be the targets.
DXY will play an important role in the prices.

Crude Oil Forecast and Technical Analysis Dec 8thA strengthening U.S. dollar makes a negative effect on Crude Oil prices. However; Chinese data of earlier today supported the price.
For the midterm, we keep our idea of 60-62 USD.
2 important fundamentals are supporting the price:
OPEC supply cut
China’s demand which will this year overtake the United States as the world’s biggest crude importer. China’s crude oil imports rose to 37.04 million tonnes in November, or 9.01 million barrels per day the second highest on record, data from the General Administration of Customs showed on Friday.
Crude Oil Forecast and Technical:
After a weak EIA data outcome, Crude Oil dropped and tested EMA 200 support of the H4 chart 55.85.
After the data, I shared on the telegram channel and mentioned 55.85.
It is positive for the Crude Oil price to stay above this support. Traders may have overdone it with lighter holiday volume and we could chart a course for higher prices again.
56.25 and 56.64 have been broken very fast. Now we have reached the main resistance: 57.00
Why 57.00 is important:
1.EMA 100 and EMA 50 resistances of the H4 chart
2.MA 20 / Median Bollinger Bands Line
RSI headed North Again.
What can be done for intraday trade?
An H4 closing above 57.10 will carry the price upper Bollinger Band on the daily chart. The targets will be 57.40 and 57.80.
If the price cannot break above 57.10, 56.64 and 56.25 will be tested again.

US CRUDE OIL - H4 SELL SETUPUS crude oil - H4 chart - I prefer shorts due to bearish structure on H4 time frame. Main trend is still bullish so this is a reversal setup on daily time frame but with-trend pull back setup on H4 so quick swing with great risk to reward.


