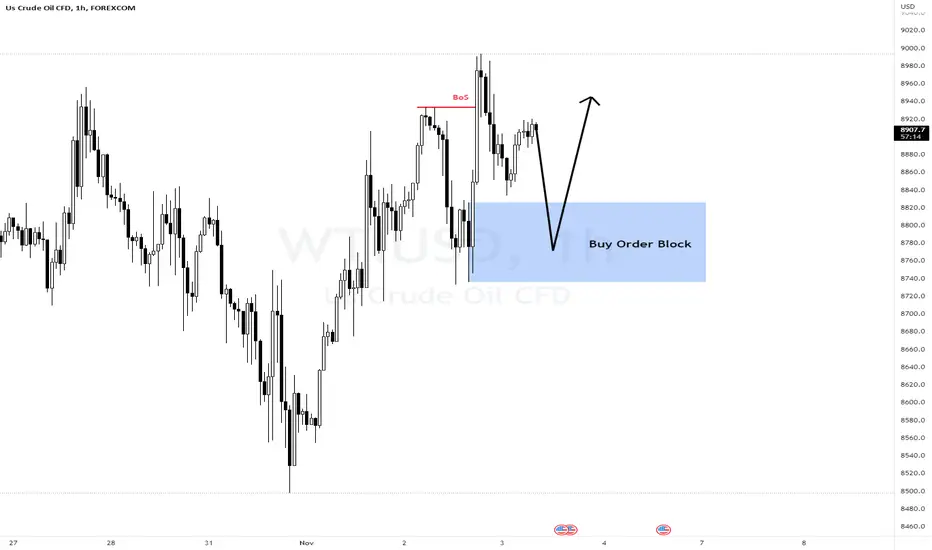
Crude Oil Idea H1Here is my view for WTIUSD on H1. The price could go up, you can put a pending order on the Order block or find an entry on LTF within OB Zone. Trade Safe!
Crudeoilforecast
CRUDE OIL TRADE ENTRYIn the crude oil we have strong level of resistance where price close on friday and sort of rejecting from 84.87 level and we also have 200 ema at 87.91 so this zone is very strong and oil need high volume to break this area and after this we have a strong trend line resistance to upside and price rejecting multiple time from this level also so i am looking selling entry from the current price if oil break its support to downside than we expect price come to yellow zone to fill the gap area and if price break to upside than we looking short from the selling close from the trend line for the target of yellow zone becoz crude oil have a very big gap and price need to fill this gap must/

Wticousd More downsideWticousd More downside I m expecting bearish move and .long term sell trend .H4 market break the demand zone and gave the supply zone .so we will sell from supply zone

USOIL - Crude Oil Bullish move is readyLets keep it simple for everyone !
USOIL / Crude OIL is near 84-85 level which results in 0.236 fib level.
Oil can move up from this level , upto 91.5
If Oil falls below 84 . then we will see OIL touching 80

Week Ahead: Gas demand weaker
* Oil Formed a descending Triangle. Giving more bearish confirmation of target of $60
* FED giving signs of another 75-point basis hike. Recession fears are bearish for oil
* Demand slows down worries due to China’s zero COVID policy and OPEC+ cutting production
* Energy Price Cap
oil gapped up from opening on September 4th. Extended 3% by September 5th. Then losing almost 10% of gains. Reaching the price of $90 on September 5th, and dropping to $81 on September 8th. Then ended the week with a 5% gain. Closing weekly at the lowest since January 17th starting week.
Crude oil inventories rose last week by 8.844 million. Indicating demand is weakening. It was expected inventories were to fall by just 250,000 barrels.
I am anticipating oil to gap down during opening today. I am waiting to see how it will react to this trend line if it is going to continue down. Broke out of the descending triangle. Looks like it came back up for the last touch
On Sunday, September 4, 2022, Russia announced the closure of its main gas supply pipeline to Europe. This spiked fears into the energy market. Both Natural gas and crude oil both gapped 1% before the closing of September 4th. Monday, September 5th the OPEC+ held a meeting. Production was cut by 100,000 barrels a day for the month of October. OPEC+ is already below meeting production. Supply fears pushed Oil up 5%. After oil digested the news it fell from $90 to about $81.14.
Concerns of sluggish global demand outweighed the warning of President Vladimir Putin about the potential withdrawal of oil form of Russian Energy. Also new COVID lockdowns in China. Chinese imports fell 9.8% in August. The OPEC+ cut was larger for Asia and Europe indicating weaker anticipated demand.
Russian President Vladimir Putin to halt all oil and gas supplies if price caps are imposed on Russian energy resources. Hours later EU proposed to cap Russian gas.
The OPEC+ cut was done due to the possibility of a nuclear deal between the U.S. and Iran. This deal is expected to release over 1 million BPD of supply into the market

Crude Oil Idea H4Here is my view for WTIUSD on H4. The price could go down, you can put a pending order on the Order block or find an entry on LTF within OB Zone. Trade Safe!

My swing Full Margin Setup on WTI CRUDE OILThis setup taught by my awesome teacher, a legendary trader from Malaysia, Mansor Sapari.
But man, to get this setup, you need to have a very very strong patience. Of course this setup is not my only setup to trade.
In order to get a complete setup:
Must have
-fakeout
-compression
-cap price zone
-support resistance
-supply zone
-resistance become support
-breakout
-double maru candlestick
-divergence on MACD/AO
-some times it goes well if there's a news (fundamental aspect)
Sorry, my english is not very good to explain. But I'll to explain it in video next time.
Please help me to grow my youtube channel, I would like to share and help others in trading. I also need to learn more stuff.
Search & SUBSCRIBE my channel "The Musician Trader"

WTI CRUDE OIL - Daily TF AnalysisWTI CRUDE OIL on daily TF. There's two zone for scalper to make money. Let's see how price react.

WTI CRUDE OIL - Weekly TF AnalysisMake it simple. Crude Oil weekly TF analysis. Just find the supply demand area, or you may use Fibo to know where will the price possibly go. For swing trader, just wait. For scalper you definitely can take a bite.

CRUDE (CL1!) Will Go Up!CL1! broke the falling resistance
Which turned into a local support
And as the pair is retesting the level now
I think there is a high chance
To see a rebound to the upside

CRUDEOIL SEPTEMBER, 2022 LEVELSCrudeOil is currently in a range and giving volatile moves either sides based on market sentiments!
Important Levels to long and short have been marked with targets on either side! Longer TF is currently neutral and a breach of either side marked levels will trigger fresh move of 300-400 points!


OIL LONG OIL just retested the bullish order block after breaking structure last week and should be ready to test the bearish weekly order block before more downside.
good rr here its hard not to take this trade.

Crude Oil Idea H4Here is my view for WTIUSD/Crude Oil on H4. The price could go down, you can put a pending order on the Order block or find an entry on LTF within OB Zone. Trade Safe!

Crude oil important levelsOn monthly time frame (Chart A) crude is in a retracement of an uptrend, and important levels are marked in colour blue, and currently it took support in an important level at 7835. Again, if it fails to sustain, and move downside from here then below 5796 it will be termed as bearish, which is on monthly time frame. 9158 will be an important level, after crossing this level only crude will be termed as bearish again (Monthly time frame).
Now if we see in daily time frame (chart B), it was in down trend, which was basically the retracement of the monthly uptrend, has not taken a halt, and may take reversal from here (forming tops 1 & 2). Important levels are marked in the chart B (colour purple), which will act as resistance. And if it unable to continue its up move and take a reversal, closing of a daily candle below 7670 (marked colour green in chart B) level then it will again be a continuation of downtrend.
*Observation purely based on price action*

Crude oil is headinding towards Bull sideHopefully US oil is moving towards the long side as the major support is re tested several times. So kindly do ur own research and take right entries.

crudeoil get ready for the long runCrude oil has broke the channel and gave a good retrace.
So hopefully the trend seems to be in the long side.
Do your own analysis and take the right entry.


Good bearish trend in last week so a small recovery is needed.So the recovery will determine whether the market to more long or its going to remain in the same bearish trend.
So kindly plan accordingly as per your analysis.

US oil seems to be bearish for this week tooMost probably the trend seems to be bearish as the weekly channel has broken and the retest is going to finish its high.
So plan your trades wisely.
Thank You.

Crude levels for july expiry Most probably the trend seems to be bearish as the weekly channel has broken but a slight retrace can help a little bit high.
So plan your trades wisely.
Thank You.

Crude Oil Idea H1Here is my view for WTIUSD on H1. The price could go down, you can put a pending order on the Order block or find an entry on LTF within OB Zone. Trade Safe!
