WTI Crude Oil Regains Bullish MomentumWTI Crude Oil Regains Bullish Momentum
WTI Crude oil prices climbed higher above $70.00 and might extend gains.
Important Takeaways for WTI Crude Oil Price Analysis Today
- WTI Crude oil prices started a decent increase above the $65.00 and $68.50 resistance levels.
- There is a major bullish trend line forming with support at $71.50 on the hourly chart of XTI/USD at FXOpen.
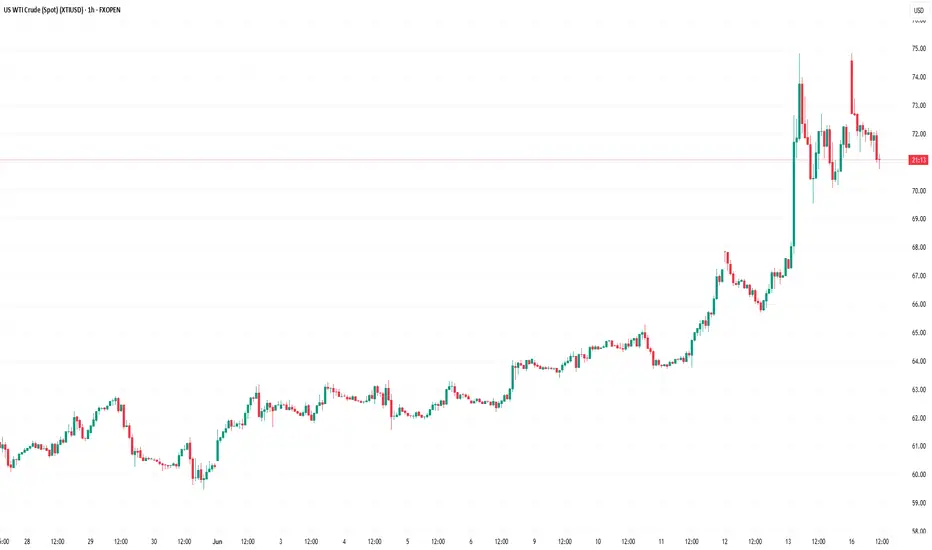
Oil Price Technical Analysis
On the hourly chart of WTI Crude Oil at FXOpen, the price started a decent upward move from $65.00 against the US Dollar. The price gained bullish momentum after it broke the $68.50 resistance and the 50-hour simple moving average.
The bulls pushed the price above the $69.50 and $71.50 resistance levels. The recent high was formed at $74.80 and the price started a downside correction. There was a minor move below the 50% Fib retracement level of the upward move from the $69.55 swing low to the $74.83 high.
The RSI is now below the 60 level. Immediate support on the downside is near the $71.50 zone. There is also a major bullish trend line forming with support at $71.50 and the 61.8% Fib retracement level of the upward move from the $69.55 swing low to the $74.83 high.
The next major support on the WTI crude oil chart is near the $69.50 zone, below which the price could test the $67.90 level. If there is a downside break, the price might decline toward $65.20. Any more losses may perhaps open the doors for a move toward the $63.75 support zone.
If the price climbs higher again, it could face resistance near $72.50. The next major resistance is near the $74.80 level. Any more gains might send the price toward the $78.50 level.
This article represents the opinion of the Companies operating under the FXOpen brand only. It is not to be construed as an offer, solicitation, or recommendation with respect to products and services provided by the Companies operating under the FXOpen brand, nor is it to be considered financial advice.
Crudeoiloutlook
Crude Oil Intraday Trading Levels for Scalping - 29Sep2021Crude Oil Intraday Trading Levels for Scalping - 29Sep2021

Crude oil - Is the bottom visible yet...? Resuming from previous Crude oil Post in the blog, check it here...
Obviously yes the bottom is in the visible limits
We at that time just had an idea that the developing correction could be a triangle but in the recent trading sessions, it is really very clear that the current correction is most possibly a triangle (Elliott wave Descending triangle) and within which the waves ABC have been completed and the remaining two legs D & E are about to be completed and as in a descending triangle the characteristics of the same is to test the support multiple times and which is what the D wave is going to do exactly and after that the E ( FINAL ) wave as dictated by the principle will be a multiple of FIBO numbers, with respect to Previous C wave rally and most possibly the .786 will be the target for the above stated E wave.
View the video as it also explains below one degree from daily charts to H4 charts.
visit the thread with video here,
www.mytradingcourses.com

What is crude oil's next decision...?
Resuming from previous Crude oil Post in the blog, check it from what's happening section...
We at that time just had an idea that the developing correction could be a triangle but in the recent trading sessions, it is really very clear that the current correction is most possibly a triangle (Elliott wave Descending triangle) and within which the waves ABC have been completed and the remaining two legs D & E are about to be completed and as in a descending triangle the characteristics of the same is to test the support multiple times and which is what the D wave is going to do exactly and after that the E ( FINAL ) wave as dictated by the principle will be a multiple of FIBO numbers, with respect to Previous C wave rally and most possibly the .786 will be the target for the above stated E wave.
View the video as it also explains below one degree from daily charts to H4 charts.
www.mytradingcourses.com

CRUDE LONGCRUDE is expected to rise now.
There are many reason why we feel it may rise.
01. It has bounced back from quarterly sell target 02 level.
02. Bullish Engulfing pattern in daily Chart.
03. To rise and clear quarterly targets it had to come down to gain momentum for up move.
04. Stoch RSI (3,3,14,Close) states it may rise.
05. RSI(14,CLOSE) Is also of the same view.
06. CCI(20,CLOSE) Is also rising.
Keeping all the above indicators in view along with the chart pattern we expect it to rise. Our buy call shall be from BUY above :29.60 with a SL @: 30.39 Tgt 01: 29.8 Tgt 02: 32.19 Tgt 03: 32.80. Chances are that it may even touch 40. We are expecting this to happen shortly. Caution: The above is our personal view. Neither a recommendation nor a tip nor an advice for trade. Please consult your personal financial advisor before investing.
