Crude Oil - UpdateIt appears crude oil is still in a larger ABC correction. Possibly hit 4820 again or 4857
Crudeoilwti


Crude Oil - UpdateUpdate to Crude Oil idea - C (wave 2 down) completed on Friday and wave 1 of 1 of 3 down completed on Monday. Expecting price to reach either 4787 or 4807 to complete wave 2 of 1 before wave 3 of 1 to 4591


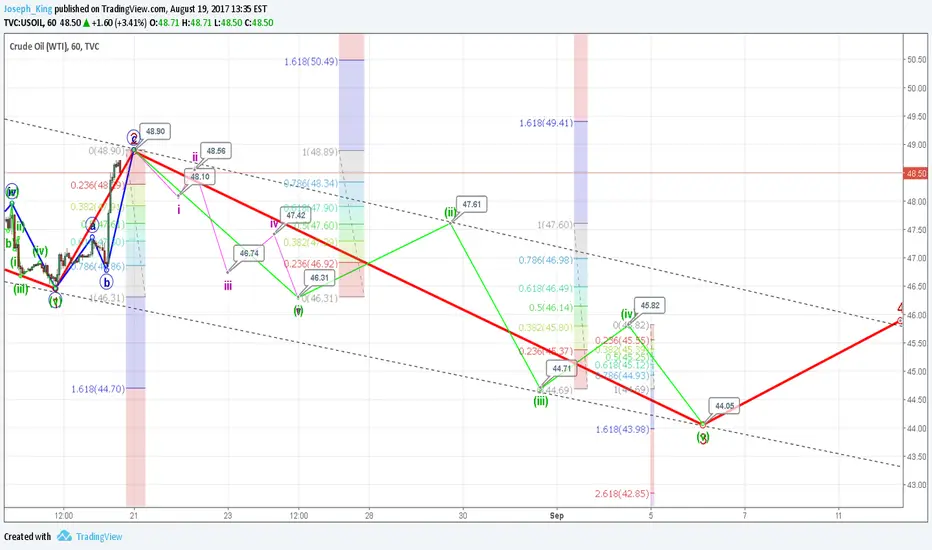
Crude Oil - Internals of Wave 3 DownIf Crude Oil does drop after reach 4890 I have plotted the internals of wave 3 down:
Pink Waves:
A. Wave 1 0.382 of C
B. Wave 2 0.5 of wave 1
C. Wave 3 2.618 of wave 1
D. Wave 4 0.382 of wave 3
E. Wave 5 1.618 of wave 4
Green Waves:
A. Wave 2 0.5 of wave 1
B. Wave 3 2.618 of wave 1
C. Wave 4 0.382 of wave 3
D. Wave 5 1.618 of wave 4
The larger wave 3 (red waves) was projected from the larger wave 1 in my previous chart to end around 4404 and these internal waves point to 4398
Crude Still Heading SouthCrude spiked on Friday due to an impulsive C wave (in my opinion) from 4647 toward 4890 (0.618 retrace of 5041/4647) on its way to complete wave 2 down.
Waves 3, 4 & 5 have been plotted using 1.618 of wave 1 for wave 3, 0.382 of wave 3 for wave 4 and 1.618 of wave 4 for wave 5. No consideration for wave extensions to 3 & 5, so price could go much lower than plotted if extensions to 2.618 occur.
It should be noted that wave 2 down can reach as high as 5041 and still be valid for Elliot Wave rules so plenty of upside left potentially (the internal wave 2 of wave 1 hit 5021, way beyond 0.618 of wave 1 at 5041).
Holding short positions from 4835-4850 with SL 4897.

Crude Long Chart shows everything.
4 hour closed above MA9 ergo -and RSI seems fine. Ergo -I went long.

Crude oil coming closer to Strong supply zonesCrude Oil has been in counter uptrend since june 21st 2017 and will reach a strong supply zone around $50 to $52. I am expecting a reversal from there in 1-2 weeks from today.
After the market opens on monday, the crude oil is expected to trade above $47.70 for a few days till it come closer to $50. As it comes closer to $50 expect sellers to step in, and slowly supply will exceed the demand. And as supply get stronger from $50 to $52 a reversal of trend is expected.


Crude Oil looks to be moving in a Triangle (Elliott Wave)After completing Wave 3, it seems that Crude Oil is stuck in a sideways movement as of now which looks most likely as a Triangle.
A break above 48.35 or 49.93 would say that things are otherwise.
Overall I expect one leg up after the completion of this pattern for Wave 5.
I will update further as this market progresses.

USOIL INDISDE A DESCENDING CHANNELMARKET ANALYSIS: The pair is now trading inside a descending channel. As of now the current scenario shows that the market tends to reach the channel resistance. So once we reach the resistance and the candle gives us a better confirmation for shorting, We can go for sell trade setup. So lets wait and see what the market does in the coming days. Cheers!

Crude in Bearish Three Drives PatternCrude is currently in a bearish three drives pattern heading toward $4820.
Current ABC:
1. A wave completed at 4557.
2. B wave should retrace 50% of A wave to 4667.
3. C wave should retrace 1.618 of B wave to 4490.
5 wave set after ABC complete:
1. Wave 1 should retrace 100% of C wave (50% of the entire ABC move) to 4667.
2. Wave 2 should retrace 50% of wave 1 to 4577
3. Wave 3 should hit 1.618 of wave 1 at 4775.
4. Wave 4 should retrace 0.382 of wave 3 to 4699.
5. Wave 5 should hit 1.618 of wave 4 to 4822.

Short Crude Oil at Key Resistance zoneFX:USOIL had been retracing its bearish trend the last two weeks. It is now currently at key resistance zone. Short order set up for the following reasons:
Overall trend on daily chart is down
Price resisted key resistance zone at 47.00 to 47.75 (previous April 2016 to June 2017 channel support now became resistance)
Forming a shooting star candlestick patteren (bearish wick protruding surrounding price action with bearish close)
Sufficient confluence to support a short, but due to recent higher low that formed, stop will be moved to breakeven at around 45.00
Minimum of 1.5 RR but potentially > 2RR
Stop Entry: 46.73; Stop loss: 47.81; Take profit: 43.72 (2.79 RR)

short oil readyi will go short on oil at 4.93 as soon as i get a candle stick formation for going short


Crude Head and ShouldersWould consider mortgaging the house to short $52 for this theory and buy the double bottom at $26

USOIL WTI : 800 Pips opportunity Hey guys ! ** Watch for weekly view below **
Here is a good opportunity to short the crude oil with a potential 800 pips profit trade ( R/R around 6 )
Accumulation of :
- Weekly trend ( blue )
- More weekly trend as resistance ( black )
- Others monthly trends ( red ) : far but still active
- Fib 68.2
- Fib 78.6
- Resistance zone
- Stochastic will be overbought : I will update this idea with a multi time frame stochastic system .
As always , I recommand to wait for a reversal sign .
Follow me for more !
Good '' luck ''

Symmetry of Crude (UPDATE)Added Andrews Pitchfork to the chart - Lots of similarities; interaction between trendline, pitchfork line and price at $48,74 in 2016 and now.

USDWTI Daily. Being 2 steps ahead.Hello everyone. I hope it goes all well for You. I have been working this set up out this evening. Crude Oil seems to be struggling and is not giving us a wild rally eventhough we had two consecutive very bullish stockpile reports. The first one that came out on July the 6th has not endured the bears pressure and session closed much lower than the days high. Have a look Yourself and please share Your view at this idea with us! It may be a little bit too optimistic and too far ahead reaching, but what makes us successfull if not being endlessly positive about our own ideas? As You can see above we have a bullish butterly forming out in the space of the next several weeks. The trend has been respected as well as supply/demand levels along with fibonacci have been accomplished. I hope the idea is well explained. Should You have any questions, advises or even different, more sensible idea? Feel free to message me!


Oil Remains A SellThe daily time frame shows that oil is heading to the lower orange trend line again. Stoch indicator is also supporting this indicator thats its a clear sell. Oil is also still setting lower highs and lower lows.
However, oil has already completed the bearish 5 wave Elliot structure. This is usually followed by a by bullish wave structure and indeed we can see a green wave after the 5th bearish wave. this green wave could be the 1st wave of the bullish wave structure an are now in the 2nd wave which is down. How ever this 2nd wave cant break the start of wave 1 meaning that very soon price will reverse back up again into the 3rd wave. An easy way to find this out is the Red Trend Line. If the daily candle closes above the Red Trend Line its a buy with 1st target at the Purple Trend Line and 2nd target and the Red Trend Line.
Trading advice:
1. Sell with a stop a bit above the red trend line. Target is the orange lower range. (If stop gets hit and daily candle closes above the red line then switch to buying)
2. If you dont feel comfortable with selling then either wait with buying till price has hit the lower orange range or till the daily candle closes above the red trend line.

Weekly outlookThis might hold and go higher but could be an excellent opportunity for a short term short. Sell the %50 1st target 43.38, could 2nd target 42.99 and could be a strong reversal.
