Thoughts on Crude Oil Brent I haven't been too involved with Crude Oil, mainly because as I saw the trend moving up, I didn't enter when I wanted, and the last thing I wanted to do was chase a rally. So, I stood on the sidelines observing, see what my hypothetical entries and stops would've done.
Looking at it now, I see a longer term wedge pattern forming in the weekly charts. Now, when I go into the daily charts, I see Crude Oil falling towards its 50 MA. If it bounces off of this average, I am looking then at the resistance price line of 56.89. If It can break through that resistance line, we might have enough momentum to break up higher. Another reason for this would be the short positions would probably put their stop losses right at that level, creating a virtual short squeeze zone right above support. However, the reverse would be true in theory for the long side of the trade, with most people putting their stop losses right below that 50 MA.
Either way, it'll be interesting to see how this plays out. Trying to work more on investors psychology through the TA in charts.
All the best,
RC
Crudeoilwti


Expecting drop in Crude Oil (Elliott Wave Analysis)Crude Oil seems to be moving in an 3 Wave corrective structure.
Hence I expect it to achieve atleast
T1 : 53.30
if further downside is seem then it can drop till
T2 : 51.80
Even lower levels uptill 50.80 are possible but that is something we can only talk about later on.
From a positional perspective this market is a buy on dips as I believe much more upside remains, positional traders should wait for the 3 Wave completion and then add on to there longs.
I will update further as this market progresses.


Crude Oil with Target $63??? At the moment, the level of $54- 55 plays the role of strong resistance. If the level breaks $ 55, then Crude oil can gather in the $ 63 zone.

WTI Crude Oil (USOIL) Syria Airstrikes = Bullish- Oil is fundamentally bullish as airstrikes in Syria threaten Middle Eastern supply, account for roughly 1/3 of daily oil production.
- Previous short trade cancelled.
- Cyclical demand driving up price.
- Closed above Bollinger band last Thursday, 6th April.
- Close above 61.8% signals a general uptrend.

Crude Oil Updated Count (Elliott Wave Analysis)I have changed the placing for Wave 5 as it broke upside the previously supposed turning point.
The Wave 5 now positioned has also hit an important resistance level, I'm expecting a break of the lower trendline for Wave 2 formation, once the trendline break is in place we can then look for the possible targets for Wave 2 down.


Long term view on Crude OilHere is a simple look at my long term view on oil, which lines up relatively well with my expectation for the S&P. As you can see, on the weekly chart, it had appears that we had broken out, but we kept retesting that breakout level as support without getting any really solid bounce. Finally, we broke down into the previous trading channel again and went straight for the bottom of that channel. My shorter term view is that we may drop some early this week (4/3/2017) but ultimately we retest the top of that channel once more, now as resistance again, which is around the $53 level. Following this touch, oil should head back down to the bottom of the channel but this time with a clear and heavy break, sending oil quickly to $45. We will likely move slowly down/sideways until mid/late October of 2017 when I expect the speed of the drop to pick up significantly, ultimately breaking down below the previous low and making a new 16 year low below $25, maybe as low as the $22's. This drop is also reasonable from a fundemental perspective given the continued oversupply of oil to the market and the U.S. attempting to gain a bigger share of the oil market with 2017 production expected to increase. The most resent rig count of 662 has basically doubled from a year ago when at the end of April 2016 the rig count was just 332. That coupled with lesser regulations under the Trump administration. In addition, another OPEC cut decision is expected to come as early as July of 2017 but if that falls through, it could be yet another catalyst for lower oil. We are looking for this next drop to be slightly lower than the previous low. After this is accomplished, I expect a new uptrend in oil to begin, leading oil to the mid $70's again.


Oil CL remains under pressureShort-term consolidation is underway, with Crude Oil prices currently balanced around the USD47.20, (61.8%) Fibonacci retracement.
However downside risks remain in force as bearish weekly studies deepen.
Further weakness is looked for, with a break below the USD47.01 low of 22 March opening up the USD45.28, (76.4%) retracement. Still lower is the USD44.82 low of 29 November.
Resistance is lowered to the USD49.62 high of 16 March. Any immediate break above here should fade beneath the USD50.71 congestion base, as investor sentiment remain bearish. If broken, not seen, prices will trade back into previous congestion, with USD53.00 to then attract.


Thoughts on USOil for the coming week of 2017-03-20I'm currently on the side with USOil but looking for a pullback to continue to the 49.9x-50.1x range before moving down further.
4hr chart since 3/14, has been correcting from it's drop from the 54.8x range. I'm looking for price to pull back into the 49.9x to 50.1x range before moving down to my next target of 44.7x.
I'll be watching for the following confirmation and triggers:
DMI: Does the ADX remain above 20 or does it drop below signaling potential price consolidation. Price consolidation not a guarantee if it does drop below 20 but could be a factor
TSI: Begins to diverge with price as price moves up to 49.9x - 50.1x range
TRIX: Remains above 0 until price objective is hit
RSI: Pushes up to the 6x area
Should these hold and play out, triggers will be a move below 0 for TSI and failure to pullback above 0 on price pullback. TRIX moves below 0. -DI of DMI continues to make new highs while pulling ADX up with it
Daily chart with weekly channel based on weekly ADX. Current target is 44.7x
Weekly chart I believe most indicators have moved negative. The TRIX remains above 0 but has crossed averages and heading in that direction.
Scenario: Price continues pull back toward 49.9x-50.1x range this week then begins drop to 44.7x. Should this play out, I think there will be ~3 weeks of price consolidation while market decides what to do at bottom of the weekly channel in place. After this period, price continues down with possible targets of 40.2x, 35.0x, and 28.4x.

history..after the break of support (yellow area), history tells us that the WTI can drop in area 43 $


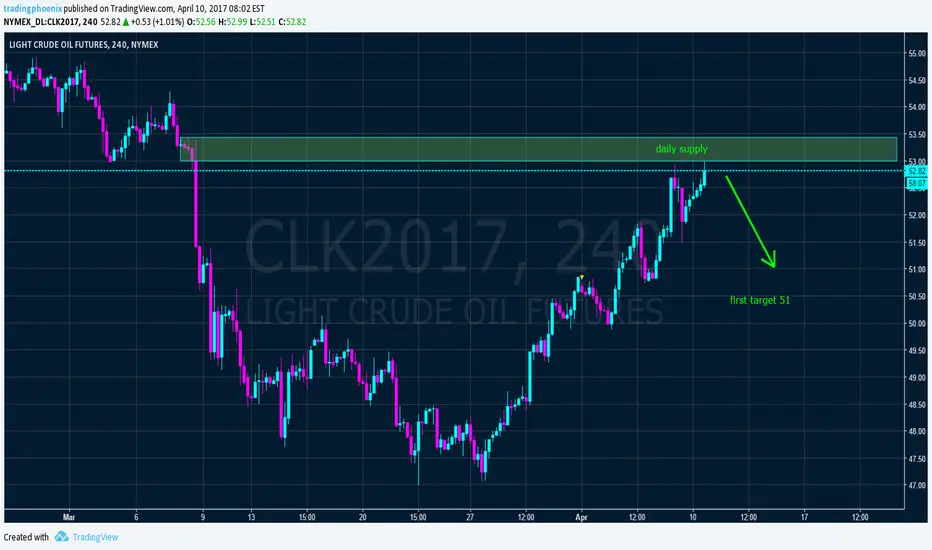
Crude oilCrude oil is in range 51-55.
It broke all uptrend support lines and now new bearish wave is coming.
TP1 51


