PENDLEUSDT 1D Chart Analysis|Bullish Breakout Eyes Higher TargetPENDLEUSDT 1D Chart Analysis | Bullish Breakout Eyes Higher Targets
🔍 Let’s break down the PENDLE/USDT daily chart, focusing on breakouts above key resistance, Fibonacci retracement dynamics, RSI momentum, and volume confirmation for a comprehensive bullish setup.
⏳ Daily Overview
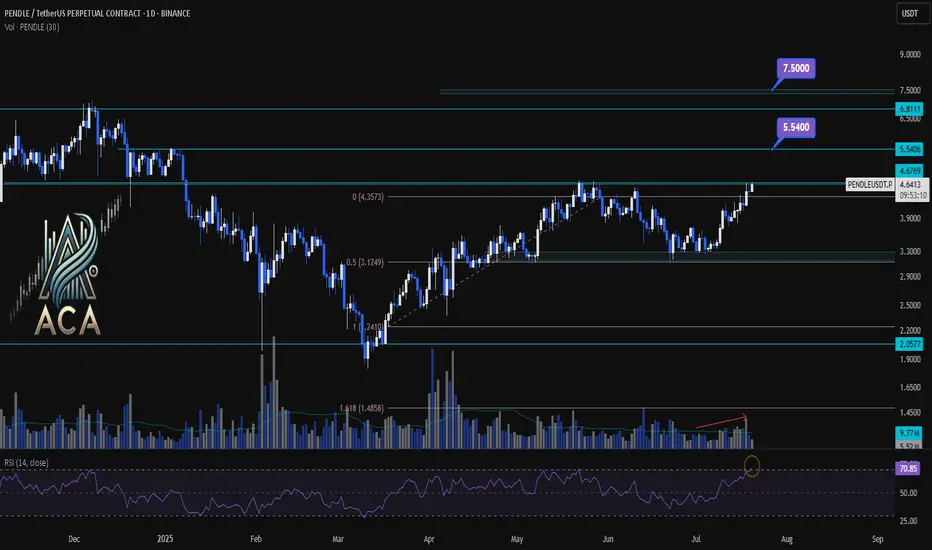
PENDLE has staged a powerful recovery after pulling back to the 0.5 Fibonacci retracement level (around $3.12). Price is now testing the critical $4.68 resistance—the ceiling from the last corrective wave. RSI has jumped above 71, entering the overbought zone, a classic precursor to strong momentum moves. Volume is rising as bulls attempt a breakout, confirming participation behind the price action.
📈 Technical Convergence and Trend Structure
- Fibonacci Structure: The correction held the 0.5 retracement, a textbook bullish reversal zone in rising trends.
- Resistance Breakout: Price is challenging the $4.68 resistance. A daily close above, especially with high volume, would confirm the breakout and trigger bullish continuation.
- RSI Indicator: RSI has cleared the 70 mark, reinforcing strong momentum. Overbought RSI often supports further rallies when backed by breakout moves and rising volume.
- Volume Confirmation: Volume surged as PENDLE reclaimed lost ground and is now accelerating into the resistance test, suggesting trend conviction and confirming the move.
🔺 Bullish Setup & Targets
- First target: $5.54 — the next resistance based on historical supply and Fibonacci extension.
- If macro conditions like interest rate cuts align, the next potential target: $7.50 — the major extension target where price discovery is likely.
- Key trigger: A strong daily (or weekly) close above $4.68, combined with breakout volume, is likely to ignite the next leg up.
📊 Key Highlights
- Correction held at the 0.5 Fibo, signaling trend health and resetting momentum.
- A bullish daily structure aligned with a weekly breakout confluence.
- RSI and price action both making new local highs — strong uptrend indication.
- Volume confirming the move—a real breakout is underway, not a false start.
🚨 Conclusion
PENDLE/USDT looks primed for continuation higher. The blend of a successful 0.5 retracement retest, breakout attempt above $4.68, robust RSI, and volume surge all point to bullish follow-through. Watch for a confirmed close above resistance as the catalyst for further upside, with $5.54 and $7.50 the next logical targets if momentum persists.
Cruptocurrency
BTCUSDT.. single supporting area , holds or not ??#BTCUSDT.. so market just reached at his most important area is around 81400 to 81600
And that is our in-between range area actually so keep close it and if market hold that area then again buying expected towards range upper line.
Note: below 81400 we will go for CUT n reverse on confirmation.
Good luck
Trade wisely

AVAX Long Trade OpportunityMarket Context:
AVAX is testing a major support level and showing signs of potential reversal or consolidation at this price zone, which offers a favorable risk-to-reward ratio.
Trade Details:
Entry Zone: Around $24.00
Take Profit Targets:
$30.50 - $35.00
$41.50 - $45.00
Stop Loss: Just below $21.20
This trade looks to capitalize on the support hold for a potential upside breakout. 📈

BTCUSDT Short Swing trade.Hello everyone, i want to share my price prediction at Bitcoin.
The week started with strong sell which activated buyers but i think buyers is not more strong, price tested well 2h FVG and Fibonacci Strong sell zone after New York session open.
Price is into consolidation, and if we look higher timeframe Bitcoin losing buyers with my strategy here is my short position setup.
Open Short position at - 102500
Stop Loss at - 104500
Take profit - i will follow trend if i will be right.
Always manage your risk!!! don't risk more than 2.6% of your balance in this trade.

Re-entering the SOL Trade: A Strategic MoveYesterday, our SOL idea played out brilliantly, delivering a 65% profit in just 12 hours . While I didn’t hold out until the initial target, I want to be clear about my approach—I calculate not just price movements but the time frame as well. If I see rapid growth within a few hours that yields more than 50% of my deposit, I consider it a solid trade and decide to exit rather than risk overstaying.
By the evening, I closed the trade with satisfaction. However, this morning, the market brought SOL’s price right back to where it started. It’s almost as if the conditions for the trade reset themselves, presenting a renewed opportunity.
With this in mind, I’ve decided to re-enter the trade.
Trade Details
Duration:
This trade can evolve into either a short-term or long-term position based on individual goals. Alternatively, you could approach it as an investment in the SOL ecosystem, allowing you to average down costs if the trade doesn’t play out. Monitoring funding rates remains key to this strategy.
Target:
The goal is to achieve a 100% profit. The entry is made on Binance with 25x leverage, using a $37 margin and creating a total position size of $950.
Risk:
This trade is categorized as medium risk, particularly if you’re prepared to utilize dollar-cost averaging (DCA) to manage the position. This time, I’ve added an extra layer of caution by limiting potential losses to around 60% of the deposit.
Conclusion
Trading is a mix of timing, strategy, and calculated risk. SOL has proven its potential in a short timeframe, and with similar conditions presenting themselves today, I’m ready to take another shot. Let’s see how it unfolds!

$BTC.D prediction based on the current situation.CRYPTOCAP:BTC.D has been climbing steadily since the start of this bull run.
It’s often said that an altseason begins when BTC dominance drops below 55%. However, the 54% level appears to be a strong support zone, with the MACD showing a low point and the RSI entering oversold territory.
My analysis suggests that BTC dominance has established a range between 59% and 55%. It’s likely to bounce off the top resistance, pushing dominance back toward the support.
If the next drop breaks through this support, it could finally trigger a true altseason.

Bitcoin(BTC/USD) Daily Chart Analysis For Week of Nov 29, 2024Technical Analysis and Outlook:
Bitcoin has significantly declined below our Mean Support level of 94400. Nevertheless, the momentum of the bull market has been a pivotal factor, allowing Bitcoin to rebound robustly and heading to retest the established Outer Coin Rally target 99500. Current analysis indicates that the cryptocurrency is poised to surpass the 99500 threshold, consequently reigniting its upward trajectory towards the forthcoming Outer Coin Rally target at 110000. The pullback to Mean Support 95600 and possibly to 91800 is strategically positioning the market for the next phase of the bullish trend.

a lifetime logarithmic cycle in quartersthe quarterly chart in logarithmic price shows the cyclical arrangement of bull market breaks to new all time highs on the curve. the current bull market has the typical shape of each other breakout in the time cycles along a logarithmic pattern. shown are the logarithmic trend max and channel. this indicates a move inside the curve. during these periods btcusd tends to gain 80% over 3-6 months. im remaining buy sided btcusd for the foreseeable future targeting $124k by april 2025, stop loss as low as $59k.

Bitcoin(BTC/USD) Daily Chart Analysis For Week of Oct 18, 2024Technical Analysis and Outlook:
The Bitcoin ''Interim Rebound'' rammed through our Mean Res 66300 and Inner Coin Rally 67000 and rested at our Mean Res 68500 in this week's trading session, and it is currently poised to hit Inner Coin Rally 69300. A breach of this critical price level will catalyze a movement towards the all-time prices marked as Key Res 73200 and the completed Main Inner Coin Rally 73300. However, on the downside, the interim bearish sentiment may lead to a decline in the coin's price value to the Mean Support level of 66800 and possibly the Mean Support of 65300. Only then will the primary recovery and advancement into the subsequent phase of the bullish movement be realized.

Floki in 4h time frameFloki currency is in a strong ascending channel, but the 0.0031 resistance must be broken...

JASMY - Very Strong Hi, This is my new update for Jasmy. One of the strongest coins in this correction from mars is Jasmy, it has only fallen 40% and now it is only down 20% from the top on mars 4th.
Right now we are in descending triangle pattern and we are pressing to break the trendline. We have a major resistance around 0.025-0.027 and I expect once we break the trendline and the resistance, we are going to takeoff +140% to 0.050.
It is also normal if we visit the support level 0.015 again, but if we break the 0.015, things will get very ugly, but as long as we hold the 0.015, I expect the next stop for Jasmy is around 0.050.
Good news is that we are above the 50D and 100D moving averages. The RSI has broken the trendline and the MACD is ready to get bullish momentum.

EURUSD - 1.14300?
Hello
I want show you today my EURUSD analyse, in my opinion we will see price 1.14300 in next days.

BTCUSD Bitcoin Robbery PlanDear Crypto Looters,
My BTCUSD heist plan is started am looting Some coins.💰 My Target is placed at escape zone. If you were looting more and more money you will be bitten to death by ferocious animals. so get out of my escape target and i've put a tunnel in it so you can go and escape.
LOL

STGUSDT Breaking out and retesting STGUSDT breaking out of an triangle, resetting and looking for continuation.
Look to take profit at;
0.6856
0.7131
Caution, traders should watch for a volume spike and at least two closes beyond the trendline to confirm the break is valid and not a fake out.

COSUSDT 1H SETUP COSUSDT Analysis - Buying Opportunity
Overview:
Asset: COSUSDT
Current Price: 0.00643
Strategy: Buying Position
Technical Analysis:
Upon reviewing the current COSUSDT chart, a setup is evident, indicating a promising buying opportunity.
The overall trend appears favorable, with signals pointing towards potential growth.
Strengths:
Buy Zone: The current price presents an attractive buying opportunity with minimal risk, making it a favorable entry point.
Dip Strategy: If the price continues to decrease, consider accumulating more as it approaches the clearly defined green zone on the chart.
Transaction Goals:
Profit Target: Profit targets are clearly outlined on the chart in the zone where the transaction is expected to peak.
Stop Loss: A recommended stop-loss is advised to manage risks. Place it strategically to minimize losses in case of unforeseen market movements.
Conclusion:
This analysis suggests a buying opportunity with minimal risk. Loss management strategy and profit targets are clearly defined to guide you throughout the transaction.
Keep an eye on market developments and adjust your strategy accordingly.
Good luck with your transaction!

RUNE/USDT Analysis1. Overview:
The RUNE/USDT trading pair represents the exchange between THORChain (RUNE) and the US Dollar (USDT). Currently, there seems to be a potential buying opportunity based on technical analysis and possibly other factors.
2. Technical Analysis:
General Trend:
Identify short, medium, and long-term trends. Use indicators such as moving averages, Relative Strength Index (RSI), and Bollinger Bands to assess the overall market direction.
Potential Buying Zones:
Identify key support levels where the price has historically bounced. Use tools like Fibonacci retracements to determine potential buying zones.
Technical Indicators:
Examine indicators such as Moving Average Convergence Divergence (MACD) for detecting trend reversal or continuation signals.
3. Fundamental Analysis:
News and Events:
Examine recent news and events related to THORChain that could influence the price. Announcements of partnerships, development updates, and industry events can have a significant impact.
Project Fundamentals:
Evaluate the fundamentals of the THORChain project, including its value proposition, development team, adoption, and long-term prospects.
4. Risk Management:
Stop Loss and Take Profit:
Set stop-loss levels to limit losses in case of unfavorable movements. Also, identify take-profit levels based on resistances or predefined targets.
Risk/Reward Ratio:
Ensure that the risk/reward ratio is favorable before entering a position. This means that the potential for gain should outweigh the risk involved.
5. Conclusion:
In conclusion, based on technical and fundamental analysis, there appears to be an interesting buying opportunity on the RUNE/USDT pair. However, it is imperative to closely monitor market movements, implement appropriate risk management, and adjust the strategy based on market developments.

FILUSDT Analysis Update Dear traders and investors,
I would like to share an update on my recent analysis of FILUSDT, incorporating the Fibonacci method to reinforce my bullish view.
Technical Analysis:
Overall Trend: The overall trend of FILUSDT remains bullish, in line with my previous analysis. Signals continue to suggest potential upside in the upcoming sessions.
Key Fibonacci Levels: By applying Fibonacci retracements to recent price movements, we can identify key levels that confirm support at specific levels. These levels can serve as entry points or confirmation for trades.
Current Retracement: Currently, the price appears to be undergoing a retracement, possibly nearing a key Fibonacci level, indicating a potential reversal point.
Trading Volume: It's crucial to monitor trading volume during these price movements. Increasing volume during upward moves would strengthen the likelihood of a trend continuation.
Next Steps:
Confirmation of Levels: Wait for confirmation of the identified Fibonacci levels before making significant positions. Confirmation can come through reversal candles, signals from technical indicators, or a significant increase in volume.
Risk Management: Ensure proper risk management strategies are in place, setting stop-loss orders to protect your investment.
News Monitoring: Keep an eye on market events and potential announcements that could influence price movement.
Conclusion:
My optimistic view on FILUSDT persists, and the use of Fibonacci reinforces this perspective. However, the market is dynamic, and it's essential to adjust your approach based on new information. Stay vigilant, follow market developments, and adapt your strategy accordingly.
As always, it's recommended to consult multiple sources of information and, if possible, seek advice from a financial professional before making significant decisions.
Happy trading!

Bitcoin(BTC/USD) Daily Chart Analysis For Week of Jan 12, 2024Technical Analysis and Outlook:
Bitcoin has surged past January 2, 2024, completing the Inner Coin Rally 45900 and, as a result, also topping our designated Next #1 Outer Coin Rally 47500. In addition, Bitcoin has retraced back to our target Mean Sup 42800 after completing a pivotal squeeze, as shown in last week's chart analysis. Currently, it is regaining its lost ground by revisiting the newly-created Mean Res 47000 and extending beyond it.

When will PEOPLE fill this wickPEOPLE here, had that massive move that left a lot of liquidity in this wick. Price will go back to fill the wick and grab that liquidity. Only question is when?
Maybe something like this plays out in near term.
PLEASE LIKE AND FOLLOW FOR MORE!!
Thank you!

BTC/USDT (Mid-Term) UPDATEHi Traders.I hope you have good time.The chart you see is an update of the previous chart. The marked level from 44700 to 48400 is a strong area of supply and order blocK in the daily time. I expect a drop from this marked range. The CME gap created at 39600 can act like a magnet. This is just a personal analysis.

look btc for a sightHello guys
these days market moves crazy but lets check my analysis on the mothr coin(btc)
market would move more to the moon but its very close to start strong short waves down to green box.
now I think price will react on 29889 and goes for the higher prices then start falling to the green box.
now lets find good positions to trade some coins. have a great day

BTCUSDT: Path of moving for tradeHello Guys. According to the chart we see a pullback and continue to rally for reach 40000$ .

Elliott Wave Suggests Bitcoin (BTCUSD) Should Continue ImpulsiveRally from 11.21.2022 low is in progress as a 5 waves impulse Elliott Wave structure. Up from 11.21.2022 low, wave (1) ended at 25250 and pullback in wave (2) ended at 19578. The crypto-currency extends higher again in wave (3) towards 29380 with internal subdivision as another 5 waves in lesser degree. Up from wave (2), wave 1 ended at 26533 and dips in wave 2 ended at 23940. Bitcoin extends higher again in wave 3 towards 28567 and pullback in wave 4 ended at 26688. Final leg wave 5 ended at 29380 which also completed wave (3) in higher degree.
Bitcoin then pullback in wave (4) with internal subdivision as a zigzag structure. Down from wave (3), wave A ended at 27043 and rally in wave B ended at 28217. Final leg wave C ended at 26541 which completed wave (4). Wave (5) higher is currently ongoing with internal subdivision as a 5 waves impulse. Wave 1 of (5) is expected to end soon, then it should pullback in wave 2. Afterwards, it should extend higher again in wave 3, pullback in wave 4, and make final move wave 5 of (5). Near term, while dips stay above wave (4) at 26541, but more importantly above wave (2) at 19578, expect the crypto-currency to extend higher again.
