Bitcoin - bulls got liquidated. For break up we need additionalBitcoin - bulls got liquidated. For break up we need additional confirmation by volume
CRV

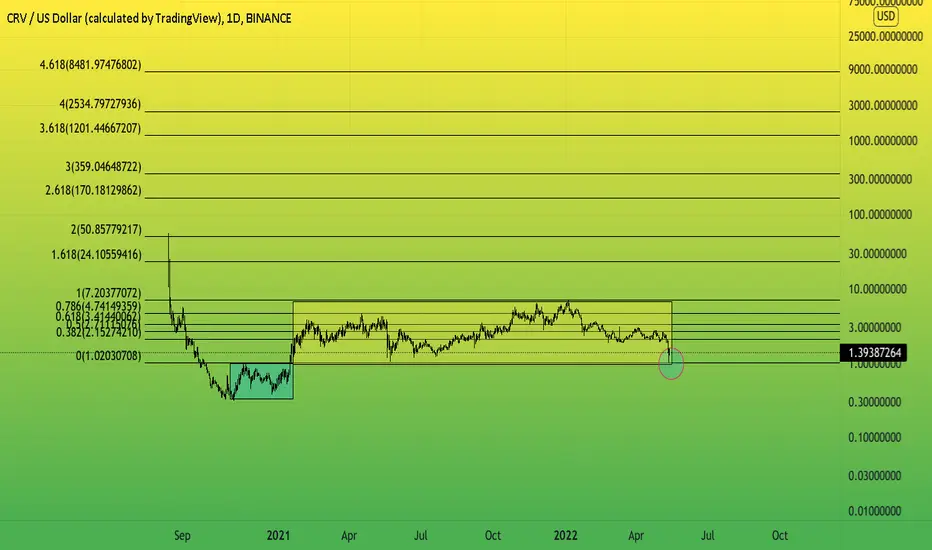
Best opportunity to buy CRVUSD in discounted priceHey crypto lovers!
How about owning some crypto at All time low price !
P.S. It is not a financial advice.
This is my own point of view you may or may not agree with this, but if you're agreed with my analysis then pleases hit like for appreciation and in latter case please let me know about your views on this analysis.
Remember! Your comments are precious addition to any idea and might help someone. It takes 2 2's to make a 4 :)
Thank you :)


CRVUSDT - SETUPCRVUSDT price has created a local support zone and consolidated around this area, but Somehow there are few resistance areas built around it. Bulls need to behave aggressively to create a strong surge towards the upside. Price has great potential for upside so accumulation can be done.

CRV- we opened long because a Massive volume entered the market.CRV- we opened long because a Massive volume entered the market. Here is our TP and SL

#CRV/USDT 1DAY UPDATE BY CRYPTOSANDERS !Welcome to this quick CRV/USDT analysis.
I have tried my best to bring the best possible outcome in this chart.
Reason of trade:- CRV/USDT PARALLEL CHANNEL brake the green and trendline and buy the CMP green zone. PARALLEL CHANNEL green zone. (SPOT CALL)
Entry:-$1.090,$1.305
Traget:- 100%
Stoploss:- $0.978
Remember:-This is not a piece of financial advice. All investment made by me is at my own risk and I am held responsible for my own profit and losses. So, do your own research before investing in this trade.
Sorry for my English it is not my native language.
Do hit the like button if you like it and share your charts in the comments section.
Thank you...

Curve DAO Token CRV Entry Range, Price Targets and Stop LossCRV/USDT
Entry Range: $1.29 - 1.45
Price Target 1: $1.83
Price Target 2: $2.10
Price Target 3: $2.30
Stop Loss: $1.08


$CRV vs $TSLAthe pattern of consolidation
the flush before the move
for me CRV is the tesla of finance
not financial advice
[CRV] just tested a previous area of SUPPORT, heads upA previous area of support from Sept '20 to Jan '21 is now being retested again ($1.08 top of support range)....yesterday's candle dropped down and damn near slammed against the that $1.08 top of the lower rectangle after it fell through the previous area of support between $186 and $2.10. I drew the new areas of possible support when the plunge began....let me know what you guys think. I must be on to something because whether bear or bull....there are ways to make money, and the better you can get at identifying areas of support and resistance, obviously the better trader/investor you will be for it. Happy trading guys and don't worry, this too shall pass. If you have money in something you know you have done your due diligence on and you believe in, and you can afford to leave it where it is....please be patient because more times than not....a legitimate project will recover and you will not have to take the tremendous loss that you may have been thinking you need to take....that fear they play on is a bitch, ain't it? Make money guys.....EVERYTHING MUST GO, AND YOU CAN'T BEAT THESE PRICES ANYWHERE.....

Curve DAO Token shortCurve DAO Token broke trough the ascending trendline. Asset broke trough the support level. Bearish movement to support level at 1.95 is possible.

CRV LONG SIGNALNice to meet you, everyone
I'm an alt trader
I'm analyzing and recommending things that are similar to my personality among many alt coins

Probable (in my opinion) Demand/Support level for CURVE????I have seen CRV test this area between $1.86 and $2.20 5 times fairly recently as you can see from my drawings on this daily chart. Looking for feedback from the trading community on what you guys think of my analysis, and whether I am on the right track with a lot of the analysis that I publish, most I don't, and I probably should because there are no losses unless you do not learn from them. Especially with something as diverse information wise as trading, investing, etc. Look forward to what everyone thinks of Curve and the De-Fi sector in general....happy trading guys and I hope EVERYONE OUT THERE IS MAKING MONEY. Lets break the system because you know none of them were built for that much success. The only ay to do that is to help each other get better at the finer points of technical and fundamental analysis. Take it easy everyone, this toooooo shall passs......I also think Curve and the De-Fi sector in general will get a bump coming into the end of the year, need money , holiday season, by the way....let me know ladies and gents, and be safe out there...
One more thing, lets see if we see some buyer exhaustion in the current candle with a "top" and reversal, if that happens, I could really be onto something....

CRVUSDT 4H TA: In the ChannelIt is located in a descending channel that after reaching the bottom of the channel, the price is advancing towards the midline and the ceiling of the channel. At present, if the channel roof is broken, it can have attractive prices in the bullish movement, and otherwise, we will have a fall by reacting on the channel roof.
Its not Buy or Sell SIGNAL
DYOR
BY : Mohamad Teriz - @AtonicShark

EW: Fourth wave's done? Buy or sell?On daily chart
From July to Jan, BINANCE:CRVUSDT has done three waves at 6.8
Right now, it's trading around 2.0
At ATH on July, there's not a golden ratio of impulse wave. I figured out a golden ratio at 13.
Besides, it's a invalidation level below 1.8
What next, wait and see

CRV ; it has formed Bullish structreCRV is one of the few currencies that, unlike other currencies, has formed a bullish structure in the last three days.
If the CRV can stay above the support around $2 level, and on the other hand can move break up the $ 2.3 level , we can hope that the buying pressure will increase and the price will rise to the upper resistance line of the long term channel.
Assuming btc will not make a huge dump i am expecting us to more gain on the CRV

CRV Bottom of channel long signalNice to meet you, everyone
I'm an alt trader
I am a South Korean soldier
I'm analyzing and recommending things that are similar to my personality among many alt coins
Thank you:)

Curve DAO Token longCurve DAO Token bounced off the lower boundary of descending channel. Bullish movement to resistance level at 2.57 is possible.

CRV USDT Make a boom! We definitely have the potential for a reaction around this area that we are in right now. I feel like the last demand zone will not get touched again.

🆓Curve DAO Token (CRV) May-01 #CRV $CRV
CRV is falling quite strongly to 1.9$ and 1.8$ with weak selling force, this shows that buying is waiting at this support zone. We can completely accumulate CRV in this zone and expect a rally back to $2.6 and $3 in the near future. However, if CRV loses this 1.8$ zone, the selling will increase strongly and it will fall strongly to the $1.6 and $1.4 zones.
📈RED PLAN
♻️Condition : If 1-Day closes ABOVE 1.8$ zone
🔴Buy : 1.9 - 1.8
🔴Sell : 2.2 - 2.6 - 3
📉BLUE PLAN
♻️Condition : If 1-Day closes BELOW 1.8$ zone
🔵Sell : 1.8
🔵Buy : 1.6 - 1.4
❓Details
📈Red Arrow : Main Direction as RED PLAN
📉Blue Arrow : Back-Up Direction as BLUE PLAN
🟩Green zone : Support zone as BUY section
🟥Red zone : Resistance zone as SELL section

CRVUSDT, Sell Trade ForecastHello my friends
Simple sell trade forecast
I am expecting downside Movement as per plan
GOOD luck

CRV Long Trade Setup - Strong Bullish Momentum Despite BTCHello Traders,
Here is my analysis / Trade Setup for CRV/USDT
CRV is one of my favorite cryptos to trade. When it is Bullish it often has strong momentum as well as predictable formations.
***Personally I probably won't enter this trade due to my conservative nature and wanting to keep cash free for other trades I have in mind and incase BTC tanks. But this is a good trade setup I wanted to share with all of you.
1) Wait for a pullback, get the confirmation bounce at $2.51 and enter a long.
2) Set stop loss around $2.38
3) Take Profits around $2.92
- You may notice that my take profit is lower than the local high, that is because I am a conservative trader. I would rather lock in profits a little early than try and squeeze out another 1% and risk price dropping early and not taking profits. In fact personally I would probably take profits even earlier just to be safe.
- However this is just a guide, you are the one who ultimately decides how you want to trade.
***Trading Wisdom***
- "The less you trade the more you make."
- I Know this sounds counterintuitive but let me explain.
- Lets say one trader take 10 trades a week. They win 6 lose 4. - 60% win rate
- VS. a trader who takes 5 trades a week but loses 1. - 80% win rate
- Strive for quality over quantity. If you can't be disciplined or patient you will lose out in this game of trading.
- Monitor the charts daily, be patient and wait for the chart to tell you when it is time to enter a trade.
- It is extremely hard to make money trading, I think somewhere around 90% of new traders lose their money.
- It is important to think like a pro, and a pro is patient, disciplined and never chases a trade, they wait for the trade to come to them.
***Last Note***
- For those who are curious... On average I probably take no more than 2 Trades a week. Could I take more and make money? Yes. But again I am looking for high probability trades. I only take a trade if I have and edge and have an 80% chance of the trade playing out how I expect.
- 2 trades a week is 100 trades a year. Average gain 10%, average loss 2%. Win rate 80%
- 80 wins X 10% = 800%
- 20 Losses X 2% = 40%
- Total 760% *This is not exact but close to my averages.
- This just goes to show how if you are patient and take your time you can make massive gains over time.
Happy Trading and Best of Luck!

CRV SAND SHIB ZRX cryptocurrencies - potential trades!Hello colleagues!
Looking at the situation in the cryptocurrency market , we saw a different attitude of altcoins to the local weakness of BTC.
We picked up bright examples and gave our assessment of how to trade cryptocurrency in the next few weeks.
The price of BTC has every chance to try to organize another wave of falling down. We talked about this in our previous BTC forecast, where we shared our trading plan ( click on the current forecast link )
According to our BTC forecast, we have forecast potential trades in cryptocurrencies CRV SHIB SAND ZRX
Cryptocurrency CRV
Entry: $2.26
Take Profit: $2.93
Stop Loss: $2,123
In the event of a weak rebound in the CRV price, we recommend closing the position at $ 2.48
Cryptocurrency SHIB
Entry: $0.00002255
Take Profit: $0.00002849
Stop Loss: $0.00002048
Cryptocurrency SAND (we expect a false break of the liquid zone of $ 2.66)
Entry: $2,262
Take Profit: $3.66
Stop Loss: $1,996
ZRX cryptocurrency
Entry: $0.7157
Take Profit: $1.0916
Stop Loss: $0.6448
How do you like this format of forecasts? What do you prefer a detailed and thorough description of one cryptocurrency or a selection of clear trades? Write your opinion in the comments!
