CRVUSDT Has closed above a major resistance
CRVUSDT has closed above a major resistance. After the price was rejected at 2.087, it has been making Higher highs and higher lows. The 2 large green candles show the buying pressure from the buyer and we can except that the price continues to go higher to 2.95
💎 CRVUSDT
🔵 Entry zone 2.639 - 2.497
🟢 TP1 2.95
🟢 TP2 3.45
🟢 TP3 4.20
🔴 SL 2.39
Good Luck 🎲
CRV

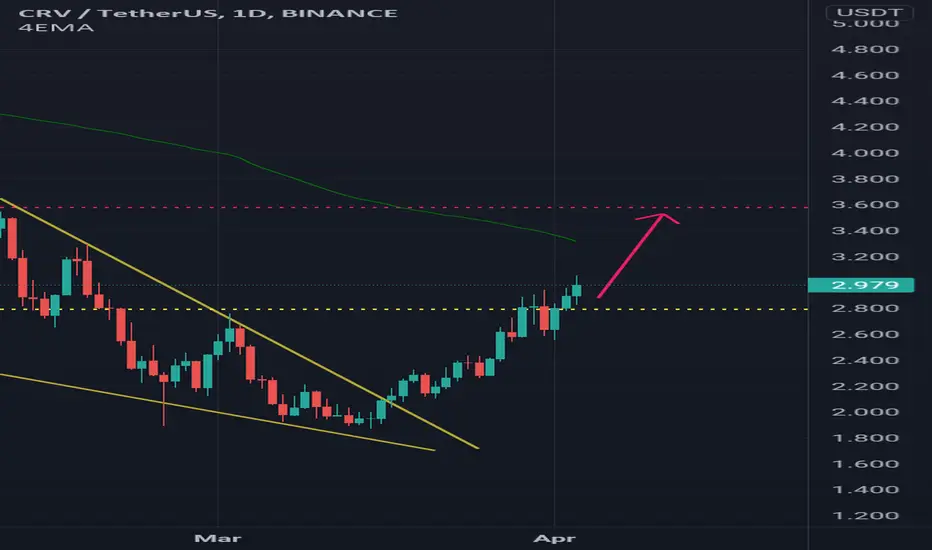
CRV further bullish move coming ahead ?CRV is testing both EMA 100 and resistence trend upper line and we expecting us to more pump.
So if the Price breaks up and cross above ema100 and resistence channel i think we can see a strong move upward to 3.6$ in the coming and if bulls fails to breaks ema100 we started a bearish move to down channel.
Happy trading

CRV GREAT MOVE SO FAR BUT WE HAVE A STONG RESISTANCE #CRV pumped great in the last 2 days, everyone is watching ascending triangle for a breakout entry but keep in mind we have the d-leg forming up @ $3.31 even after the ascending triangle breakout.
Let's see how far CRV can move from here.

$CRV BREAKOUT CONDITIONS EXISTconditions for a CRV breakout
volume decline to triangle peak
compression of price to top line
breakout to the upside is possible


CRV more downside expected before up $1Looking for $1 area before we can go up. The past year has been a long drawn out correction with no capitulation, waiting on capitulation before we can start an uptrend.

Curve | CRV at a potential reversal pointCRV currently trades below its MA50. Once it moves above $2.42 and closes above the MA50, I would like to enter and aim for at least $3.3, preferably higher.
What is interesting is that the volume hasn't been so low since last July. So, hopefully we can see some volume move into CRV and lift this off towards my targets.
If CRV cannot cross $2.42, I can see it dipping towards its white dashed support line.
Let's see how this plays out.
Thanks for your support.
Have a good one.

CRV is Bullish asfCurve coin is Pumping up!
Hold on to it for a while
-----------------------------------------
Trading above resistance
Positioned above EMA (55 and 21)
MACD depicting bullish momentum (convergence)
RSI 66
-----------------------------------------
Targets (long and short) provided in the chart
-----------------------------------------
Happy trading folks, make money, be rich!

CRV ; it ready to bullish move It is prepare to continue bullish move path in case of price could hold stay above support line (yellow) we are expecting it will continue to reach to $2.6 ~ $2.8
Happy trading🔥🌷
CRV Curve Dao looks good!CRV on daily and 4 hr chart is moving + direction as a few others seem to be slowly recovering ... RSI above 50 + moving up

Crv Long setup with 5 R/RHello dear friends...
here is a good Buy position with 5 R/R.
Curve finance is supported by 3D bear base, Ema 50 and Bullish Cup & Handle and Curve trend.
Let's see what is going to happen.

CRV 27 % Buy setuphello !!!
everything looks good.
risk to reward = 2.3
the stop is the previous low + ATR(14) and the reason is if BTC drops to 45 k , altcoins will drops a little bit too
.....
CRV weekly chart.
we got bullish hidden Divergence which one , pointed with arrows.
.....
not financial advice !
stay safe.
.....
let me know what do you think and share your ideas and charts
thank you.

CRV - 2 Months Long PlanI am planning to sell some of CRV investment at 6,52 USD at the end of April and on 2nd May (or at this week) around 8,00 USD. I believe this will be the last leg of the bull run in 2022. The pitchfork that was drawn is also parallel with Bitcoin Pitchfork.

CRVUSDT - SETUPCRVUSDT price has just given a strong push by the bulls and the interesting first started. If bulls retain this move they can easily develop a rally towards upside resistance.

crvThe CRV currency that we entered at the price of 2,108 one step is in a good position now, and if it can pass the resistance that it is currently dealing with, that is, the resistance of 2,326, and stabilize it above it, it will enter like another step. Monitor CRV.

CRV breakout longPrice in uptrend after hitting support floor, formed cup and handle pattern, handle respected 0.382 fib level, and broke flag w/ high volume candle closure above resistance on 1h chart

CRVUSDT-LONGBased on technical factors there is a long position in :
📊 CRVUSDT Curve DAO Token
🔵 Long Now 2.300
🧯 Stop loss 2.150
🏹 Target 1 2.440
🏹 Target 2 2.610
🏹 Target 3 2.860
💸Capital : 1%
We hope it is profitable for you ❤️
Please support our activity with your likes👍 and comments📝

CRV / USDTCRV had a break out now we can see the pullback then it will move up
The targets are shown in the chart just follow my chart.
Guys all my analyses are for the short term not long term, I'm a day trader .
Good luck

CRVUSDT - Falling Wedge PatternCRVUSDT (1D Chart) Technical analysis
CRVUSDT (4h Chart) Currently trading at $2.12
Buy level: Above $2.23 (Buy after Breakout)
Stop loss: Below $1.80
Target 1: $2.67
Target 2: $3.33
Target 3: $4.60
Target 4: $6.5
Max Leverage 2x / Spot Market
Always keep Stop loss
Follow Our Tradingview Account for More Technical Analysis Updates, | Like, Share and Comment Your thoughts


Long CRV NOW 🚀🔥CRV Long Entry : 2.1 - 2.2 $
short term : 2.32 - 2.40 $
mid term : 2.45 - 2.59 $
long term : 2.8 - 3 - 3.3 $
Enjoy !

CRVUSDT : There is a potential inverse cup & handle pattern !!In the 4h timeframe
If price break down 1(1.891) and stand firm the strategy as below
SL : 2.214
TP1 : 1.393
TP2 : 1.191
TP3 : 0.975
TP4 : 0.759
If you like this analysis, give it a like or share your thought or let me know what crypto TA you want to know.

$CRV Curve Long IdeaAll areas are labeled in the chart.
I like the 1:10 RR play on this one. I believe that BTC will bottom in the $36k area and this will play into that.
