CRV/USDT upward journey from key support? 🚀CRV Analysis💎 Paradisers, brace yourselves for an impactful movement with #CRVUSDT. It's approaching a key resistance, hinting at a bullish opportunity ahead. Maintaining momentum at the $0.5668 level and securing a green candle closure above this point could set the stage for a bullish ascent to tackle the upper supply zones.
💎 Conversely, if #CURVE's progression falters, dropping below the $0.5668 threshold, our focus will shift towards the fallback position at $0.5092. The rich liquidity at this juncture offers a prime opportunity for a bullish resurgence.
💎 Stay alert: a breach of this secondary line of defense could signal a sharper downward trend as the market sentiment swings towards selling. Vigilance and prompt responsiveness to these market changes are crucial for trading success as we navigate the #CRV market landscape.
CRV

CRV/USDT bullish trajectory what next? 👀 🚀 CRV Analysis💎 Paradisers, get ready for an exciting trading opportunity with #CRVUSDT, perfectly positioned at a vital support zone, hinting at an upcoming bullish turn.
💎 Exploring #CURVE journey, after a bump against a major resistance, it's now climbing from a key support level at $0.7162. Staying above this level could very well pave the way for a bullish surge. Keep your sights on the next goal, the resistance at $0.8793, with a breakthrough potentially pushing the price up to $1.1246.
💎 If the drive behind LSE:CRV starts to wane, anticipate a bullish resurgence from the firm support at $0.6368. However, a fall beneath this pivotal point might signal a shift into bearish territory.

CRV token starting it's Bull MarketIn my point of view Curve Dao token was in a Zig Zag correction from the beginning and finally it seems to coming to an end. More possibility to break this purple trend line(falling wedge/Ending diagonal) upwards and continue it's new bull market. Currently we are in a good buy zone. Minimum Bull Market targets are 4$-6$.
DYOR. Manage your risk and fund

#CRV#CRV
The price is moving in a descending channel and this channel has been strongly breached upwards.
We have higher stability to move at 100. And we have an uptrend on the index. RSI.
Entry PRICE. 0.5833.
First target 0.6192.
Second goal 0.6800
Third goal. 7477

CRVUSDTFrom my perspective there could be at least an upward movement until TP1
Please enter with your own confirmation

CRV/USDT in Perfect Position to Climb? 👀🚀CRV Analysis💎Paradisers, let's delve into the latest on #CRVUSDT, showcasing significant market activity with a recent breakout from its descending channel pattern.
💎Presently, #CurveDAOToken is making strides toward the descending resistance, originating from the demand zone. This sets the stage for a potential price rebound from this zone, eyeing an ascent with the bearish Order Block (OB) as its subsequent target.
💎If LSE:CRV does not manage to rally and instead descends below the demand zone, we might witness a fallback to the Bullish OB vicinity around the $0.5018 mark, where it could seek a renewed drive for an upswing.
💎The Bullish OB zone has historically been a catalyst for notable recoveries upon engagement. Yet, a compromise of this zone, signaling a shift to bearish trends, may necessitate a pursuit of bullish momentum from a diminished base.
💎In the event #CRV doesn't leverage the momentum from this or a further reduced level, a continued decline is likely. Rest assured, Paradisers, your ParadiseTeam is on standby, prepared to navigate you through these intricate market dynamics.

BINANCE:CRVUSDT - Perfect LONG doesn't exist ?---------------------------------------------------------------
Description
---------------------------------------------------------------
+ CRV broke-out the descending triangle and headed towards the next resistance
+ This is a good opportunity to enter the trade.
+ We can expect the price to reach upto 0.6469 easily
---------------------------------------------------------------
VectorAlgo Trade Details
------------------------------
Entry Price: 0.4820
Stop Loss: 0.4384
------------------------------
Targets 1:0.500
Targets 2: 0.5287
Targets 3: 0.5800
Targets 4:0.6400
------------------------------
Timeframe: 4H
Capital: 1-2% of trading capital
Leverage: 5-10x
---------------------------------------------------------------
Enhance, Trade, Grow
---------------------------------------------------------------
Agree or Disagree with the ideas ? lets discuss in the comments.
Like and follow us for more ideas.
Regards
VectorAlgo

CRV IS VERY BULLISHThis analysis is an update of the analysis that you can see at the bottom of this page, in the related analysis section
In the previous CRV analysis, we considered the scenario as a triangle, but now it seems that the correction has become more complicated and we have a diametric
We should now be in the middle of the F wave.
Note that if the red box (supply) is broken, the CRV may be heavily pumped
For risk management, please don't forget stop loss and capital management
When we reach the first target, save some profit and then change the stop to entry
Comment if you have any questions
Thank You


CRV is showing Clear Divergence +1100% Profit Potential---------------------------------------------------------------
Description
---------------------------------------------------------------
+ The analysis reveals a clear RSI bullish divergence, signaling an imminent reversal in price dynamics. This divergence pattern often precedes a significant uptrend, suggesting that a rebound is on the horizon. Investors keen on technical indicators would find this development particularly noteworthy, as it hints at a shift in market sentiment towards bullishness.
+ The prospect of a substantial profit of 1100% without the need for leverage underscores the attractiveness of the impending price recovery. Such a potential windfall without leveraging positions speaks volumes about the strength of the anticipated uptrend. It presents an opportunity for traders to capitalize on the market's natural movements without taking on additional risk through leverage, a strategy that aligns with conservative yet profitable trading approaches.
+ At present, the asset's price finds itself comfortably nestled within a supportive price zone. This zone, historically significant in providing a floor for price movements, serves as a solid foundation for the anticipated bounce-back. Market participants monitoring this zone with keen interest anticipate a swift turnaround, driven by both technical indicators and historical price behavior. This expectation adds weight to the likelihood of a bullish resurgence in the near future.
---------------------------------------------------------------
VectorAlgo Trade Details
------------------------------
Entry Price: 0.3973 - 0.4797
Stop Loss: 0.3696
------------------------------
Targets 1: 0.7353
Targets 2: 1.1190
Targets 3: 1.5840
Targets 4: 2.1276
Targets 5: 3.1282
Targets 6: 4.6582
Targets 7: 6.7875
------------------------------
Timeframe: 1W
Capital: 1-2% of trading capital
Leverage: 5-10x
---------------------------------------------------------------
Enhance, Trade, Grow
---------------------------------------------------------------
Agree or Disagree with the ideas ? lets discuss in the comments.
Like and follow us for more ideas.
Regards
VectorAlgo

BINANCE:CRV/USDT - Descending Triangle Breakout---------------------------------------------------------------
Description
---------------------------------------------------------------
+ A nice clean triangle formed for CRV and it's about to be broken
+ With the descending triangle we can expect the bearish trend to continue
+ CRV will continue to fall and i don't see any reversal happening anytime soon.
---------------------------------------------------------------
VectorAlgo Trade Details
------------------------------
Entry Price: 0.4398
Stop Loss: 0.4731
------------------------------
Targets 1: 0.4234
Targets 2: 0.4072
Targets 3:0.3829
Targets 4: 0.3516
------------------------------
Timeframe:
Capital: 1-2% of trading capital
Leverage: 5-10x
---------------------------------------------------------------
Note: Don't forget to keep the stop-loss.
---------------------------------------------------------------
Agree or Disagree with the ideas ? lets discuss in the comments.
Like and follow us for more ideas.
Regards
VectorAlgo

CRV - Shift In Momentum Soon!Hello TradingView Family / Fellow Traders. This is Richard, also known as theSignalyst.
📈 After breaking below the blue channel, CRV has been overall bearish , trading within the falling channel in red.
🏹 For the bulls to take over again, we need a break above the upper red trendline and 0.5 round number.
In this case, a movement till the previous major high at 0.7 would be expected.
📉 Meanwhile, until the bulls take over, CRV would be bearish and can still trade lower to test the lower bound of the red channel and 0.41.
In this case, we will be looking for short-term buy setups on lower timeframes.
📚 Always follow your trading plan regarding entry, risk management, and trade management.
Good luck!
All Strategies Are Good; If Managed Properly!
~Rich

CRVUSDT Pair : CRVUSDT
Description :
Completed " 12 " Impulsive Waves. Break of Structure with the Breakout and Retracement. Strong Divergence in RSI. Bearish Channel as an Corrective Pattern in Short Time Frame and Rejection from the Upper Trend Line

CRV ADAM AND EVEIn this chart, BINANCE:CRVUSDT is forming a cup and handle pattern from an intraday perspective. The pattern is suggesting a bullish move for the coin from its past downtrend movements. I'll provide more updates on this thread below. Happy trading!

CRV/USDT Key Support Hints at Bullish Potential?👀🚀CRV💎 Paradisers, observe closely as #CRVUSDT demonstrates a compelling pattern, anchoring at a pivotal support level and signaling a strong chance for a bullish trend.
💎 Historically,#CRV has adhered to a descending channel, consistently exhibiting a pattern of lower lows and lower highs. Currently, it's positioned at a crucial support level of $0.4808. Should the price sustain its momentum at this point, we're poised for a significant bullish surge.
💎 As prudent traders, we remain prepared for various outcomes. Should the price not follow through on the anticipated scenario, a bullish rebound from a lower support level at $0.3940 might be in play. However, dipping below this level could lead to a marked bearish downturn.

CRV is a precious diamond!It looks like we have a large triangle or diametric that wave C of this pattern is ending. Wave C looks like a triangle, only one wave (E) remains from this triangle.
The green area is the low-risk area for buying CRV.We marked the targets on the chart.
A close of 2 daily candles below the 0.2890 range will break the analysis
For risk management, please don't forget stop loss and capital management
When we reach the first target, save some profit and then change the stop to entry
Comment if you have any questions
Thank You

CRVUSDTAccording to the chart of this token, we notice higher ceilings and floors, but in the last ceiling, the price of a higher ceiling was recorded. In the floors, according to the white area in the image, we can see that the distance between the two floors is less than before, which indicates This is the price before moving up in a compression that we can enter the purchase transaction at the specified steps.

CRV: Channel UpTrade setup : Price is trading in a Channel Up pattern. Swing traders: can enter near Channel support trendline (~$0.60) and exit near Channel resistance trendline (~$0.75). Stop Loss (SL) at $0.50. Previously, price broke above 200-day moving average to confirm a bullish trend reversal to an Uptrend. Curve (CRV) is a well-established DEX used primarily for swapping of stablecoins.
Pattern : Price is trading in a Channel Up pattern. With emerging patterns, traders who believe the price is likely to remain within its channel can initiate trades when the price fluctuates within its channel trendlines. With complete patterns (i.e. a breakout) – initiate a trade when the price breaks through the channel’s trendlines, either on the upper or lower side. When this happens, the price can move rapidly in the direction of that breakout.
Trend : Uptrend across all time horizons (Short- Medium- and Long-Term).
Momentum is Bullish (MACD Line is above MACD Signal Line and RSI is above 55).
Support and Resistance : Nearest Support Zone is $0.55 (previous resistance), then $0.40. The nearest Resistance Zone is $0.75, then $0.90.

CRVUSDT 🟢🚀 Premium Crypto Signal Alert! 📈
🔔 Signal: BUY
Asset: CRVUSDT
Technical Analysis:
Moving Average Signal: The CRVUSDT pair has generated a strong buy signal as it closed above the 200-day moving average, indicating a robust bullish trend.
Support Level: The price has demonstrated remarkable strength by consistently staying above 0.60 for an extended period, establishing a solid support point.
📊 Trade Details:
Entry Point: Current market level
Target 1: 0.85
Target 2: 1.10
Target 3: 1.25
📈 Trade Analysis:
The 200-day moving average crossover signals a potential upward momentum.
Sustained trading above 0.60 showcases a substantial support level, enhancing the overall bullish outlook.
Targets of 0.85, 1.10, 1.25 present lucrative profit potential.
💡 Risk Management:
- Only use 10% of your capital for this trade to mitigate risks.
- Do not invest your full capital; it's important to diversify and manage risk exposure.
- Consider setting a stop-loss at an appropriate level to protect your investment.
- Regularly monitor the trade and adjust stop-loss levels as needed.
🔄 Additional Buy Zone:
- Be prepared to identify and utilize another buy zone if market conditions require it. Flexibility is key in adapting to changing trends.
📢 Spot Trading vs. Futures:
- Spot trading is a safer and more controlled approach, allowing for better risk management compared to the higher volatility and speculative nature of futures trading.
- Exercise caution and consider the potential risks associated with leveraged instruments.
🚨 Disclaimer:
Trading involves risks, and past performance does not guarantee future results. Exercise caution and conduct your research before making any financial decisions.

CRV: Channel UpTrade setup : Price is trading in a Channel Up pattern. Swing traders: can enter near Channel support trendline (~$0.60) and exit near Channel resistance trendline (~$0.75). Stop Loss (SL) at $0.50. Previously, price broke above 200-day moving average to confirm a bullish trend reversal to an Uptrend. Curve (CRV) is a well-established DEX used primarily for swapping of stablecoins.
Pattern : Price is trading in a Channel Up pattern. With emerging patterns, traders who believe the price is likely to remain within its channel can initiate trades when the price fluctuates within its channel trendlines. With complete patterns (i.e. a breakout) – initiate a trade when the price breaks through the channel’s trendlines, either on the upper or lower side. When this happens, the price can move rapidly in the direction of that breakout.
Trend : Uptrend across all time horizons (Short- Medium- and Long-Term).
Momentum is Mixed as MACD Line is below MACD Signal Line (Bearish) but RSI ~ 50 (Neutral). MACD Histogram bars are rising, which suggests that momentum could be nearing another upswing.
Support and Resistance : Nearest Support Zone is $0.55 (previous resistance), then $0.40. The nearest Resistance Zone is $0.75, then $0.90.

crvIt has a small position in the red box and until it is broken, the lower lines are available. If the red box is broken, the red lines are available.
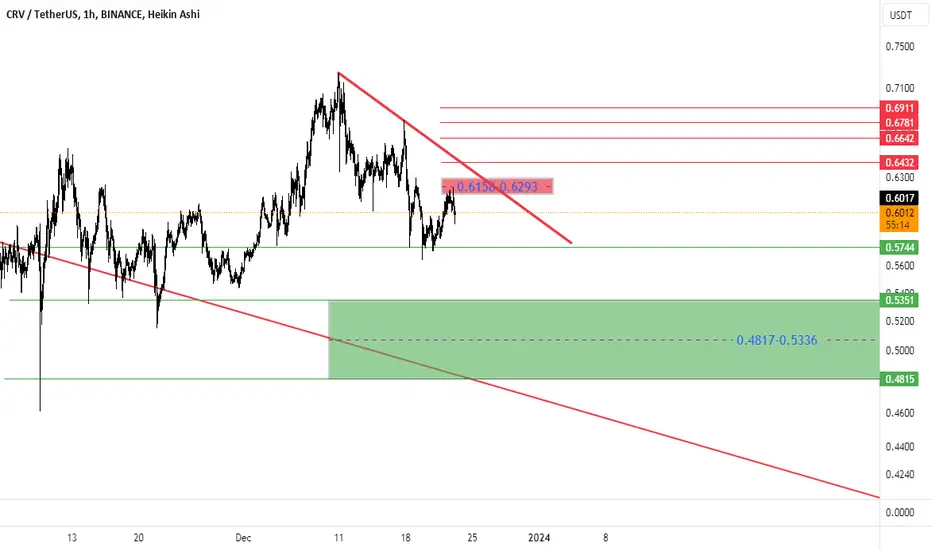
CRV/USDT Back to try breakout or break down the ascending ??💎 CRV has been a major point of focus in the market, recently facing a tough rejection upon reaching the supply area. Observing CRV's movement within an ascending or bullish channel, it's clear that a recovery is needed for CRV to attempt another breakout of the supply area. Successfully achieving this could probability CRV towards our target in the strong resistance area.
💎 However, if CRV trends downwards and reaches the support trendline of the ascending channel, a robust bounce from this level is crucial to maintain the bullish trend. Failure to sustain its position at the support trendline and a potential breakdown of the pattern would indicate a shift to a bearish stance, suggesting a readiness for a downward move towards the support area.
💎 At the support level, it's essential for CRV to demonstrate a strong rebound and attempt to re-enter the ascending channel pattern. If CRV only consolidates at the support over a few days without a significant bounce, it could signal a continued downward trend, leading to a break of the support and moving towards the demand area.

CRV#CRV HTF
If looking at W chart - the price high probably will come to one of the strongest resistance levels - 0.8083$
Which in my opinion will not be that easy to break from the 1st time. So some rejection we may see.
Any pull back till orange box zone is a good chance to buy the coin. Or look for another long positions.
Because I expect another bounce from there and this time the coin probably breaks through the resistance and towards to another strong level at 1.2$ (n.1)
Where bear reaction is possible. (n.2)
If #CRV manages to close with the W body candle above 1.2$ then most probably the zone between 1.2 and 1.39$ will be consolidation zone for another moves.
If the market by that time will be Positive, we may expect uptrend continuation towards to 1.87$ etc…
If the market turns out bearish, then the coin will dump back..
