CRV - BullishGiving you a look at the 5 day to show you how bullish is CRV. Making new highs and potentially closing outside the Bollinger bands on the 5-day. That implies continuation on the upside. This puppy is correcting after making recent all time highs which also means... ta da.... we soon be back in dat PRICE DISCOVERY. If you like De-Fi, you should own CRV. Not telling you what to do, just what I am thinking. Thx for listening! Happy Turkey Day! :-)
CRVUSD

CRV/USD long term overview.Here be have CRV/USD long term overview. RSI on monthly entered bull positive zone. Weekly RSI controlled by bullish sentiment. Overall positive trend of DeFi development puts CRV at the center of the stage. Most of coin supply is locked for long period of time. CRV is looking to have a major run and possibly return to previous ATH of $54, that represents over 900% in profit.
Let’s do this! Glta.

CRV (CURVE) reached targetCRV (curve) has moves based on my last analysis and it reached target. you can save profit.
check the link below to see the previous analysis.


CRV about to flip 🚀CRV looks in a perfect stop to flip that resistance area above.
Targets are mentioned in the chart.
initial resistance will be faced around 3.50-3.60 area which won't hold for a long time. Momentum is ready and this is a bullish accumulation pattern.
Invalidation price is below 2.42.
Enjoy!

CRV/USDT Curve looks extremely bullish after the test of previous resistance.
Simplified all crypto TA to supports and resistances to be able to capture the +3x returns for the following weeks

CRV/USD - Path to $10... very strong price action! 😎CRV has recovered all the losses from the most recent market correction and is set to push much higher, now sitting at over $5 at the time of this post.
This is a sign of strength and massive demand for this coin. As the market leader in Decentralized Finance for Stablecoins... CRV is set to dominate.
Indicators have turned bullish with DAILY MACD doing a bullish cross... volume exploded... bias is very bullish.
I expect a very beautiful rally from CRV in the future. A price around $10 is very likely and possibly even beyond that.
Like and follow if you liked my idea!


CRVUSDT Breakout and moves to TargetYet another example of an asset ready to move and helped by a little BTC push upwards. CRV was in a flagging pattern for awhile now and it was only a matter of time before it started to move towards the target. I think it still has a bit more juice in it before it starts to consolidate again before continuation. Once BTC gets going, its should head to the target without issue. This will likely create a small basing pattern and give us another smaller target. Thanks again everyone!

CRV - CURVE DAO LONG OPPORTUNITY 20211022 Structure BreakoutSig: Blue -> Green
Structure Breakout
DISCLAIMER
This is only a personal opinion and does NOT serve as investing NOR trading advice.
Please make your own decisions and be responsible for your own investing and trading Activities.

CRV: ONE BULLISH LOOKING CRYPTOCRV :
Big base/ kind of cup and handle style pattern.
Broke big resistance.
Came to retest the resistance which is now a suppor t.
Also currently sitting on 50 EMA.
Ready for bullish continuation if 3.75 holds.
Target Fibs and cup n handle around 6.87/6.90
Trade safe!

CRVUSDT Channel formation!CRVUSDT (Day Chart) Technical Analysis Update
CRV/USDT currently trading at $0.4.50
Buy level: Above $4.55
TP 1: $4.98
TP 2: $5.33
TP 3: $5.70
TP 4: $6.00
Stop loss: $3.97
Max Leverage: 2x
Always Keep stoploss

crv/usdt 4H prediction If breakout occurs And the bitcoin do not massacre market, crv has good money in it.

CRVUSDT - Can break out this time?BYBIT:CRVUSDT
4H trend chart
-
CRV is building a big descending wedge since 10/28
It tried to take out this wedge but failed yesterday.
Now it approaches the upper downtrend line again.
If price can break out this downtrend line, trading strategy as below.
-
Profit Targets:
a) 4.887~5.027----Fib(1.272~1.382)
b) 5.328----Fib(1.618)
c) 5.815----Fib(2)
Stop losses:
a) 4.031-----Red horizontal ray
-
If you like this analysis, smash the "like button" and leave a comment below to share your thoughts
or let me know what crypto you want to see!
Trading is a reflection of yourself. Learn more daily and be ready for every opportunity.
Have a nice trading!

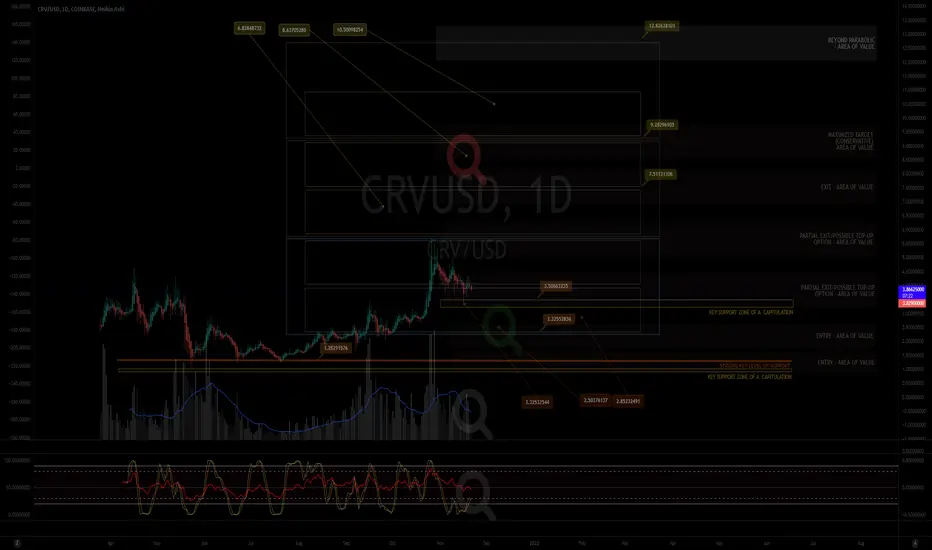
MY MINIMALIST CHART ANALYSIS FOR CURVE ALTCOIN$CRV
11.22.21
0751H +8 PACIFIC
ALERT: ADJUSTED CHART DUE TO BTC's CORRECTION
TOP-UP AREA OF VALUE HAS MOVED DOWN, THIS WILL BE A GOOD BUY FOR US
Disclaimer:
The findings of the following analysis are the sole opinions of the publisher of this idea and should not be taken as a piece of investment advice.
The Market has amazingly moved along the TOPS and BOTTOMS of our BOXES, signifying TURNING POINTS of PRICE ACTION.
JUST DYOR ENTRIES. Watch for Price action/ RSI and STOCH, VOLUME, and FIBS. Set your tight stop loss as any geopolitical, natural/man-made calamities will change the course for our TARGET AREAS OF VALUES.
REMINDER: "FOLLOW THE WHITE RABBIT!"
HOW TO USE THIS MINIMALIST CHART (You can CLICK AND hold THE CHART and PAN or DRAG IT.)
INDICATED ARE ENTRIES, PARTIAL EXITS/TOP-UPS, EXITS, and MAXIMIZED AREAS OF VALUE
Just Follow the TOPS and BOTTOMS of the BOXES as a GUIDE where the MARKET will take you.
Created on a MONTHLY, WEEKLY & DAILY Analysis (The Dynamics of the Market.)
It is designed for SWING TRADES at the BOTTOM. I do not SHORT, though, you can still use it.
TARGET ZONE IDENTIFICATION
The LARGE BOXES (Tops and Bottoms) are MAJOR pivot points that will occur sometime in the future. While the SMALL BOXES (Tops and Bottoms) are MINOR pivot points.
These can be entries to a BUY/ SELL POSITION, EXIT/PARTIAL EXIT/TOP-UP AREAS,
and, if you wish to hold longer for a MAXIMUM TARGET EXIT AREA OF VALUE - CONSERVATIVE (If price action conditions are right at that given moment.)
At times I include WAY BEYOND PARABOLIC Price TARGETS depending on The Character of the Market (CRYPTOS ONLY).
Watch out for your Volume, Chart Patterns, Candlestick Math, FIB COILS, Price Action, FIB LEVELS, Market Dynamics, especially institutional and retailer trading psychology.
Wishing you all The Best Trades and Thank you all for your Appreciation and Support of My Work.
Much thanks to My 3 Mentors. They are so much of a Blessing that I also wish to Share.
Vive Le Autist!
Vive Le Egalitarianism!
CURVE(CRV) RESULTCurve(crv) just moved based on my last analysis.
check the link below to see the previous analysis,

CRV/USD - Support retest successful! Back to $5? 😉CRV went back to the ascending trendline and is likely to consolidate just above it before we return on the uptrend.
We still need a bit more time, but the trend remains bullish on CRV. Plus fundamentals are looking great for this coin.
I expect CRV to move towards $10 eventually. ;)
Like and follow if you liked myidea!

CRVUSDT Update and TargetSo the consolidation of CRV got lengthened a bit by the recent pullback. However, that is not a bad thing. Structurally, CRV looks great! I expect it to move to about 8.0 for a major target. There are a few targets I expect after this but I am waiting for confirmation. Anyways, thanks again everyone!

Curve(crv) buy oppurtunityIt seems that this asset has reached a key support level, so this would be a nice situation to go long. However, What happens next is highly dependent on Bitcoin price action. So please check my bitcoin’s analysis.

CRVUSDT TOP1 DEFIYou guys hate money if not in the portfolio is CRV top1 DEFI , Buy zone 3.4 - 3.7 sell 7-10-12-15-20-25-30$ Buy it the cheap hold

#crv is so hotafter several day consadilation crv finally get ready to achive its target of triangle and double top
in 4h time frame we formed a falling wedge which is a bullish patern also btc is doing ok and we are almost on a strong support

CRV - I expect a new ATHA chart that I want to follow from here. I expect CRV to make a new all time high. From a fundamental perspective, its usage will expand. From a technical point of view, its accumulation since last February ended in October, and current uptrend will continue in my opinion.

CRV price prediction against bitcoinwe have this scenario. and we should wait for the breakout of one of the them.However,you can check compare the chart with CRV against USDT which I will add the link below.
