CRV/USDTCRV has a very good pattern and has a lot of growth potential both in the bitcoin market and in the dollar market pain.
Tp1:8$
TP2:11.6$
TP3:16.2$
MOON TP:40$
CRVUSD

CRV about to go parabolicThis is a comparison of CRV/USDT current chart to ETH/USD 2016-17 Chart. They are strikingly similar and CRV is closely following it.
90% of CRV's current circulating supply is locked for an average of 3.6 years making it a perfect candidate for a massive supply squeeze.
CRV wars are also heating up because of what MOCHI INU did a few days back.
It is currently turning it's previous all time high resistance into support and gearing up for the massive move that is about to come in the next few weeks. Once it flips $5.5 resistance it might go parabolic just like ETH did in 2016.
CRV all time high is $23 which is definitely achievable in long term because of it's low supply in the market.
This chart is only for information purposes and it is not an investment advice.

CRV reaching a support levelas we have been waiting for CRV is reaching a key support level.
this could be a nice to go long on this valuable asset.

CRV/USDT - Breaking resistance, 39% profit potentialI bought some CRV Token which is breaking resistance and has plenty of espace to rising.
Entry 4.90
Stop 3.80 (22%)
Target 6.87 (39%)
Use the STOP percentage as the main reference to decide the volume of your entry.

CRVUSDT : Can you get another ATH ?In the 4h chart
It hesitated and converged after touched 5.500 for a week.
The price is under downtrend now ,if it can break out and stand firm above the wedge ,trading strategy as below .
SL: 4.282
TP1: 5.500
TP2: 6.266
TP3: 6.576
TP4: 6.909
If you like this analysis, give it a like or share your thought or let me know what crypto TA you want to know.

🌈CRV- testing major support, get readyCRV just recently broke above the area of heavy resistance and is now testing it as a support. The price got rejected from 5.46 level, which actually can be treated as "more reliable" ATH because it is the only clear resistance we can identify, except for the one from the initial pump, when the coin was first listed. You can of course argue with this theory, it's just my approach. Following this assumption, this is the last level to claim. Please remember, that if BTC is going to resume its run (and it looks like it is) most altcoins will either dump or go into standby mode. In case current area doesn't hold, we can expect the price to find support at either 3.15(local level) or 2.68(macro support)
Entry: average buy from current price (4.40) down to key level (3.53)
Targets:
TP1: 5.44
TP2: 6.89
TP3: 10.50
TP4: 14.11
TP5: 16.35
TP6: 23.20 (~500%)
TP7: OPEN++
----------------------
About CRV:
Curve is a decentralized exchange for stablecoins that uses an automated market maker (AMM) to manage liquidity.
Launched in January 2020, Curve is now synonymous with the decentralized finance (DeFi) phenomenon, and has seen significant growth in the second half of 2020.
In August, Curve launched a decentralized autonomous organization (DAO), with CRV as its in-house token. The DAO uses Ethereum-based creation tool Aragon to connect multiple smart contracts used for users’ deposited liquidity. Issues such as governance, however, differ from Aragon in their weighting and other respects.
Source: coinmarketcap

CRV: Accumulation Before the Next Leg UpAfter a nice run up from sub $3 up to a local high of $5.70, we can see that CRV is now accumulating in the low $4 region. If this support zone holds, then I'd expect a nice leg up in the next few weeks.
If it dumps below the support zone, this idea is delayed.
This is not financial advice. These are just my ideas and opinions.

CRVOn the right, 4H chart:
- shows a demand area as price stayed above the support.
On the left, Daily/Weekly/Monthly chart:
- yellow for monthly.
- white for daily.
R+WR = the monthly resistance match with weekly resistance.
Notes:
- The pattern on daily frame which means need to have daily candle to close above.
- on the right there is a long opportunity because the price on the support and demand area.

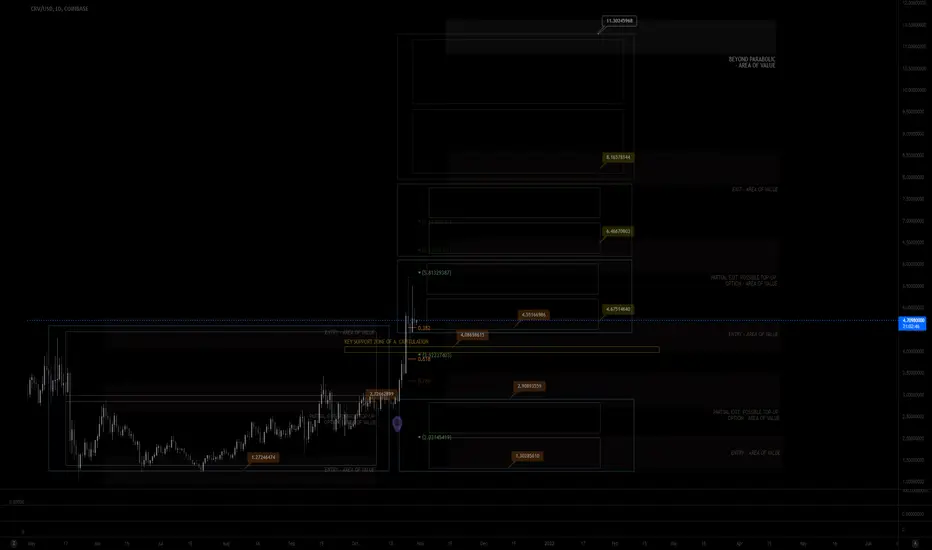
MY MINIMALIST ANALYSIS FOR CURVE $CRV
10.30.21
1050H +8 SINGAPORE
ADJUSTED CHART
ALERT: ENTRIES, PARTIAL EXITS, EXITS, and MAXIMIZED AREAS OF VALUE
INDICATORS INCLUDED
AN AREA OF OPPORTUNITY: 1ST SWING ACHIEVED
ZONE FOR AN ENTRY (COILING UP FOR A NEXT SWING.)
Since CURVE is new, I have very little data to fully understand the Market's Character. This affects accuracy.
I will research more on its FUNDAMENTALS for some confluence to my BIAS.
Wishing you all The Best Trades! Thanking you all for your Appreciation and Support of My Work.
Much thanks to My 3 Mentors!
SHOUT-OUT to All the Cryptoverse Analysts!
Vive Le Austist! Vive Le Retailers! Vive Le Revoluzion!
Disclaimer:
The findings of the following analysis are the sole opinions of the publisher of this idea and should not be taken as a piece of investment advice.
"FOLLOW THE WHITE RABBIT!"
HOW TO USE THIS MINIMALIST CHART
Created on a MONTHLY, WEEKLY & DAILY Analysis (The Dynamics of the Market.)
It is designed for SWING TRADES at the BOTTOM. I do not SHORT, though, you can still use it.
TARGET ZONES IDENTIFICATION
The LARGE BOXES (Tops and Bottoms) are MAJOR pivot points that will occur sometime in the future. While the SMALL BOXES (Tops and Bottoms) are MINOR pivot points.
These can be entries to a BUY/ SELL POSITION, EXIT/PARTIAL EXIT/TOP-UP AREAS
and if you wish to hold longer for a MAXIMUM TARGET EXIT AREA OF VALUE -CONSERVATIVE (If price action conditions are right.)
At times I include WAY BEYOND PARABOLIC Price TARGETS depending on The Character of the Market.
Watch out for your Volume, Chart Patterns, Candlestick Math, Price Action, Fibs, Market Dynamics, and especially trading psychology.
Note: This CHART is best used without indicators.
Master your Trading Discipline
and Trader's Psychology
CRVUSDT Ready to Start the MoveThis is another asset I have been talking about to my followers. I have been watching the consolidation closely and it looks like it is ready to start moving soon. This asset is great because it has an overall large target and a long year and some change basing pattern that has formed. I have put the first target on the chart but I expect this to really move when things get going. The target comes from the flagging pattern.
Thanks again everyone.
Tomorrow I will pick another asset I think will be great. Maybe KDA. I am still deciding. Cheers!

Curve DAO Token on the day
On the Week.. even though there is little data to be found in this chart, I am extracting an Ascending Triangle/W pattern from what is available. If the bulls price further up here, the target price will be towards $8.5 dollars.
On the day It is therefore important for the bulls to hold their ground above the red resistance line and thus show that we want to continue trading. If the Taurus doesn't hold it and there is reason to cool down then a drop towards $3.2 could lead to the creation of a Handle and a Cup n Handle formation to become visible. If we drop further and stay within 50%, I would still consider that valid.
Keep calm, trade safe and manage your risk.
(no Financial advise)

Curve DAO Token on the weekOn the Week.. even though there is little data to be found in this chart, I am extracting an Ascending Triangle/W pattern from what is available. If the bulls keep the price at this zone the bulls can go further up from here, the target price will be towards $8.5 dollars.
On the day:
It is therefore important for the bulls to hold their ground above the red resistance line and thus show that we want to continue trading. If the Taurus doesn't hold it and there is reason to cool down then a drop towards $3.2 could lead to the creation of a Handle and a Cup n Handle formation to become visible. If we drop further and stay within 50%, I would still consider that valid.
Keep calm, trade safe and manage your risk.
(no Financial advise)

💡Don't miss the great buy opportunity in CRVUSD @CurveFinanceTrading suggestion:
". There is a possibility of temporary retracement to the suggested support line (4.755).
. if so, traders can set orders based on Price Action and expect to reach short-term targets."
Technical analysis:
. CRVUSD is in a range bound, and the beginning of an uptrend is expected.
. The price is above the 21-Day WEMA, which acts as a dynamic support.
. The RSI is at 61.
Take Profits:
TP1= @ 5.245
TP2= @ 5.521
TP3= @ 5.877
TP4= @ 6.191
TP5= @ 7.197
SL= Break below S2
❤️ If you find this helpful and want more FREE forecasts in TradingView
. . . . . Please show your support back,
. . . . . . . . Hit the 👍 LIKE button,
. . . . . . . . . . Drop some feedback below in the comment!
❤️ Your support is very much 🙏 appreciated!❤️
💎 Want us to help you become a better Forex / Crypto trader?
Now, It's your turn!
Be sure to leave a comment; let us know how you see this opportunity and forecast.
Trade well, ❤️
ForecastCity English Support Team ❤️

💡Don't miss the great buy opportunity in CRVUSD @CurveFinanceTrading suggestion:
". There is a possibility of temporary retracement to the suggested support line (4.755).
. if so, traders can set orders based on Price Action and expect to reach short-term targets."
Technical analysis:
. CRVUSD is in a range bound, and the beginning of an uptrend is expected.
. The price is above the 21-Day WEMA, which acts as a dynamic support.
. The RSI is at 63.
Take Profits:
TP1= @ 5.245
TP2= @ 5.521
TP3= @ 5.877
TP4= @ 6.191
TP5= @ 7.197
SL= Break below S2
❤️ If you find this helpful and want more FREE forecasts in TradingView
. . . . . Please show your support back,
. . . . . . . . Hit the 👍 LIKE button,
. . . . . . . . . . Drop some feedback below in the comment!
❤️ Your support is very much 🙏 appreciated! ❤️
💎 Want us to help you become a better Forex / Crypto trader ?
Now, It's your turn !
Be sure to leave a comment; let us know how you see this opportunity and forecast.
Trade well, ❤️
ForecastCity English Support Team ❤️

CRVUSDT - Time to Buy?BYBIT:CRVUSDT
1H trend chart
-
CRV just broke out the triangle in 1H chart.
If price can keep standing here, trading strategy as below.
-
Profit Targets:
a) 5.500----Fib(1)
b) 5.899~6.060----Fib(1.272~1.382)
c) 6.407----Fib(1.618)
Stop losses:
a) 4.551-----Red horizontal ray
-
If you like this analysis, smash the "like button" and leave a comment below to share your thoughts
or let me know what crypto you want to see!
Trading is a reflection of yourself. Learn more daily and be ready for every opportunity.
Have a nice trading!


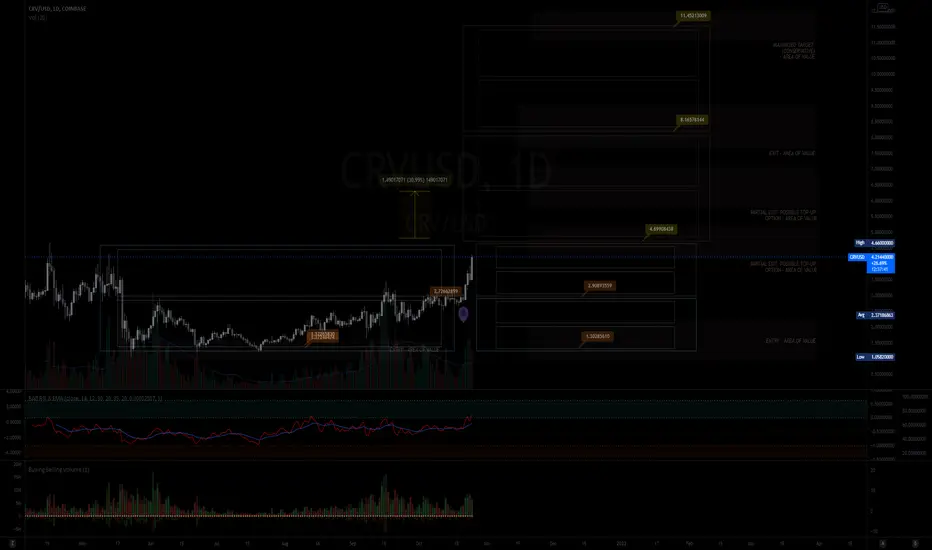
MY NOT SO MINIMALIST ANALYSIS FOR CURVE10.25.21
1917H +8 SINGAPORE
ALERT: Accumulating and gaining strength. We can see that it is nearing the TOP of a MAJOR and MINOR BOX, we can expect a correction/retracement at a 0.382/0.618 FIB level.
It can be another PARTIAL EXIT for shaving of profits and or TOP-UP for next PRICE TARGET.
I seldom research the fundamentals on a day today basis, this may help boost it further upwards. I will post when I do get the chance. More on watching price action.
Disclaimer:
The findings of the following analysis are the sole opinions of the publisher of this idea and should not be taken as a piece of investment advice.
"FOLLOW THE WHITE RABBIT!"
HOW TO USE THIS MINIMALIST CHART
Created on a MONTHLY, WEEKLY & DAILY Analysis (The Dynamics of the Market.)
It is designed for SWING TRADES at the BOTTOM. I do not SHORT, though, you can still use it.
The LARGE BOXES (Tops and Bottoms) are MAJOR pivot points that will occur, while the SMALL BOXES (Tops and Bottoms) are MINOR pivot points.
These can be entries to a BUY/ SELL POSITION, EXIT/PARTIAL EXIT/TOP-UP AREAS
and even if you wish to hold longer for a CONSERVATIVE MAXIMUM TARGET AREA OF VALUE (Depending on, if the conditions are right.)
At times I include WAY BEYOND PARABOLIC Price TARGETS.
Watch out for your Volume, Chart Patterns, Candlestick Math, Price Action, and especially your Fibs, Market Dynamics, and trading psychology.
The above-mentioned is sufficient enough as a major deciding factor for this MINIMALIST CHART.
Note: That This CHART is best used without indicators. (As we all know, they lag.)
$CRV looks good for a pump. $8+ After months of consolidation, Curve Dao looks primed for a pump. Once it gets over $2.86 and tests it as support, I think price will move quickly to $8.28, and potentially all the way up to $11.80.
I added key short term dates and longer term dates to watch for changes in price action. Let's see how this plays out over the coming weeks.

crv/usdtTesting/tracking elliot wave theory. Please do not trade off idea without S/L. Not financial advice.

CRV Hold #CRVUSDT Waiting for the Breakout
Follow our Tradingview Account for more Technical Analysis Update, | Like, Share and Comment your thoughts.

RESULTS, SHORT CRV. 15% profits made! in 24 hours I made an analysis yesterday on CRVUSDT, annoucing a massive drop of 15%. Well, is was a drop of 30%

CRV DAO Token This is the technical analysis that is being forecasted at this moment in time/space. Everything is setting up properly.

CRV/USD Everything is setting Up for the Moon ride 🚀🚀🚀
This will be a Fun and Exciting ride. Buckle Up Buttercup... 😁👆
