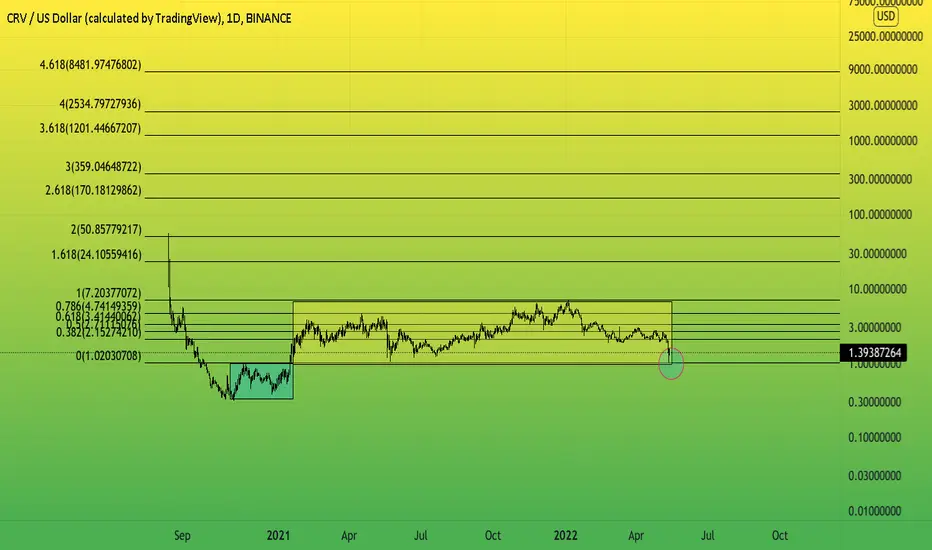
CRV Potential of a riseCRV broke down from a long-term rising channel and has reached the measured move of that channel at 1.18$.
The RSI has build some bullish divergences and is now testing the descending trendline.
The current price action is bound to descending channel. If the RSI breakout, price will potentially test the resistance of the channel at 2.11$.
Breakout of the descending channel has a measured move to 3.35$.
This assuming that the market turns bullish and BTC.d drops.
CRVUSD

CRV Buy AreaA leaked copy of US draft bill proposes to eliminate anonymous crypto projects.
DAOs, DeFi and exchanges will be required to legally register in the US!
My entry area for Curve DAO Token CRV is $0.65.
Looking forward to read your opinion about it.

CRVUSDIt's not an idea it's the truth, I dropped 200.00 into my exchange and set a limit order at 1.13, now ill just check till we hit it and it fills. if I miss it I miss it but it should hit 1.13soon maybe a month-long swing, I don't follow any news or no YouTuber, I'm 1- weeks ahead of them when it comes to trading based on how i chart. STOP LOSS STOP LOSS STOP LOSS

CRVUSDT - Head and Shoulders PatternCRVUSDT (4h Chart) Technical analysis
CRVUSDT (4h Chart) Currently trading at $1.34
Buy level: Above $1.324
Stop loss: Below $1.08
Target 1: $1.46
Target 2: $1.61
Target 3: $1.95
Target 4: $2.4
Max Leverage 2x
Always keep Stop loss
Follow Our Tradingview Account for More Technical Analysis Updates, | Like, Share and Comment Your thoughts

Best opportunity to buy CRVUSD in discounted priceHey crypto lovers!
How about owning some crypto at All time low price !
P.S. It is not a financial advice.
This is my own point of view you may or may not agree with this, but if you're agreed with my analysis then pleases hit like for appreciation and in latter case please let me know about your views on this analysis.
Remember! Your comments are precious addition to any idea and might help someone. It takes 2 2's to make a 4 :)
Thank you :)

#CRV/USDT 1DAY UPDATE BY CRYPTOSANDERS !Welcome to this quick CRV/USDT analysis.
I have tried my best to bring the best possible outcome in this chart.
Reason of trade:- CRV/USDT PARALLEL CHANNEL brake the green and trendline and buy the CMP green zone. PARALLEL CHANNEL green zone. (SPOT CALL)
Entry:-$1.090,$1.305
Traget:- 100%
Stoploss:- $0.978
Remember:-This is not a piece of financial advice. All investment made by me is at my own risk and I am held responsible for my own profit and losses. So, do your own research before investing in this trade.
Sorry for my English it is not my native language.
Do hit the like button if you like it and share your charts in the comments section.
Thank you...

Curve DAO Token CRV Entry Range, Price Targets and Stop LossCRV/USDT
Entry Range: $1.29 - 1.45
Price Target 1: $1.83
Price Target 2: $2.10
Price Target 3: $2.30
Stop Loss: $1.08

CRV: Daily RSI + Strong SupportEvery time CRV's daily RSI nears level 30, it is usually followed by a nice bounce up. We are also seeing bullish divergence, where the price action is making lower lows and the RSI is making slightly higher lows. In addition, CRV has tapped this strong support zone 4 times since May 2021.
I would not expect a full bullish continuation until that downward trend line is broken and tested as new support.

$CRV vs $TSLAthe pattern of consolidation
the flush before the move
for me CRV is the tesla of finance
not financial advice
[CRV] just tested a previous area of SUPPORT, heads upA previous area of support from Sept '20 to Jan '21 is now being retested again ($1.08 top of support range)....yesterday's candle dropped down and damn near slammed against the that $1.08 top of the lower rectangle after it fell through the previous area of support between $186 and $2.10. I drew the new areas of possible support when the plunge began....let me know what you guys think. I must be on to something because whether bear or bull....there are ways to make money, and the better you can get at identifying areas of support and resistance, obviously the better trader/investor you will be for it. Happy trading guys and don't worry, this too shall pass. If you have money in something you know you have done your due diligence on and you believe in, and you can afford to leave it where it is....please be patient because more times than not....a legitimate project will recover and you will not have to take the tremendous loss that you may have been thinking you need to take....that fear they play on is a bitch, ain't it? Make money guys.....EVERYTHING MUST GO, AND YOU CAN'T BEAT THESE PRICES ANYWHERE.....

$CRV to decline ~50% to low $1 regionFrom looking at the chart, you can see price just rejected the $2.65 resistance which now sets up the possibility for $CRV to fall 50% from these levels down to the $1.38-$1.69 region.
I've put key dates on the chart to watch for changes in price action.
Let's see what happens over the next month or two.

CRV - SHORTHey Guys, be quick. I think he break the support again and more downside exptected!
NO FINANCIAL ADVICE | DYOR | HAPPY TRADING

CRV LONG SIGNALNice to meet you, everyone
I'm an alt trader
I'm analyzing and recommending things that are similar to my personality among many alt coins


CRV Bottom of channel long signalNice to meet you, everyone
I'm an alt trader
I am a South Korean soldier
I'm analyzing and recommending things that are similar to my personality among many alt coins
Thank you:)

CRV : SCALPINGThis is my trading diary, if you follow it please set SL at ur acceptable risk
(For scalping method only not for investors/coin holders)

CRV - NEW PERSPECTIVE Hey Guys, CRV was a great great buy! This is my update to the last post, hope you like it and give me a follow :)
At the chart you see my entry and top up zone. BTC doing not so well and it`s likely that CRV come back to the entry / top up zone, so please be careful with new positions! BTC have to sattle down, to get a good position on CRV!
If you want more of these Charts with entry and tp zones, follow me :)
As always NO FINANCIAL ADVICE | DYOR | HAPPY TRADING

CRV - we made some moneyHey Guys, this is my update to the last post. Since the post we made good gains and if you check the chart, you see we break again strong resistance. We are on track!!!
NO FINANCIAL ADVICE | DYOR | HAPPY TRADING

CRV Recognizable Elliott Wave PatternRight now crv is displaying a 3 wave move to the upside, which may not be done just yet. It just missed the Most Likely Target for a wave 3, but is displaying some wave 3 personalities, vol, base channel break, slope. So keeping an eye on the retrace for more clues on what exactly is being printed here. Depending on where, and how, the PA retraces will determine the next possible move. In the end it is a recognizable pattern which could be utilized as an anchor for a possible trade plan.

$CRV BREAKOUT CONDITIONS EXISTconditions for a CRV breakout
volume decline to triangle peak
compression of price to top line
breakout to the upside is possible


WTF CRVGuys, in my last post about CRV () we made a little bit money. Today I shorted CRV and there was not time to post the long. It was so so fast. Unbelievable.
I think we will breakt today the next resistance! Be there!
NO FINANCIAL ADVICE | DYOR | Happy Trading

CRVCRV/BTC just got me feeling some kinda way here guys. We been buying $2 range like Michael Jackson buys skin bleach boys. Anyway send it please sirs.
