CurveCrv usdt daily analysis
Time frame 4 hours
Risk rewards ratio >1.3
Target 0.92$
Short position because of earthquake in the Russia
Crvusdt
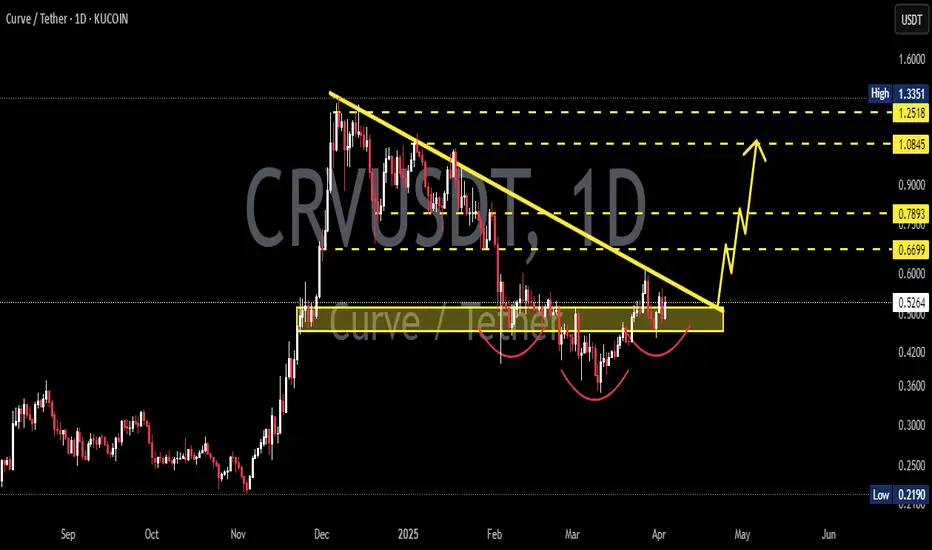
CRVUSDT Forming Bullish ReversalCRVUSDT is currently exhibiting a strong bullish reversal pattern on the daily chart, signaling the potential beginning of a new uptrend. After a prolonged downtrend, the price action has begun to stabilize and show signs of accumulation, with a noticeable uptick in volume accompanying the recent bullish candles. This confluence of technical factors suggests that buyers are beginning to step in with confidence, possibly positioning for a breakout that could yield significant returns.
The chart structure points to a clear bottoming pattern, which often precedes sustained upside movement. CRVUSDT has shown resilience by holding above key support zones and now appears to be reversing with higher lows and increased buying pressure. With overall market sentiment slowly improving, CRV is well-positioned to capitalize on a broader altcoin recovery. A confirmed breakout from this formation could realistically set the stage for a 50%–60% price increase in the coming weeks.
Volume is a key confirmation here—its steady growth reinforces the bullish thesis and indicates strong participation from investors. As more market participants recognize the reversal structure, CRVUSDT could quickly gain momentum. The coin is also historically known for volatile upside swings, and once trend confirmation occurs, it tends to rally with strength and speed. This makes it a compelling asset for swing traders and medium-term investors looking for asymmetric setups.
With growing interest and a strong technical base forming, CRVUSDT could soon enter a high-momentum phase. Keep an eye on breakout levels and monitor volume for continuation signals as this bullish reversal plays out.
✅ Show your support by hitting the like button and
✅ Leaving a comment below! (What is You opinion about this Coin)
Your feedback and engagement keep me inspired to share more insightful market analysis with you!

CVR – Ready to Run, Monthly Confirmation In
Tons of strength showing on $CVRUSDT—expecting continuation from here and even more once the trendline breaks.
The monthly candle is confirming the move, pointing to a potential 6-month uptrend. Looks like this one is finally ready for the run we’ve been waiting for.
Buying here and stacking more around 90c if given the chance.
First target: above $2.
BINANCE:ENAUSDT may have gotten away—but this one won’t.
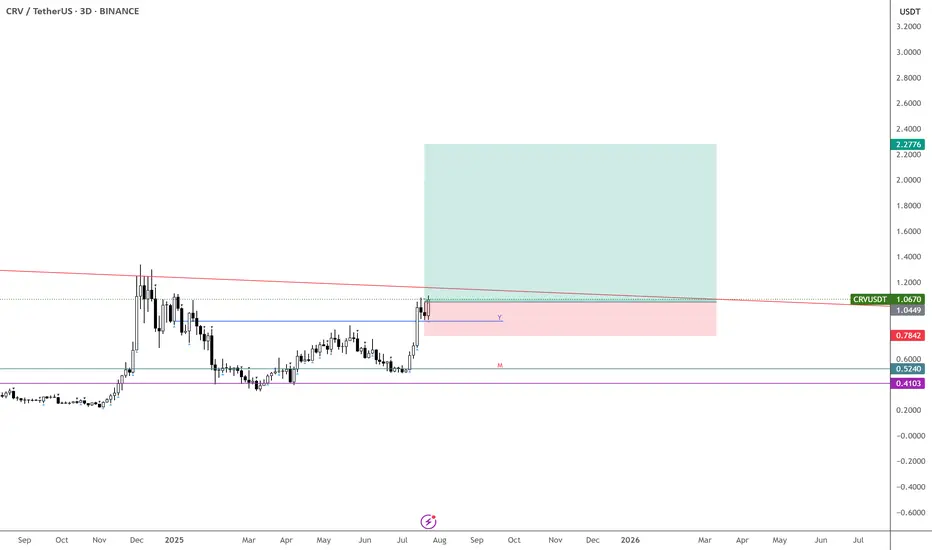
CRVUSDT 3D CURVE DAO TOKENDecided to update the idea. As always, key support and resistance levels are marked on the chart — along with price reactions at those zones.
Currently, we’re observing a potential breakout from a bull flag formation. The mid-term target lies in the $2.3 – $3.4 range, with a possible extension up to $4.8 as a maximum target.
⚠️ Don’t forget: there’s still a chance we get a retest of the bull flag — around the $0.64 level — before any major move to the upside. Manage your entries accordingly

CRV ANALYSIS🔮 #CRV Analysis 💰💰
🌟🚀 As we can see that #CRV is trading in a symmetrical triangle and given a perfect breakout. But there is an instant resistance. If #CRV breaks the resistance 1 then we will see a good bullish move in few days . 🚀🚀
🔖 Current Price: $0.7280
⏳ Target Price: $1.0800
#CRV #Cryptocurrency #DYOR

CRV ANALYSIS (1D)The smaller structure of CRV is bearish. It is expected to reject downward from the red zone, with our rebuy zone being the green area.
Given that the internal structure is bearish, it is ultimately expected to reach the green zone.
Closing a daily candle below the invalidation level will invalidate this analysis.
For risk management, please don't forget stop loss and capital management
When we reach the first target, save some profit and then change the stop to entry
Comment if you have any questions
Thank You
CRV/USD on Coinbase Daily Chart Shows Strong Turn UpCRV/USD on Coinbase. This is a daily chart. The grey MA is the 200. The green is the 314 MA.
Looking at a 3d chart it is easy to see CRV is making a turn around after long downtrend.
The Daily chart here show a move up after ranging roughly between the 200 and 314ma's.
I have an alert set for a cross about the 200ma on the daily chart. If all looks good on lower time frames (1 and 4 hour) will be a LONG for me.
This is a really nice setup that could run and run. No prediction of take profit area. Just go with it and wait for a turn around. Could also be like the previous spike.

Crypto Signal TodayHello friends🙌
Given the buyers' support for the price and their entry, you can buy in steps in the specified areas with capital and risk management and move to the specified targets📈
Follow us for more signals😉
*Trade safely with us*
Fiery support was revealed...Hello friends
According to our technical analysis and research on this currency, we were able to find important supports for you so that you can buy on those supports in stages and with capital management.
The targets are also specified...
*Trade safely with us*

CRV is Getting Ready For a Skyrocket Move (1D)CRV has formed a Cup & Handle pattern — a well-known structure that typically signals a bullish reversal.
From a broader technical perspective, there's additional confluence suggesting a potential trend shift.
If the most recent dip holds, it may confirm that CRV has completed its bearish cycle and has now entered a new five-wave bullish structure. Based on the current price action, it's likely that wave 3 is unfolding at the moment.
Interestingly, the depth of the Cup & Handle formation aligns well with typical wave 5 targets, offering additional validation for this setup.
In this scenario, the wave 3 target sits around $0.78, which also coincides with a previously untapped order block — adding further credibility to the level.
For a longer-term outlook, wave 5 could extend above the $1.00 mark, depending on market conditions and overall momentum.
Moreover, the Ichimoku Cloud is currently reflecting a bullish bias, with price action moving above the cloud and supportive Tenkan-Kijun alignment — reinforcing the overall bullish outlook.
Achieving this target may take time — but as we all know, in crypto, time often behaves differently.
— Thanks for reading.

Curve Enters Bullish Trend (TAC-S7)Curve started dropping in Jan. 2022. The chart doesn't look great at a first glance but there is some positive news.
The downtrend that started in Jan. 2022 ended in August 2024. This date marked the all-time low. After August, there was a higher low in November (2024) and then again a strong higher low in March 2025. That's the good news. The good news is that the market switched from lower lows to higher lows. So, what was then a downtrend can now turn into an uptrend, the next advance and higher high will make it so.
Long-term weekly time frame CRVUSDT is trading above EMA55 and EMA89. Boom. These levels were first conquered in late 2024 then the drop and recovery above this year signals that the bulls are now in control.
So everything is clear in a way, all that is missing is the next bullish wave. This is what we are expecting and this is what is certain to happen next.
As soon as Curve-Tether moves up, producing a high higher than December 2024, this will confirm the change of trend. The first time an uptrend shows on the chart since 2021.
Namaste.

CURVE DAO BREAKOUT - Short EntryLSE:CRV as seen on the 1hr timeframe chart broke downward from the box and has retested the zone. The drop should continue. Trade with caution.
Please support this idea with a LIKE👍 if you find it useful🥳
Happy Trading💰🥳🤗

CRV Head and Shoulders Pattern Formed – Breakout Confirmed🚨 CRV Head and Shoulders Pattern Formed – Breakout Confirmed 📉
CRV has formed a head and shoulders pattern and has already broken out of the neckline. This could signal the start of a potential downtrend, with further downside ahead. 📊
Let’s monitor this downtrend together! 💼💸

CRVUSDT Weekly Analysis – Major Trend Shift Unfolding!!Curve DAO Token (CRV):
Market Structure Overview
Uptrend Phase (2021 – mid-2022):
CRV was in a healthy bullish structure, printing consecutive Higher Highs (HH) and Higher Lows (HL). Momentum was strong and sentiment bullish.
Downtrend Phase (mid-2022 – end of 2024):
Price flipped structure and entered a long correction. We saw a series of Lower Highs (LH) and Lower Lows (LL) confirming the downtrend, following a firm rejection from the resistance zone (~$2.1).
Potential Reversal & New Uptrend (Post Dec 2024):
December 2024 marked a major structural shift. We printed a new Higher High and followed it with a Higher Low — a textbook uptrend confirmation.
Support Zone: $0.22 - $0.33
This area acted as a strong historical base — price respected this zone during accumulation and reversal attempts multiple times over the last 2 years.
Recent price action shows a bounce with volume, confirming demand interest.
Resistance Zone: $1.90 - $2.10
A heavy supply zone where price got rejected in past rallies.
A breakout and weekly close above this zone could signal the start of a strong continuation rally toward higher targets ($3.5+ range).
Break of Downtrend Line
The long-term diagonal resistance trendline has been broken decisively.
Price is consolidating above the trendline with structure favoring bulls — a strong signal of trend reversal.
Bullish Roadmap (if trend sustains)
The current rally could head toward $1.24 (mid-level key resistance).
If price holds and creates a Higher Low (HL), next upside extension could target the $2+ resistance zone.
Sustained break and hold above $2.10 will open room for a macro shift back toward bullish price discovery phases.
The macro chart of CRV is showing a clear transition from a multi-year downtrend into a potential uptrend. Confirmation through structure (HH & HL), breakout of long-term resistance, and a strong support base sets a solid technical foundation.
Keep CRV on your radar.
Patience is key. Let price confirm through weekly closes.
If you find this analysis helpful, please hit the like button to support my content! Share your thoughts in the comments, and feel free to request any specific chart analysis you’d like to see.
Happy Trading!!

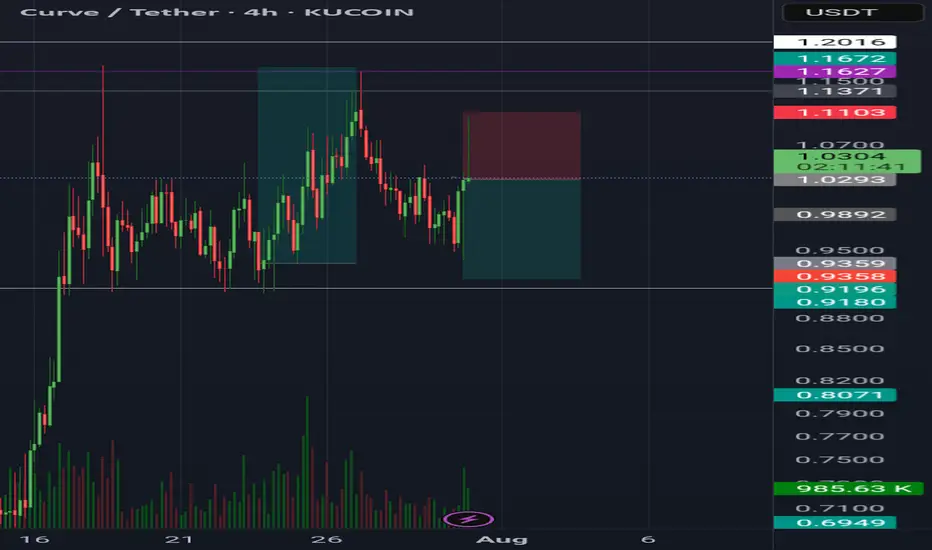
Is #CRV Ready for a Reversal or Not? Key Levels to Watch Yello Paradisers! Are we about to witness another brutal trap as #CRV finishes its final leg up and prepares to flush all late longs? Let’s break down the setup for #CurveDAOToken:
💎#CRVUSDT is currently trading around $0.6948, and what we’re seeing here is a classic Ending Diagonal Formation, a pattern well-known for luring in unsuspecting bulls before reversing violently. The structure has completed its five-wave sequence, and the price is now teetering just above key support.
💎The resistance zone near $0.7689 is where the whole game flips. This level has been clearly rejected before, and it now marks the invalidation point for any bearish outlook. A sustained move above this region with solid momentum would invalidate the diagonal and potentially send the price toward the $0.80+ mark. However, without that breakout, the bearish reversal remains the dominant scenario.
💎#CRVUSD is holding above rising trendline support, but this support is critical. A break below it confirms the end of the diagonal and should trigger a strong sell-off. The first target on a breakdown is the $0.5698 area, a zone previously respected and backed by significant volume profile interest.
💎If sellers gain traction and that level breaks down too, we’re watching for a move toward the demand zone at $0.4364, which aligns with the lower volume shelf—this is where the real pain could begin for over-leveraged traders caught on the wrong side.
Play it safe, respect the structure, and let the market come to you!
MyCryptoParadise
iFeel the success🌴
Curve (CRV)Crv usdt Daily analysis
Time frame 4hours
Risk rewards ratio >2.5 👈👌
Target = 0.8$
Moving up and down in the uptrend tunnel

#CRV/USDT#CRV
The price is moving within a descending channel on the 1-hour frame, adhering well to it, and is heading for a strong breakout and retest.
We are experiencing a rebound from the lower boundary of the descending channel, which is support at 0.6600.
We are experiencing a downtrend on the RSI indicator, which is about to break and retest, supporting the upward trend.
We are looking for stability above the 100 moving average.
Entry price: 0.6614
First target: 0.6840
Second target: 0.7120
Third target: 0.7420

CRV/USDT : BUY...Hello friends
Due to the good price growth, you can now buy in the specified areas in stages and with capital management and move to the specified goals.
*Trade safely with us*

Bullish Triangle Pattern on ProgressIn my previous update on BINANCE:CRVUSDT , I mentioned three potential scenarios: a bullish triangle formation, sideways movement, and a double top pattern.
Right now, it looks like the bullish triangle pattern is playing out. If this continues, I expect the price to reach the 0.7853 – 0.8343 target zone. But before that, all eyes are on the key resistance at 0.6667 — the prior high.
The best-case scenario would be a strong breakout above 0.6667, ideally with a solid bullish candle showing strong buyer momentum.
However, stay cautious. If price breaks the resistance but quickly falls back into the triangle and breaks the low of the breakout candle, that could be a false breakout (or what some might call a liquidation sweep). In that case, reducing exposure could be a wise move, as price might enter a sideways phase.
On the other hand, if price gets rejected (before breakout) at 0.6667 with a large red candle, that’s still acceptable — as long as price holds above the invalidation level at 0.5781.
Let’s keep watching how price reacts around key levels. Market structure still favors the bulls, but risk management is key.

CRVUSDTCRV ~ 1D Analysis
#CRV Buy after successfully penetrating this resistant line with a short -term target of at least 10%+.

CRV/USD "Curve Dao Token vs U.S Dollar" Crypto Market Heist Plan🌟Hi! Hola! Ola! Bonjour! Hallo! Marhaba!🌟
Dear Money Makers & Thieves, 🤑 💰🐱👤🐱🏍
Based on 🔥Thief Trading style technical and fundamental analysis🔥, here is our master plan to heist the XRP/USD "Ripple vs U.S Dollar" Crypto Market. Please adhere to the strategy I've outlined in the chart, which emphasizes long entry. Our aim is the high-risk Red Zone. Risky level, overbought market, consolidation, trend reversal, trap at the level where traders and bearish robbers are stronger. 🏆💸Book Profits, Be wealthy and safe trade.💪🏆🎉
Entry 📈 : "The heist is on! Wait for the MA breakout (0.4600) then make your move - Bullish profits await!"
however I advise to Place Buy stop orders above the Moving average (or) Place buy limit orders within a 15 or 30 minute timeframe most recent or swing, low or high level.
📌I strongly advise you to set an alert on your chart so you can see when the breakout entry occurs.
Stop Loss 🛑:
Thief SL placed at the recent / nearest low level Using the 3H timeframe (0.3800) swing trade basis.
SL is based on your risk of the trade, lot size and how many multiple orders you have to take.
🏴☠️Target 🎯: 0.5800 (or) Escape Before the Target
🧲Scalpers, take note 👀 : only scalp on the Long side. If you have a lot of money, you can go straight away; if not, you can join swing traders and carry out the robbery plan. Use trailing SL to safeguard your money 💰.
CRV/USD "Curve Dao Token vs U.S Dollar" Crypto Market Heist Plan is currently experiencing a bullishness,., driven by several key factors.
📰🗞️Get & Read the Fundamental, Macro Economics, On Chain analysis, Sentimental Outlook, Positioning and future trend...
Before start the heist plan read it.👉👉👉
📌Keep in mind that these factors can change rapidly, and it's essential to stay up-to-date with market developments and adjust your analysis accordingly.
⚠️Trading Alert : News Releases and Position Management 📰 🗞️ 🚫🚏
As a reminder, news releases can have a significant impact on market prices and volatility. To minimize potential losses and protect your running positions,
we recommend the following:
Avoid taking new trades during news releases
Use trailing stop-loss orders to protect your running positions and lock in profits
💖Supporting our robbery plan 💥Hit the Boost Button💥 will enable us to effortlessly make and steal money 💰💵. Boost the strength of our robbery team. Every day in this market make money with ease by using the Thief Trading Style.🏆💪🤝❤️🎉🚀
I'll see you soon with another heist plan, so stay tuned 🤑🐱👤🤗🤩

CRV/USDT: BUYHello dear friends
Due to the good price growth
Now we can buy in stages with capital and risk management and move towards the specified goals.
*Trade safely with us*

CRVUSDT 1DCRV ~ 1D Analysis
#CRV Buy after successfully penetrating this resistant line with a short -term target of at least 10%+.