CRVUSDT(CurveDAOToken) Daily tf Range Updated till 14-02-23CRVUSDT(CurveDAOToken) Daily timeframe range. bellow 0.490# is a price discovery level that comes with concern. but it held back right and retraced back 150%+ which is cool. if it had a little bit more volume could have break 1.284#. clearing that level opens up free space till 1.550#.
Crvusdt

CRVUSDTHello Dear friends
It seems that at the end of the downward trend of the daily time frame, due to the positive divergence of the RSI, the probability of completing a downward wedge pattern is high.
If the current rising trend is above the $0.81 range, we can expect the completion of the pattern and the formation of a rising trend, provided that the $0.378 area is maintained.
We would be happy to hear your comments

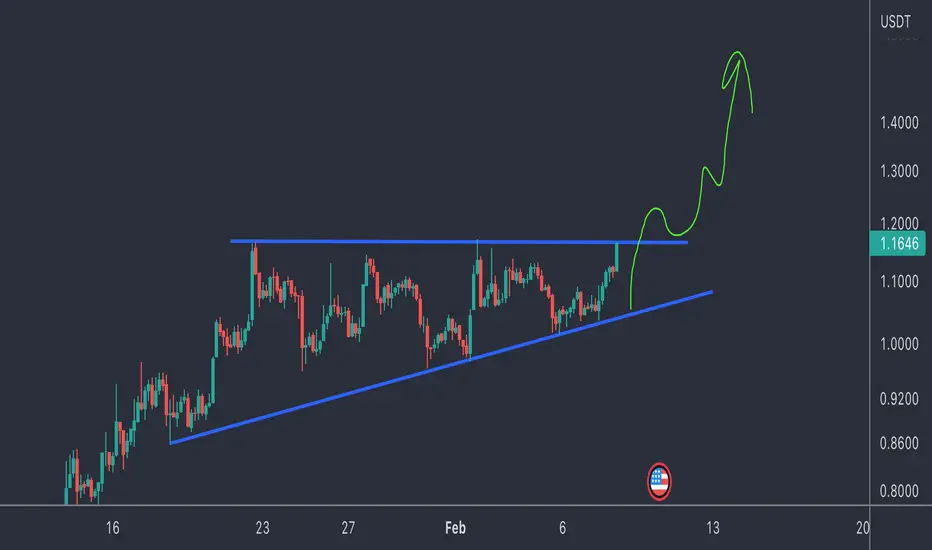
crvThe CRV currency is ready for a big jump
Targets $10, $30, and $50
It is a very interesting currency to hold

$CRV/USDT 12h (#BinanceFutures) Ascending triangle on supportCurve just pulled back to 50MA and seems to be preparing for another impulse leading to a bullish breakout.
⚡️⚡️ #CRV/USDT ⚡️⚡️
Exchanges: Binance Futures
Signal Type: Regular (Long)
Leverage: Isolated (2.0X)
Amount: 8.1% (Risk=3%)
Current Price:
1.054
Entry Targets:
1) 1.047
Take-Profit Targets:
1) 1.339
Stop Targets:
1) 0.852
Published By: @Zblaba
Risk/Reward= 1:1.5
Expected Profit= +55.8%
Possible Loss= -37.2%
$CRV #CRVUSDT #Curve #DAO #DeFi

crvusdt active stop huntcrvusdt active stop hunt
It can be seen that the hunt for stops is taking place in the strong support range and it is expected that strong buyers will enter the market and lead the price to the rectangular ceiling.

Curve DAO (CRV) formed bullish Gartley move for upto 17.50% pumpHi dear friends, hope you are well, and welcome to the new update on Curve DAO Token ( CRV ) with US Dollar pair.
Our last trade of CRV was as below:
Now on a 2-hr time frame, CRV has formed a bullish Gartley move for another price reversal move.
Note: Above idea is for educational purpose only. It is advised to diversify and strictly follow the stop loss, and don't get stuck with trade

CRV is stuck in a rangeCRV is stuck in a range for 20 days.
we have 2 options.
1- short trades in this range (short on top and long on bottom)
2- or wait for break in each side for long term

CRV (ascending triangle)CRV / USDT
In STF …price is showing perfect ascending triangle
And currently its testing resistance zone
If breakout done ✔️ bullish move will be followed as my drawing in the chart
$CRV - stucked in a rangeHello my Fellow TraderZ,
This is beautiful to see $CRV is ranging within a Range. If breaks above, it will blast to $1.42-1.55.
Currently, this is holding 200 Daily EMA which is quite good sign. If this comes down to the bottom of the range which also can be good area to LONG. But stay a bit #SAFU with tight SL if range breaks down.
CHEERS!!!

CRV shortSymmetrical triangle on CRV chart is broken down. Bearish movement to support level at 0.78 is expected to happen.

Curve DAO Token CRV price has a chance for another leap upToday we will take a look at the CRVUSDT trading pair.
Our attention was drawn to the fact that during yesterday's market decline, CRV buyers kept the price above the strong mirror level of $0.95-1. As you can see from the trading history of CRVUSDT, this zone has often played the role of critical support and resistance levels.
In general, the growth of the CRVUSD price in January 2023 was x2.
If buyers of Curve DAO token manage to keep the price above the liquidity zone of $0.90-1 in the coming days, there is a good prospect of another +50% growth to the range of $1.35-1.50
An additional fact that Curve Finance has prospects can be evidenced by the Top of protocols with assets placed and blocked in them (TVL) (at the time of writing this idea):
1. Lido Finance ~ $8.0 billion,
2. MakerDAO ~ $7.0 billion,
3. Curve ~ $4.75 billion.
4. AAVE ~ $4.5 billion
5. Convex Finance ~ $4 billion
6. Uniswap ~ $3.8 billion
7. JustLend ~ $3.6 billion
8. PancakeSwap ~ $2.5 billion
_____________________
Did you like our analysis? Leave a comment, like, and follow to get more

CRV : INCREASE TIMINGSeems interesting for a low time frame, as the coins seems to enter into a new increase.

CRV Investing ideaWe all know iphone is the top one in quality but what If in 2007 it wasnt a famous brand and all the advertising shit thing, then would it still conqueror the world?
No it wouldnt, because money doesnt flow in apple company.
the point is if something works perfect and quality is great doesnt mean it must have value!!
what makes something value? academic answer is :
usable value, rare value, aesthetic value, and emotional value
in crypto market the hype we saw was related to emotional phycology of humans (morons)
who makes that hype? and how?
what is mind and how it works?
what is the matrix?
anyway good luck😉

CRVUSDT|DECRYPTERS |PUMP INCOMING hi people welcome to team Decrypters
Bought CRV here on Breakout , Typical Crypto pump will come and hit the target price ;)

CRVUSDT Elliott Waves AnalysisHello friends.
Please support my work by clicking the LIKE button👍(If you liked). Also i will appreciate for ur activity. Thank you!
Everything on the chart.
Main buy zone: 0.45 - 0.3$
Targets: 0.6 - 0.8 - ~1$
after first target reached move ur stop to breakeven
Stop: (depending of ur risk). ALWAYS follow ur RM .
risk is justified
Good luck everyone!
Follow me on TRADINGView, if you don't want to miss my next analysis or signals.
It's not financial advice.
Dont Forget, always make your own research before to trade my ideas!
Open to any questions and suggestions.

viewpoint Short For CRVHi, dear traders. how are you ? Today we have a viewpoint to SELL/SHORT the CRV symbol.
For risk management, please don't forget stop loss and capital management
When we reach the first target, save some profit and then change the stop to entry
Comment if you have any questions
Thank You

CRV rejection levelsCRV trading plan for the short term
Price swept the lows, broke structure to the upside.
Expecting price to come back down to our level marked in yellow where I will open a long trade.
Planning on shorting on the levels above

CRV MIDTERM ANALYSISHi i hope you are fine .
For crv, we have a triangle pattern in the upper time frame, which is now in wave C. It looks like a 3D is being formed. From the green area, we can see the trend change.
Comment if you have any questions
Thank You

CRV Curve DAO Token Price PredictionIf you haven`t sold CRV here:
Then you should know that Grayscale expressed concerns over the potential impact on the Ethereum Merge, especially on tokens that run natively on Ethereum:
The Merge may lead to a fork that might have unexpected and unfavorable outcomes and a scenario where stablecoins and tokens locked in smart contracts might not be redeemable.
Token and stablecoin holders might panic and start liquidating their holdings.
In this context, price target for CRV Curve DAO Token is $0.62.
Looking forward to read your opinion about it.

CRV 4.12.22 The suitable short position for CRV is as I have indicated in the chart. There seems to be a small bullish opportunity for Bitcoin in the short term, and when that happens, the CRV will follow.
Should the CRV break its turquoise downtrend, it will be necessary to watch out for volume. Usually, when it breaks the trend, it makes a small rise for liquidity cleanup. Therefore, it is necessary to watch the hourly and 4-hour volume candles carefully when the CRV price hits the $0.84-$0.898 price zone. It should not be forgotten that closing the candles is important , not the candlestick.
What I write here serves as a note to myself. Does not include investment advice.

Trading opportunity for CRVUSDTBased on technical factors there is a Buy position in :
📊 CRVUSDT
🔵 Buy Now 0.651
🧯 Stop loss 0.570
🏹 Target 1 0.780
🏹 Target 2 0.930
🏹 Target 3 1.230
💸RISK : 1%
We hope it is profitable for you ❤️
Please support our activity with your likes👍 and comments📝

CRVUSDT 1D MA50 test of huge importance!*** ***
For this particular analysis on the Curve DAO token we are using the CRVUSDT symbol on the OKX exchange.
*** ***
The idea is on the 1D time-frame where CRV has been trading within a long-term Falling Wedge pattern. At the moment, it is rising following the (near) 1D MA50 (blue trend-line) rejection, looking like a Bull Flag , similar to that of July 08 - 12. On that fractal, this Flag was the last pull-back before the price posted a strong rally (green channel) and hit the dashed line (inner parallel of the Lower Highs trend-line since February 08 2022).
If hit, that will also break the 1D MA200 (orange trend-line), for the first time since February 10. A break above the Lower Highs trend-line, would put the coin back on long-term bullish track.
On the other hand though, a failure to break above the 1D MA50 will bring more resemblances to the June 01 sequence, which dropped even more aggressively to a new Low. As a result a new Lower Low on the current flag pattern will be a bearish signal for us, targeting the bottom of the Falling Wedge again.
It has to be said that the 1W RSI can give a clear long-term signal, depending on where it breaks or gets rejected on its Lower Highs trend-line.
-------------------------------------------------------------------------------
** Please LIKE 👍, SUBSCRIBE ✅, SHARE 🙌 and COMMENT ✍ if you enjoy this idea! Also share your ideas and charts in the comments section below! This is best way to keep it relevant, support me, keep the content here free and allow the idea to reach as many people as possible. **
-------------------------------------------------------------------------------
You may also TELL ME 🙋♀️🙋♂️ in the comments section which symbol you want me to analyze next and on which time-frame. The one with the most posts will be published tomorrow! 👏🎁
-------------------------------------------------------------------------------
💸💸💸💸💸💸
👇 👇 👇 👇 👇 👇

CRV - Maybe, maybe not!Hey Guys, I`m in a trade and maybe we will see a big leg up today... but we also waiting for CPI news today. Be careful.
NO FINANCIAL ADVICE | HAPPY TRADING | TAKE CARE OF YOUR MONEY
