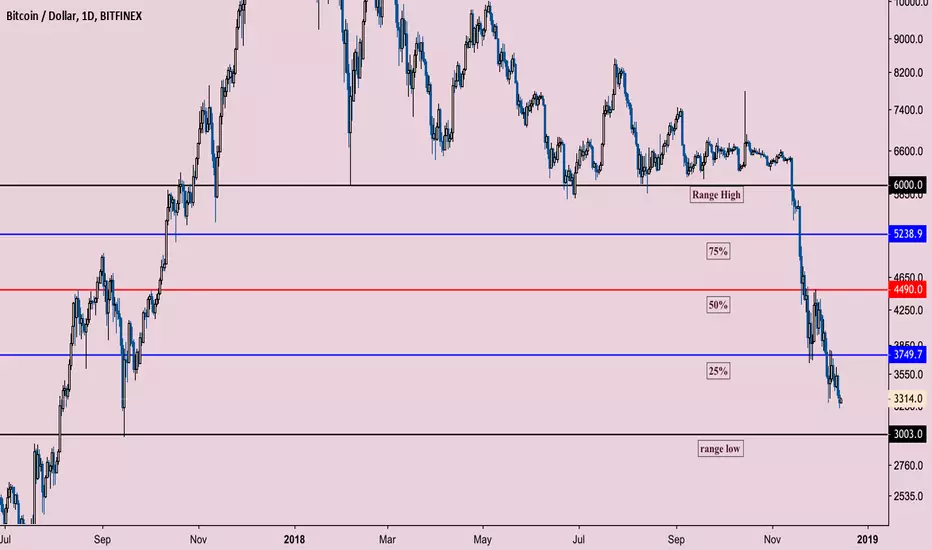
New playground for Bitcoin Mark these levels on your chart and what what price is doing around these levels on 4 hour chart.
6000
5238
4490
3749
3003
We will be playing with these levels for a good portion of 2019, better get them sorted in your charts.
Crypotrading
BTC/USD BitCoin (6 Dec 2018) *A potential rally is UP nextUpdated View On BTC/USD (6 Dec 2018)
First of all; BitCoin is one low liquid product. It can swing back for no reason So, be very careful.
Second: We are still in overall downtrend BUt the small rally/swing back is possible.
So, do you still want to trade? If yes, read on.
------------
Our Analysis
------------
EP Long anywhere before $3,400
SL $3,120
TP1 $4,400 (If the level is hit, take some profit and move ur SL to breakeven)
TP1 $4,800
TP3 $5,200
All the best and DYODD.
Disclaimer:
The information contained in this presentation is solely for educational purposes and does not constitute investment advice. We may or We may not take the trade.
The risk of trading in securities markets can be substantial. You should carefully consider if engaging in such activity is suitable to your own financial situation.
We, Sonicr Mastery dot com is not responsible for any liabilities arising from the result of your market involvement or individual trade activities.
You should be aware of all the risks associated with foreign exchange trading, and seek advice from an independent financial advisor if you have any doubts.

Next bear wave incoming til end november?No-trading zone for me, I will simply wait for a breakout, considering this could be solved sideways, downwards and upwards.
What I would wish for is a weekly candleclose tomorrow night above the historically important weekly EMA200 which is currently our strongest support.
If we close underneath by next week´s sunday close (capitulation in a big wick down to $2.9k possible), it will probably take a long long time to recover from that.
I am still learning Elliott so please don´t judge too hard if the waves ain´t fully correct...

XMR falling wedge reversaladded on break of trendline on kraken so different prices but was at $64.9 for 18 shares

Bitcoin: NAVBTCNAV creating a nice ascending triangle, break out imminent
Place the SL as these ascending triangles are hit and miss
Entry 590
Sell 790
Profit 25%
SL below 535

QTUM high likelihood bounce target Been riding this one long for few weeks now as weekly candles tightened into a rounding bottom.
Many higher time frames(monthly, weekly) signaling shaded rectangle as potential target for this BINANCE:QTUMBTC counter rally (SHOULD it be a fake alt-season... BINANCE:QTUMBTC will reject hard here and go on to make new All-Time lows).
Perfect world it comes on a weekly 9 (5.5 weeks from now) marked with flag on chart.
Will update more detail later


Possible Pattern FormationThe heavy rejection looks promising about price making a reversal soon. Don't have much to say except this is going to be a clean setup.
#XRP #CrypoTrading #PriceAction

XRPUSD Breakout IdeaPrice has been travelling well on long and it looks like XRP is pulling back, looking forward to a breakout out towards the major trend. Although we may experience a bit of draw down... This could be a potentially good short term setup.
#XRP # Crypos

ZRX Possible Coinbase listing.. NOT AN ANALYSIS, A PREDICTION..ZRX has been flirting with Coinbase for a few months now. This could happen and if so, I believe this is where we will stand.

BitCoin BTC/USD (Sep 2018) *Wait at Support levels to go LONGThis will be my views of BitCoin (25 Sept 2018)
Please make sure to read the "update" comment as there will be changes along the way.
Cheers.
S0nic
Disclaimer:
The information contained in this presentation is solely for educational purposes and does not constitute investment advice. We may or We may not take the trade.
The risk of trading in securities markets can be substantial. You should carefully consider if engaging in such activity is suitable to your own financial situation.
We, Sonicr Mastery dot com is not responsible for any liabilities arising from the result of your market involvement or individual trade activities.
You should be aware of all the risks associated with foreign exchange trading, and seek advice from an independent financial advisor if you have any doubts.

BITCOIN-Slightly Bullish Signs Comes From The Higher TimeframesHello followers and other TradingView users!
Over the weekend BTC stayed below the strong area (blue line) at $6,767. Eight attempts to break above but all were failed.
Since Sept. 6, BTC' trade between the $6,100-$6,500 and in 21. Sept. it made a breakout upwards. Currently, when we had several unsuccessful attempts to break the strong resistance level at $6,767 we got a very quick bounce downwards, this bounce touched almost the $6,500 area which is the perfect scenario if we want to see a bullish Bitcoin'. The perfect breakout trade = breakout + retest the breakout area and technically it ready to climb higher/lower depends on the breakout!
The bounce was supported with EMA's on the four-hour chart. It touches all the important EMA's (50, 100, 200) and after the bounce upwards it closed on the green, which gives us a bullish candlestick pattern called "Hammer.
To give a week overview and week direction then, there are several bullish signs on the higher timeframe:
* Weekly candle close was pretty bullish, its a "Hammer" or a sloppy "Hammer" candlestick pattern
* Daily is above the 50 EMA, it has a retest and bounce already!
* 4-hour, BTC' trade above the EMA's and 50 and 100 EMA made a golden cross (which is a bullish sign)
* Depends on the viewer but there is also a possible "Bull Flag" (orange area)
So, we might see a bullish Bitcoin' but currently, we have to take down that strong resistance level at $6,767!
To give to You also a bearish view then, if Bitcoin' breaks down below the "Bull Flag" (a candle close below the magic number $6666) and below the minor trendline (black line around this area) then the price might go lower than $6,500 then this could be a bad sign because then we are again in the consolidation area and we don’t know where it gonna break next, several times we have seen a break upwards (luckily) but the next one could be downwards. So, if we move down between the $6,000-$6,500 please be cautious!
Hopefully, this quick overview helps You out a little bit to confirm Your own analysis and levels!
Please, don't forget to LIKE!
Thank You for your support!
Have a nice week!
*This information is not a recommendation to buy or sell. It is to be used for educational purposes only!

BTCUSD breaks uptrend-reversalThis correction is expected after trying to break the resistance @7400, now both scenarios are valid, if the support @6800 stand firmly we may see a retrace back to @7100 and @7400 otherwise eyes will be towards @6800


History repeating itself? Schoolboard example if you ask me(ETH)Hello everyone
Just a thing that caught my eye today, no major update. Let’s get straight in to this!
So in April we saw a cup and handle pattern in the oversold part of the RSI, look what we’re creating in august! We are now at a very strong support level (275). We’re not going under that level if you ask me! If history repeats itself we could go up with 128%. That would mean to 607USD. That is exactly at a very strong resistance level.
ETHBTC
Also here just some bullish news, we’re now at a very strong support zone, I don’t expect ETH to go under that zone, if we do, our next target is at 0.023.
Just a small idea of ETH today,
made a big update on XRP today, go check it out!
Love to hear your opinion on this!
DM's and comments are always welcome.
Leave a like if you appreciated it!

ProShares Aug 23 | Weekly bull pinbar | Leaning bearishHello TView!
You better pay attention to August 23rd for the BTC Proshares ETF decision. This will either waterfall the BTC price to the downside if it gets rejected or give it a nice bullish boost if it's approved. Max target on approval $7000-7400. Target to the downside if denied is $5500. This price tightening is perfectly timed and don't think it's a coincidence it is planned by the big players.
My opinion is that it will the ETF may get rejected but I'll be happy if it gets approved :)
Hope you enjoyed my analysis, please share, give me a thumbs up or comment. Thank you!
Cheers!


Weekly Momentum On Major Pairs (Wk32)XXX/USD: Very Bearish
Gold & Silver: Very Bearish
XXX/JPY: Mixed
USD/XXX: Mixed
Indexes: Slight Bearish
BitCoin: Very Bearish
Week 32 (6 Aug 2018)

BitCoin (BTC/USD) Aug Analysis: A Major Selldown is Coming This will be my views of BitCOin BTC/USD Aug 2018.
Please make sure to read the "update" comment as there will be changes along the way.
You are welcome to "Like" and "Comment".
Cheers.
S0nic
Disclaimer:
The information contained in this presentation is solely for educational purposes and does not constitute investment advice. We may or We may not take the trade.
The risk of trading in securities markets can be substantial. You should carefully consider if engaging in such activity is suitable to your own financial situation.
We, Sonicr Mastery dot com is not responsible for any liabilities arising from the result of your market involvement or individual trade activities.

BTC/USD Midterm AnalysisIt's getting hot let's break out and get ready for the run... or get rekt again like last time


Bitcoin drawdown comparisons beginning till nowPart 1
Bitcoin from 2011 - 2013
Increase from $0.44 - $31.86
Total retrace down 95% (below 786 fib) to a price of $2.01
Correction length (all-time high to break old all-time high): 634 days
Part 2
Bitcoin from 2013 - 2017
Increase from $63.33 - $1181.69
Total retrace down 91% (below 786 fib) to a price of $169.58
Correction length (all-time high to break old all-time high): 1245 days
Part 3
Bitcoin from 2017 - 2018
Increase from $1838.54 - $19775.25
77% retrace complete thus far. Impulse incomplete. Waiting for 786 fib break
Correction length: TBD
BTC Update : Every few years we see a massive run-up in Bitcoin. After this we see a significant drawdown for months - years. Almost 95% retrace in pricing sometimes. Can we find a pattern this time around that may give us an idea of the length of the market drawdown and the severity in % and $ value. If we were to look at Part 1 and Part 2 we may be able to deduce a similar movement in Part 3. We first have to see if 786 fib breaks. If it does break we will have a prolonged bear market with further downside and move into the zone listed.

Long on Bitcoin to 1.618 Fibonacci level I am looking at the four hour charts and because of the movement and side ways movement over the last few days (between 6400-6800 approximatly), I believe bitcoin will test the 6300-6450 support band one more time. Observation should be made on lower time frames to get a precise entry point but I would like to make a buy order around 6460 as long as there is an indication the support level will hold.
Here is what I think
Entry: 6460 with candle stick formation
SL: 6250
Target: 7100
There may be some resistance around the 6700 level but I believe 7100 represents the 1.618 fibonnaci extension on the move. This fibonacci level corresponds to past support for bitcoin (7100-7200).
I will follow up with ideas as this develops
