DOTUSDT SELLPrice formed a double top on HTF
Price had an impulsive drop to the downside
Price forming a bearish flag pattern (continuation pattern)
Price has the potential to drop towards 10.40 (support level)
Crypotrading

$ETHUSD WEDGE REVERSAL$ETHUSD next Target PT 4,500-5,000 and higher
Potential Returns +28.40% and higher
WYCKOFF RE-ACCUMULATION WITH BREAK OUT
Fewer lower highs and lower lows
Breaking out of resistance with reverse pattern
SUPPORT AND RESISTANCE
WEDGE REVERSAL
SUPPORT LEVEL OF CONSOLIDATION
First resistance level of 4,000 was broken and bullish reversal was indicated
As a main target we can take next strong resistance to PT 4,500-5,000

AVAX/USDT starting to look bullish. Time to long? In the chart I am using the Supertrend Ninja indicator, which is a trend-following indicator.
When the background of the candlestick closes green with an upwards pointing pink arrow. It indicates a possible bullish (up)trend. I want to see more confirmation of this possible trend before making an entry. To enter a trade placing an order a few ticks above the candle high would be sensible. The idea behind this, is that we only want to enter a trade when it has shown a trend continuation.
The Supertrend Ninja indicator gave only 6 bullish signals for the 2 day chart in 2021. And it's forming its 7th today. It still has over more than 1 day and 7 hours before candle close.
Is AVAX gonna be making a new ATH? I'll be watching AVAX like a hawk.
Namasté
Disclaimer: Ideas are for entertainment purposes only. Not financial advice. Your own due diligence is highly advised before entering trades.
Past performance is no guarantee of future returns.

my btc vision
This is my BTC vision...
for the mid and schort term
trade safe DCA always in the dip!..

#BTC IDEA #BTCUSD #bitcoin #crypto Following up from yesterdays analysis we can see that btc is slowly working its way back up to the retest level of the breakout at 54k. There may be a pullback along the way but looking good so far.
After the big sell off price consolidated 2 days. Yesterday we could see some bullish candles forming + some kind of a double bottom pattern which led me to think that we would break the consolidation to the upside.
All eyes on bitcoin

BTCUSD: BUYThis is an update of the last post of BTCUSD. The last drop that was anticipated has happened and the buys have been trigged. The SL is minimal at this point depending on your size. Good luck


BLOK-USDT trade setupIt broke the bearish trendline and also SuperTrend gave the buy signal. I saw this a bit late but I think still this is a good price to take a small bag. if it pullback to the support, I will add more to my bag.

Bitcoin Scalpers all on DECK!Great consolidation for the past 2 days, scalpers looking for a nice move wait for a break-out candle and attack!
Swing traders refer to our other analysis.

Cardano(#ADA) Sellers are losing Power
1. Looking at 4H timeframe, ADAUSDT have formed a nice bearish flag which may not dip lower from the last swing low.
2. Viewing from 1D timeframe you can clearly see that buyers are beginning to dominate the market but it seems the big player are waiting to see price hit the lower bounds of our channel before they come to pump the price to a new
swing high.
3. Potential target would be a touch of upper bound of our channel
4a. I may buy and and hold now
4b. I may also buy again when price dips to complete the bearish flag setup spotted on 4H (history have shown that this setup more often than not gets completed) + 1D time frame shows that price need to kiss the trendline for buyers to
completely take over
5. I will add stop loss way below my potential new swing low.
6. Please comment let know know what you think.
PPPDirhams.
Disclaimer: This is just my idea not a financial advice. Am not in any way responsible for the end results if adapted by anyone. Trade cautiously as there are chances that you will lose your investment..
UPBIT:ADAUSDT

UMAUSD Looks Promising!Apply Caution.
PPPDirhams.
Disclaimer: This is just my idea. Am not liable for the end results if adapted by anyone. Trade cautiously as there are chances that you will lose your investment..

DOTUSDT - Entry Timing?BYBIT:DOTUSDT
1H trend chart
-
DOT has built a double bottom pattern.
Now it just broke the neckline in 1H chart.
If price can be keeping here w/o wicks top, trading strategy as below.
-
Profit Targets:
a) 46.035----Fib(1)
b) 46.7~47.415----Fib(1.272~1.382)
c) 60.445----Fib(2
Stop losses:
a) 41.050-----Red horizontal ray
-
If you like this analysis, smash the "like button" and leave a comment below to share your thoughts
or let me know what crypto you want to see!
Trading is a reflection of yourself. Learn more daily and be ready for every opportunity.
Have a nice trading!

SUSHIUSDT is getting Ready to rain PIPs |WeeklyPPPDirhams.
Disclaimer: This is just my idea. Am not liable for the end results if adapted by anyone. Trade cautiously as there are chances that you will lose your investment..
BINANCE:SUSHIUSDT


Ethereum in a Falling wedge.Ethereum - Intraday - We look to Buy at 3731 (stop at 3648)
Price action has formed a bullish ending wedge formation.
Daily signals are bullish.
50 4hour EMA is at 3730.
We look for a temporary move lower.
The bias is to break to the upside.
Our profit targets will be 3963 and 4022
Resistance: 3900 / 3980 / 4025
Support: 3780 / 3720 / 3640

⚡️ Crypto Insights ⚡️ #1What people tend to miss is the bigger picture.....
Let us look at the overall trend in the crypto space, which yesterday broke to ATHs. It is looking extremely strong with an uptrend on the weekly chart and a convergent MACD. For me this shows real strength, not just in BTC but in the whole crypto space.
It is a common misconception that ATH are a bad place to be getting into a market... yes it is a time to be cautious but it also shows incredible confidence and strength!

MATIC / Polygon is HOT! ☀️Watch this spring!!! 🏹 Range contraction leads to range expansion and this coin is winding up for a big move!
With Polygon's daily users surpassing Ethereum, we are seeing real adoption... and it's not slowing down. You only need to look at their Medium page to see the plethora of partnerships rolling in.
With BTC's break to all time highs, this projects technical and fundamental stature are setting up for some insane gains.

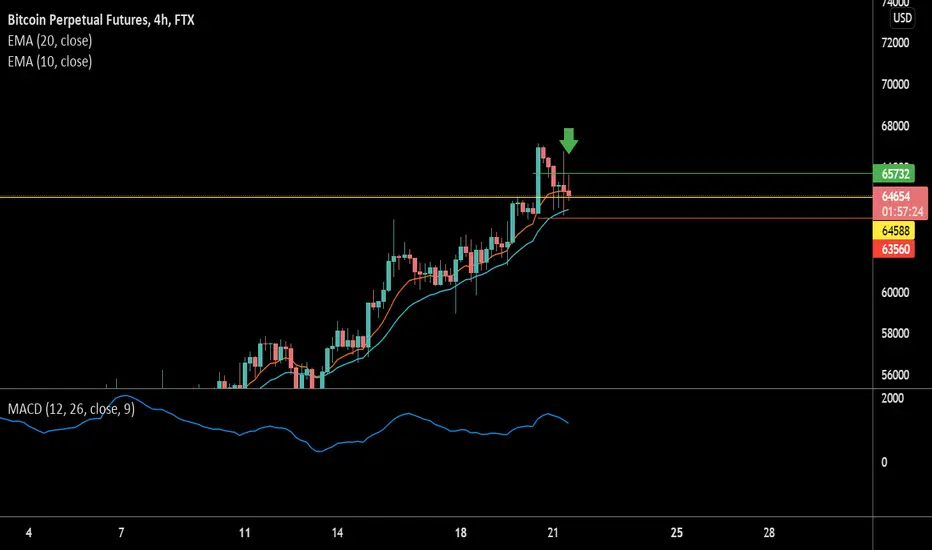
Potential Entry Into Bitcoin! 🍹If this candle closes green, I will be looking to enter into BTC when the price strikes my green line with a stop loss on the red....
Manage your risk 😉
COMPUSDTBreaking out of Falling Wedge Pattern and Establishing targets towards 400 initially followed by 450. However any closing above 450 would open 500 - 530 as next upside.
On downside 300 acting as strong support.

SAND - Breakout up ...or down (I know, super insightful right?)Sand either printing a head and shoulders, potential to dip hard. Also printing a parallel triangle. Waiting for confirmation to break either support or resistance. Crypto gamings are hot, so we can be optimistic.

BTC Next move! Check it outA few things seem to be playing out:
-BTC is coming up to a some resistances ( diagonal TL + Price range)
-Its last 45% move up was followed by a pullback
- Bearish divergence is playing out like last time
A high probability tells us that we are close to seeing a small pull back -
I think we can see $58.5k (blue box) before retracing about -10%
What are your thoughts?

BTC|USDT THOUGHT 🌽Hey hey my friends👋
Looking for bitcoin to do something before doing many more altcoins
BTC seems to be ranging here in-between these orange lines forming a falling wedge inside
Price action is really choppy ATM so it is hard to tell what is going to happen

XLMUSD Retrace to .315 and then .28. All in @ .28I suspect XLM will drop with BTC coming off to the .28 level which should be at or around the 50DMA. At that time the bullish run will resume in a pretty furious pace.
