Bitcoin Hits $40,000, It Will Recover —Name Your AltcoinSorry, there is a typo there on the title, I meant to say: Bitcoin hits $114,000, soon to recover.
As you can see from our trading range, Bitcoin just went beyond the lower boundary and hit a new low, the lowest since 10-July but there is good news. There isn't room for prices to move much lower, this is part of the consolidation phase.
The first low happened 25-July and notice the high (bear) volume. The second low happens today and we have lower volume compared to 25-July, but Bitcoin hit a lower low. This reveals that the bearish move is already weak and losing force. It also reveals the fact that Bitcoin is about to recover.
Also notice the RSI, 2H. It hit oversold recently and went the lowest in a long while. Reversals tend to happen when the RSI becomes oversold.
Bitcoin is testing the lower boundary of the trading range, when this happens, the action reverses and moves back up. Prepare to see Bitcoin back above $120,000. It is normal and it will happen... But it is wise to give the market a few days. 5-August was bad last year. It gets bad but it also marks the bottom. Once the bottom is hit, growth long-term.
— Name Your Altcoin
Leave a comment with the altcoins you are holding now and I will do an analysis for you. The altcoins will also recover and we are witnessing just a small retrace. Hold strong as this is the most important part. We will have a very strong new bullish wave develop within days.
As Bitcoin moves to test support, it will reverse to test resistance next. Which one is your top altcoins choice?
Thank you for reading.
Namaste.
Crypto

Solana Update · Retrace, Bears & The Bullish BiasSolana had a retrace in May. Notice the 19-May date on the chart. This retrace produced four weeks red. The bullish move that led to this retrace lasted 6 weeks. The last rise lasted five weeks and the current retrace might last only two weeks, can be less.
We are seeing Solana rising but this rise is not a one-time off event, this is a trend that is developing. An uptrend as a long-term phenomena is different to a short-term bullish moves. A short-term move tends to be really fast, one strong burst and that's it. A long-term move is different. Instead of seeing 2-3 candles and Solana trading at $1,000, we see dozens and dozens of candles with prices slowly rising. There are strong fluctuations but the end result is always up. And that's how you see the fluctuations on the chart.
Solana moved up and then immediately started to retrace. Then another rise and another retrace again. This retrace will end and prices will continue to grow long-term. The bulls are in. The bull market is on. Solana, Bitcoin, Crypto and the rest of the Altcoins market is going up.
Namaste.

ChainLink · Short-Term Correction (Retrace) · 2025 Bull MarketWe have evidence that ChainLink won't be moving much lower. There are mainly two reasons: 1) There aren't that many sellers and 2) we have strong support. We have an active support range between $14.5 and $15.95. This is the reversal point. Either current prices or this lower range which shows an intersection between two strong moving averages as well as Fib. retracement levels.
The rise between June and July has a stronger slope compared to the one before. The April-May rise was more spread out and so the correction lasts longer. The present one has a stronger slope, it is more steep, and thus a retrace will have a shorter duration because prices will continue growing.
Volume is extremely low on the drop and bearish momentum is not present. There can be one final flush reaching the levels mentioned above or lower on a wick and the market turns. The flush would make everything seen pretty bad and red but the truth is that this would be the end. When the major sell is in, the market turns around and moves the other way.
LINKUSDT is retracing within a bullish bias mid-term. Long-term growth is possible based on the bigger picture.
LINKUSDT is facing an intersection of multiple support zones, if these levels hold, we can see a resumption of the bullish move and prices grow. Each time a retrace is over, the bullish wave that follows will be many times stronger than the previous one until the bull market ends.
We are still looking at bottom prices. The best is yet to come.
Namaste.

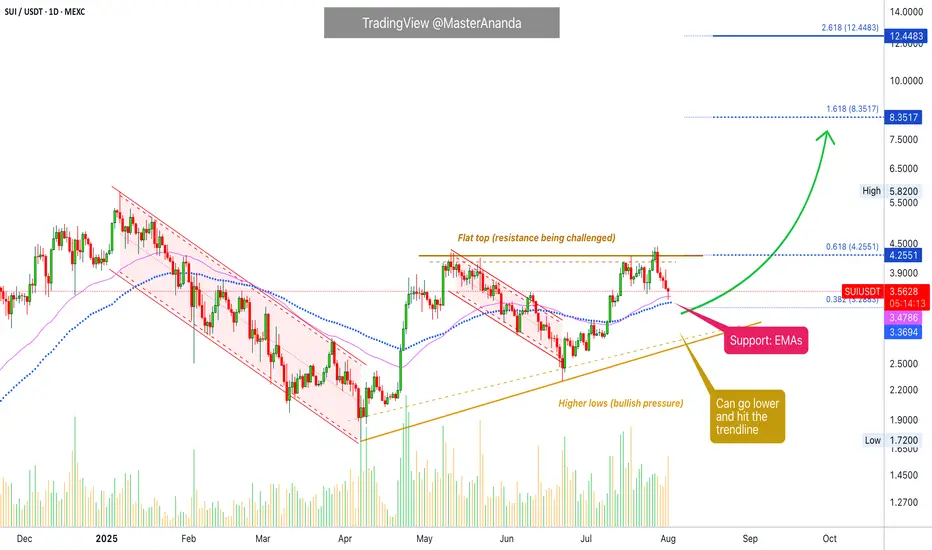
Sui Update · Support Found, Moving AveragesWe will focus solely on the chart. As a move happens, there are always fluctuations, down and up. What determines the trend is not the short-term but the broader market move. When a pair is producing higher highs and higher lows, we are growing and going up. If there is a drop short-term, this is nothing more than a retrace because prices (profits) are rising mid- and long-term. This is the current situation and has been true for many months.
Each time Sui retraces, it finds support and then continues to grow.
SUIUSDT peaked 28-July, now five days ago. A classic retrace because after this date all days are red. Facing resistance led to immediately to a test of support. A test of support tends to lead to a new challenge of resistance.
SUIUSDT is working support at EMA89 and EMA55 daily, the same levels we had active on the last update. These levels seen to be holding strong so far and if they hold, we can see growth right away. Normally, support tends to be pierced briefly and then the market turns. So anything goes.
We can see a reversal happen now, or it can take a few days at most. The action is already happening at support and within a higher low. It can move a bit lower, but we are getting ready for the next bullish jump. This one will be a surprise and it will bring the entire market up. No excuses, no reason, just up.
Namaste.
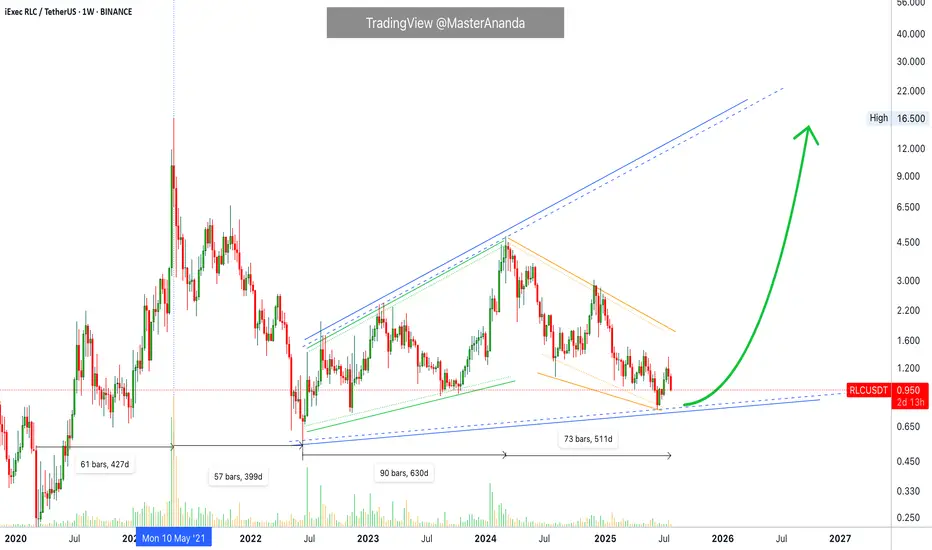
iExec RLC · Trading at Bottom with a Bullish BiasiExec RLC (RLCUSDT) is still trading at bottom prices but the overall market conditions are good. Good for the future because the market moves in waves alternating always between rising and falling.
RLCUSDT went bearish between May 2021 and June 2022, 399 days. Then it went bullish from June 2022 to March 2024, 630 days. Then it went bearish again between March 2024 and present day, August 2025. More than 510 days.
While RLCUSDT has been bearish more than a year, the action is still happening as a long-term higher low. That is, prices today and at the lowest—16-June 2025—are still higher compared to the low in June 2022.
Of course before being bearish in 2022 the market was bullish between March 2020 and May 2021, 427 days. Here we can clearly see the fluctuations between bear and bull, uptrends and downtrends.
The last uptrend came in 2021 and we are due a new one. Crypto grows every four years and market conditions are perfect for the next run. The market has been mixed, sideways and neutral for years on end, the long-term higher low is a single of strength. After the current retrace is over, you can prepare for a major bullish wave.
Namaste.
Simple Psychology Tips Using Volume for Better TradingMany newer traders assume that when someone says "psychology" in trading, they are referring to mindset.
It is also widely believed that trading is about the BEST entries.
Now, think of it this way. It is not about winning trades, it is actually about managing losses well to allow you to take the winners over and over again. You might think that a 3 to 1 risk-to-reward strategy is boring, you might have gone all in on your favourite crypto project. But what makes the difference between gambling and trading is actually very, very simple. So simple, in fact, many overlook it or simply ignore it.
Most seek a silver bullet - high win rates and perfectly timed entries, then they overleverage and move stops on the one "good trade" they are seeking to make.
Whilst doing this, they tend to overload the 6 monitors they have purchased to trade with a thousand indicators, which they don't really need.
The candlesticks tell a story, volume supports that story. When you learn any technique from Elliott Waves to Wyckoff, they all have a dependence on volume - even if the correlation is not apparent.
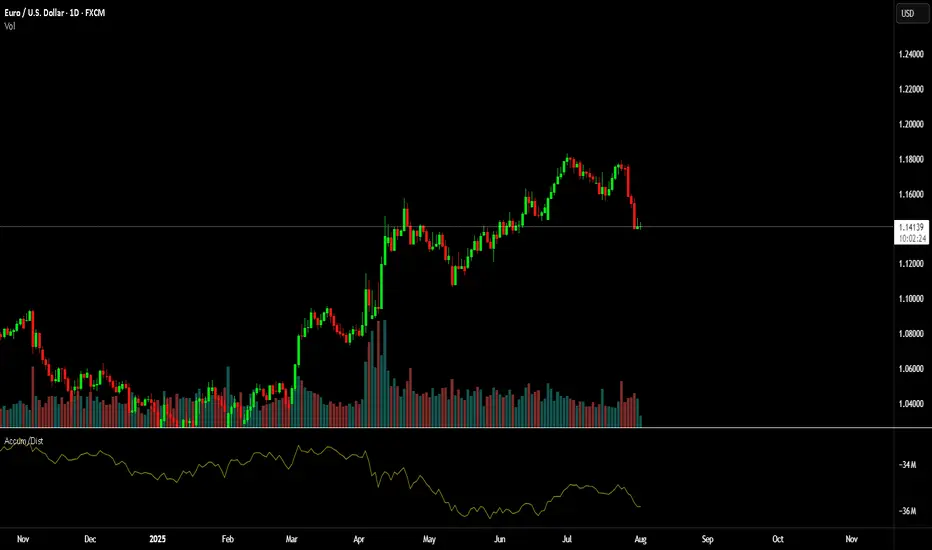
Look at this first image.
Price had moved down since the vertical line, the AD line also moved down - sell-off, in full swing. But then volume starts to shift before the AD line starts to increase.
Now, look at what happens next...
As we move forward and the new vertical line shows where volume spiked, the AD line starts to decrease as the price continues to rise.
This is enough of a story to start your analysis.
We then get a move with a lower high formed.
As this plays out, the sell-side volume rises, creating momentum for the short position.
Look a little closer and you will see, that the volume on the move up just before the drop was also decreasing. Making a divergence to price.
You might feel that the market is against you, or that the big players are single-handedly seeking your stops. But the truth is, the psychology in moves such as this one shown is where most retail traders either have greed that markets will only go up for ever or the fear that they are missing out on a market that only goes up forever.
It is that herd mentality that generates the liquidity for the professionals.
Losing 1% on a trade, is part of the process, risking 80%> on a single move will make you paper rich for about 10 minutes before the real losses set in.
This is where the psychology and the basic techniques such as risk management and understanding what candlesticks and volume bars are telling you, will make a world of difference to your results.
A/D line and volume are free on @TradingView and to be fair you don't need to overcomplicate it more than that!
Stay safe, have a great weekend all!!!
Disclaimer
This idea does not constitute as financial advice. It is for educational purposes only, our principal trader has over 25 years' experience in stocks, ETF's, and Forex. Hence each trade setup might have different hold times, entry or exit conditions, and will vary from the post/idea shared here. You can use the information from this post to make your own trading plan for the instrument discussed. Trading carries a risk; a high percentage of retail traders lose money. Please keep this in mind when entering any trade. Stay safe.
Crypto Market Slows Down For A Pullback Within A Bullish TrendGood morning Crypto traders! Cryptocurrencies are coming slightly lower on the intraday basis due to stock market decline yesterday, but we still see them approaching support, so still be aware of a bounce and recovery at the end of the week or maybe next week because of an upcoming weekend. Crypto TOTAL market cap chart can be trading in wave »y« of a complex w-x-y correction in wave 4, unless it's a flat correction, but support is the same at 3.6T – 3.5T area, from where we may see a bullish continuation within wave 5.

JUSDT Short-Term Retrace vs Long-Term UptrendJST is not trading at bottom prices because the low was hit November 2022, but the bigger picture still looks like a long-term consolidation pattern. Sideways for years, this precedes a major bull market.
Good morning my fellow Cryptocurrency trader, I hope you are having a wonderful day.
JSTUSDT is looking weak short-term but we know this to be part of the same process, the one that has been going on for years. Higher lows and higher highs but still no major bullish wave, it is getting closer though because the market can only consolidate for so long.
JST has been rising. The high December last year (2024) hit the highest prices since March 2022, the month when the previous bear market breakdown took place.
The red period is the bear market. Notice how it ends when the downtrend is no more and the market turns blue, sideways. After this period comes green and this is where we are now.
Within the bullish period we also have retraces and corrections. Right now we have a bearish move, short-term, within a wider bullish move, an uptrend long-term. This is the normal and classic market fluctuations; prices moving down and up, up and down, back and forth, every day.
The end of the short-term move will result in the continuation of the bigger move, the uptrend. We should expect a higher low followed by a strong higher high next. The next higher high comes in late 2025, now.
Thank you for reading.
Namaste.

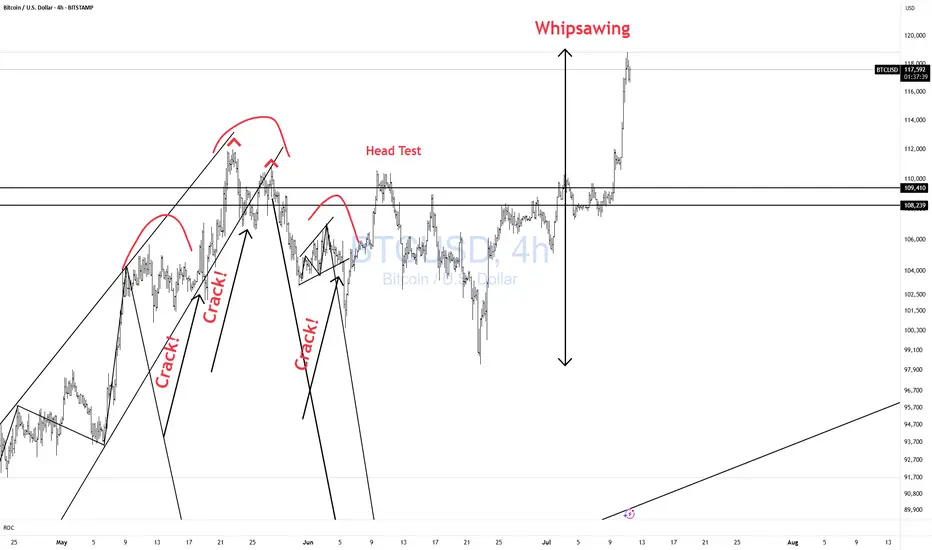
BTCUSD Whipsawing! CAUTION!Bulls CAUTION! Price is whipsawing all over the place.
Better to be out of the market wishing you were in than in wishing you were out!! Don't chase!!
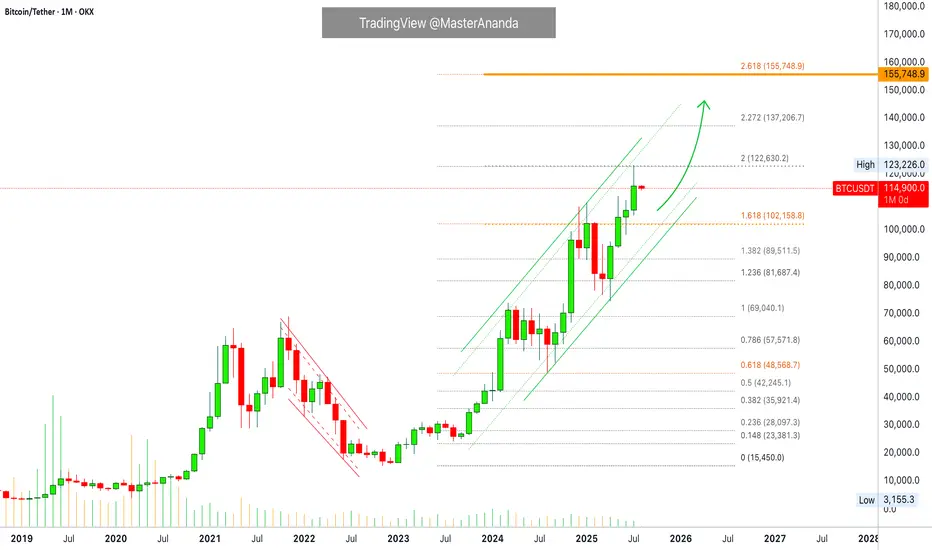
Bitcoin Monthly · Parabolic Rise ContinuesLast month Bitcoin produced its best numbers ever. The highest wick and close, a new all-time high at $123,226.
Bitcoin is not exhausted on the monthly timeframe but there is room for a retrace before the month ends. Think of the first part of the month being mixed, neutral or even bearish while the second half becomes full time bullish.
The levels that are relevant are $122,000 on the bullish side and $102,000 on the low. Right now the action is happening close to the middle so anything goes.
In 2020 Bitcoin produced 7 monthly candles growing and this was repeated again in 2023. In 2025 we have so far four green candles which means that Bitcoin can easily continue to grow. It has been known to produce more than four months green many times but there can be exhaustion at some point.
Bitcoin has been moving within a strong uptrend and is likely to continue rising. Bullish until the chart says otherwise. We are going up. Short-, mid- and long-term.
As Bitcoin consolidates near resistance, the altcoins will continue to build strength in order to grow. Remember, we are still looking at bottom prices across thousands of altcoins. Only a few moved ahead and are trading at all-time highs, the rest will catch up. The time is now, late 2025. The best is yet to come.
Namaste.
Bitcoin is at KEY zone - time for LONGBitcoin is at KEY zone - time for LONG
price hit key zone
if we furtunite - pric will go up to take range high

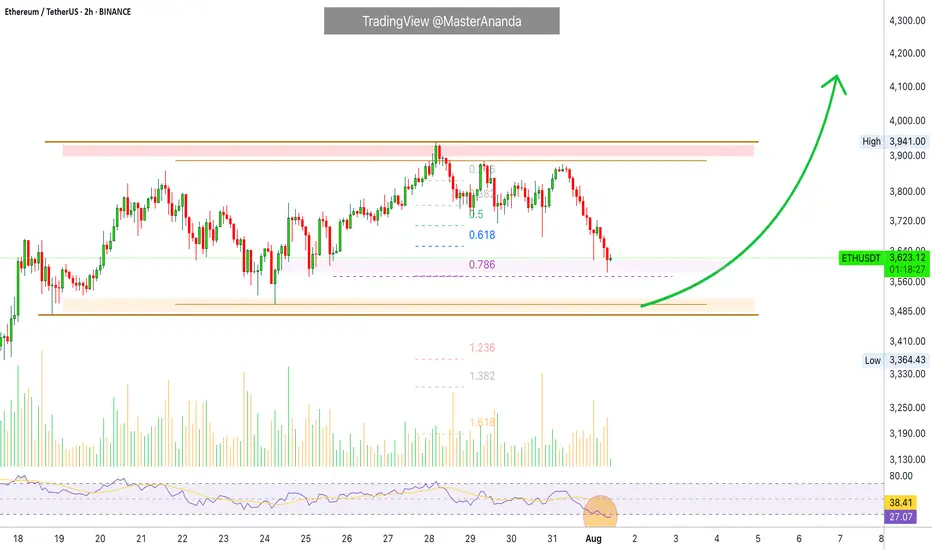
Ethereum Short-Term · Trading within Bullish RangeI am looking at Ethereum short-term using the same timeframe I used for Bitcoin, 2h. We have some interesting signals.
Here ETHUSDT is trading within higher lows. This is interesting because Bitcoin produced a lower low recently. The same volume signal is present here, ETHUSDT has been producing lower bearish volume since last month.
The RSI produced a lower low while ETHUSDT produced a higher low. This is called a hidden bullish divergence. Ethereum's bears did not only fail to take out the last low 24-July but also the previous one, and this clearly reveals bullish support.
The RSI being oversold is also a positive condition and can signal a reversal happening soon. Not truly a reversal because we are not in a downtrend, we are still witnessing a small pause after a strong rise; consolidation near resistance. A continuation reads better.
Ethereum's price continues really strong and the short-term signals are pointing to bullish action being favored in the coming days. We can wait easily and patiently because the best is yet to come. Never SHORT in a bull market, the market will surprise you with how fast things can turn. Better wait for support and go LONG.
Namaste.
dYdX Bottom Consolidation Continues, Bullish NextHere you are looking at the formation of a bottom. The formation is a process not a single day event. It can take months for a bottom to fully form.
The way you know this to be true is because there is no downtrend. There are no new lows.
DYDX has been sideways now for 179 days, 6 months. Since early February 2025. In just three months, between December 2024 and March 2025, there is a very strong decline; lower highs and lower lows. A bearish move, a down-wave, a downtrend.
Ever since February the downtrend is no more. Rather than new major lows we have shy lower lows and finally not even that, no new lows. You can see the pattern how the market turned from bearish to sideways. This is the transition period. From sideways it will turn bullish, bullish goes next.
This is the point in time when most people will lose patiently and fold at a loss. Sell at the bottom, near support. This is the most important time to be patient, to accumulate, to even buy more and hold because we are looking at bottom prices. When prices are trading at the bottom and you are a bull, you can't go wrong.
Buy and hold. Continue holding because the market will soon turn.
Namaste.

ZRX to $1 ZRX is consolidation at the very bottom price, and with alt-season hopefully get a rally to $1

ETH/USDT | ETH Under Pressure – Watch $3500 Support!By analyzing the Ethereum chart on the weekly timeframe, we can see that after reaching the $3940 zone, ETH faced selling pressure and is now trading around $3540. If the price fails to hold the key $3500 support, a deeper decline is likely, with potential targets at $3040 first and possibly $2680 as the second bearish target.
Please support me with your likes and comments to motivate me to share more analysis with you and share your opinion about the possible trend of this chart with me !
Best Regards , Arman Shaban

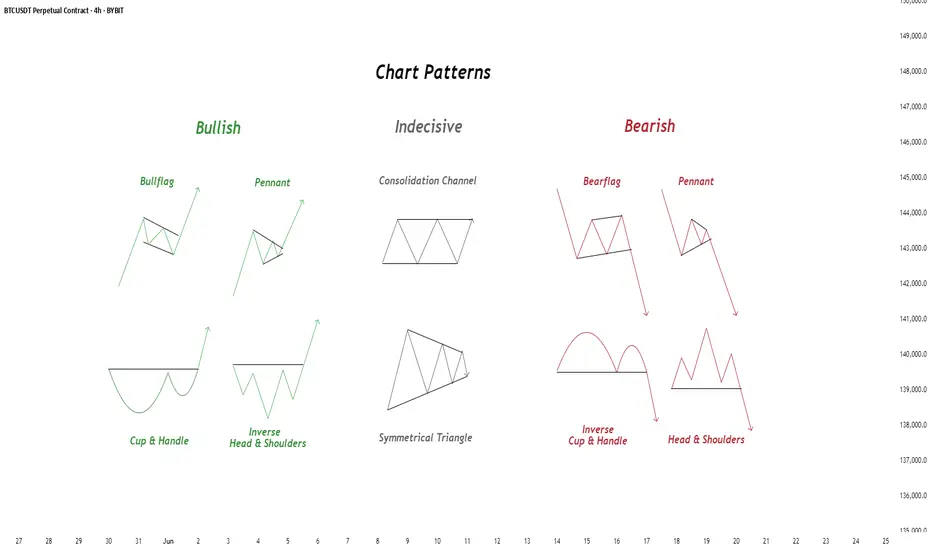
Chart Patterns - How to read them like a ProChart patterns are visual formations on price charts that help traders anticipate potential market movements.
These patterns fall into three main categories: bullish , bearish , and indecisive .
---
1. Bullish Chart Patterns
Bullish patterns often signal that price is likely to move upward.
1.1 Bull Flag
* What it looks like: A sharp upward move followed by a small downward-sloping rectangle (the flag).
* Meaning: After a strong rally, the price consolidates briefly before continuing higher.
* Key insight: A breakout above the flag typically signals a continuation of the trend.
1.2 Pennant (Bullish)
* What it looks like: A strong upward move followed by a small symmetrical triangle.
* Meaning: Similar to the bull flag, but the consolidation takes a triangular form.
* Key insight: Once price breaks above the pennant, the uptrend often resumes.
1.3 Cup & Handle
* What it looks like: A “U”-shaped curve (the cup) followed by a small downward drift (the handle).
* Meaning: This pattern suggests a period of accumulation before price breaks higher.
* Key insight: A breakout above the handle signals the beginning of a new bullish leg.
1.4 Inverse Head & Shoulders
* What it looks like: Three low points, with the middle low being the deepest.
* Meaning: This reversal pattern appears after a downtrend and signals a potential change to an uptrend.
* Key insight: A breakout above the “neckline” confirms the reversal.
---
2. Indecisive Chart Patterns
These patterns show market hesitation, where neither bulls nor bears are clearly in control.
2.1 Consolidation Channel
* What it looks like: Price moves within a horizontal channel.
* Meaning: Market is moving sideways with no strong trend.
* Key insight: A breakout in either direction often leads to a significant move.
2.2 Symmetrical Triangle
* What it looks like: Two converging trend lines forming a triangle.
* Meaning: This is a neutral pattern that can break out in either direction.
* Key insight: Traders wait for a breakout before taking a position.
---
3. Bearish Chart Patterns
Bearish patterns signal a high probability of downward price movement.
3.1 Bear Flag
* What it looks like: A sharp decline followed by a small upward-sloping rectangle.
* Meaning: After a strong drop, price consolidates before continuing lower.
* Key insight: A breakout below the flag suggests a continuation of the downtrend.
3.2 Pennant (Bearish)
* What it looks like: A sharp downward move followed by a small symmetrical triangle.
* Meaning: Similar to the bear flag, but the consolidation takes a triangular form.
* Key insight: A breakout downward typically resumes the bearish trend.
3.3 Inverse Cup & Handle
* What it looks like: An upside-down cup with a small upward drift forming the handle.
* Meaning: Indicates weakness after an uptrend, often followed by a drop.
* Key insight: A break below the handle usually signals a strong bearish move.
3.4 Head & Shoulders
* What it looks like: Three peaks, with the middle one being the highest.
* Meaning: A classic reversal pattern that indicates a potential shift from an uptrend to a downtrend.
* Key insight: A break below the “neckline” confirms the bearish reversal.
---
How to Use These Patterns
* Combine pattern recognition with support/resistance, volume, and indicators for stronger confirmation.
* Always wait for breakouts and avoid acting too early.
* Manage risk with stop-loss orders.
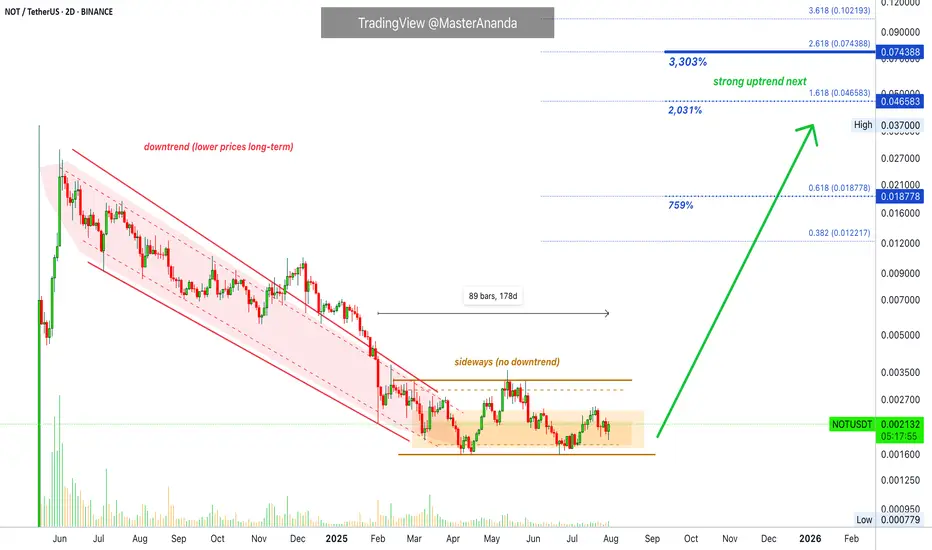
Notcoin · Last Call, Last Chance · Friendly ReminderWe looked at Notcoin recently and this is the last time you will see a publication at these low prices. In the next Notcoin update the price will be at least 100% higher and growing, we will be in the middle of a full blown bullish wave.
Right now Notcoin is still trading at the lower end of a downtrend. The downtrend ended and the market went sideways. Sideways is what we have now. The accumulation phase and zone where whales, smart trader and experts buy the most. The obvious reason being because it is always better to buy when prices are low.
4-8X. We are going with 6X for this one but the choice is yours.
Notcoin can grow anywhere between 1,000% and 3,000% in the coming months. I will aim for the higher targets just because I know this bull market will be very strong based on the charts and the early action we are getting. We are still at bottom prices marketwide and yet some pairs are already trading at new all-time highs. It means that this bull market will be big, bigger than usual and bigger than anything you can expect or imagine.
The strategy is to buy and hold. Spot. If you are leverage, then you need to decide on your risk, at this point, 2-3X is safe. Anything higher and you are opening yourself to a risky situation. Higher would imply higher profits potential, but would you risk everything for just a potential? Better play it safe while aiming big. If the pair can grow 30X in the coming months, leverage might not be the best choice.
Some people do both. What is your trading style? What are your trading goals?
Spot or leverage, low or high risk, we are going up. We had plenty of time to buy, plenty of warnings and plenty of opportunities. The market will wait no more. Prepare for the start of a mega bull run.
Thanks a lot for your continued support.
Namaste.
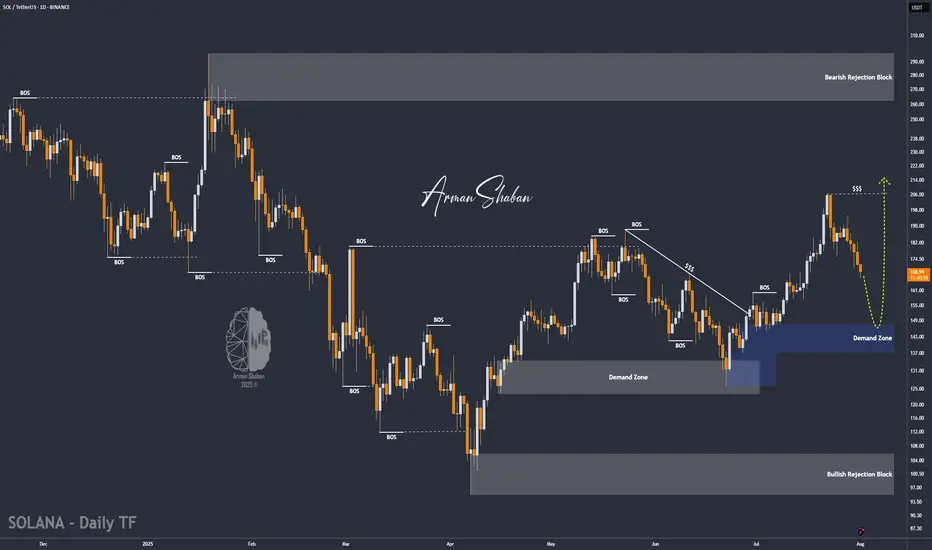
SOL/USDT | NFP Volatility Could Trigger Drop Toward $154!By analyzing the Solana chart on the daily timeframe, we can see that the price is currently trading around $169. If it fails to hold above the $168 level, a deeper drop could follow. With the upcoming NFP data release, increased volatility is expected across the markets. If Solana begins to decline, the potential correction targets are $163, $157, and $154. Watch the $145–$154 zone closely for a possible bullish reaction and buy opportunity.
Please support me with your likes and comments to motivate me to share more analysis with you and share your opinion about the possible trend of this chart with me !
Best Regards , Arman Shaban
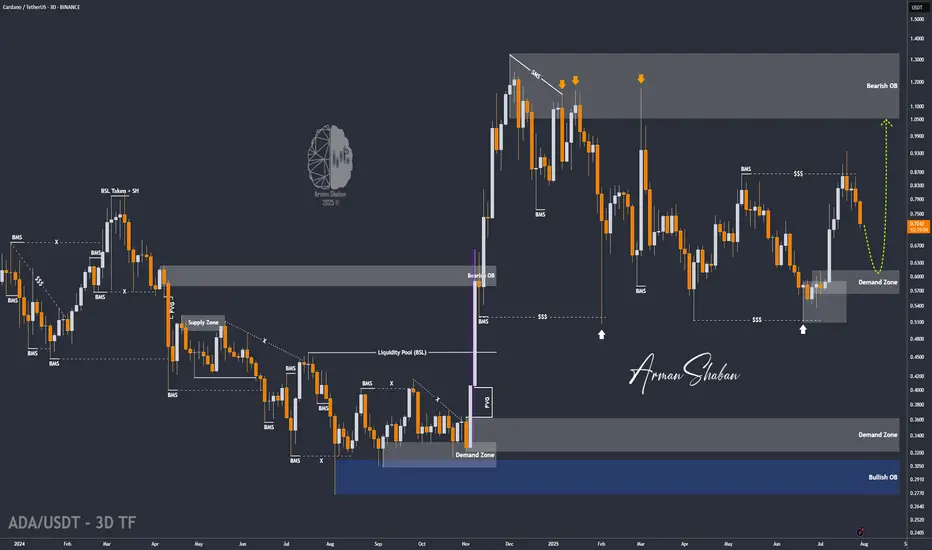
ADA/USDT | ADA Slips Below Support – Watching $0.61 for Support!By analyzing the Cardano chart on the 3-day timeframe, we can see that the price failed to hold above the $0.75 support and is currently trading around $0.72. Given the current momentum, a deeper correction for ADA seems likely. If the price fails to stabilize above $0.69, we could see a sharp drop toward the $0.61 zone. If ADA reaches this key support area, keep a close eye on it — a strong bullish reaction could lead to the next big upside move!
Please support me with your likes and comments to motivate me to share more analysis with you and share your opinion about the possible trend of this chart with me !
Best Regards , Arman Shaban
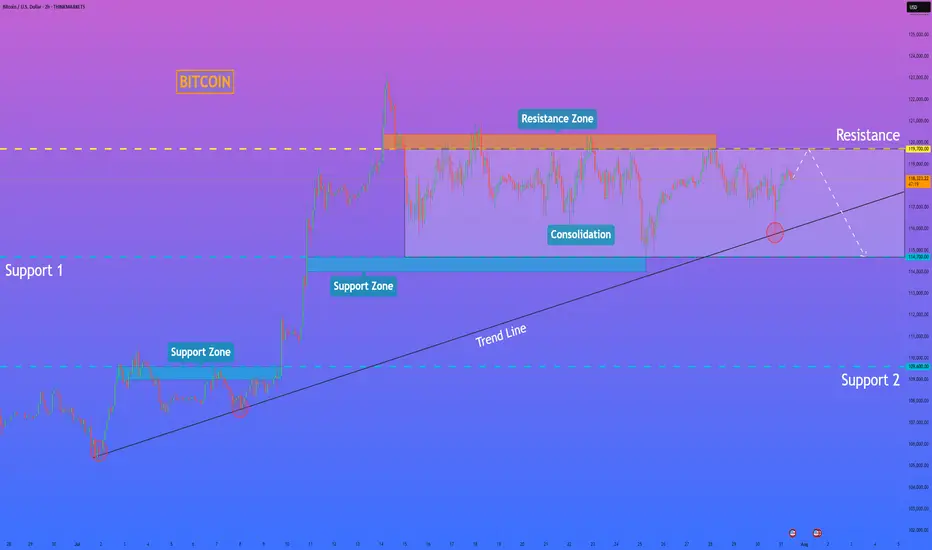
HelenP. I Bitcoin will rebound down from resistance levelHi folks today I'm prepared for you Bitcoin analytics. A technical review of the chart reveals a prolonged period of horizontal consolidation, during which the price has been trading within a well-defined range between support at 114700 and resistance near 119700. This phase of balance follows a significant prior uptrend, and a major ascending trend line is currently intersecting this range. My analysis for a short position is based on the expectation of a final 'test and fail' at the top of this consolidation. I believe the price will make one more attempt to rally towards the resistance zone around 119700. A strong rejection from this area, demonstrating sellers' control, would serve as the main confirmation for a bearish bias. Such a rejection would likely initiate a powerful downward move across the range, with sufficient momentum to break the critical ascending trend line. This would be a significant structural event, signaling a potential reversal of the larger trend. Therefore, the primary goal for this scenario is logically set at the 114700 support level, the bottom of the consolidation range. If you like my analytics you may support me with your like/comment ❤️
Disclaimer: As part of ThinkMarkets’ Influencer Program, I am sponsored to share and publish their charts in my analysis.
HBAR Momentum Hbar has gained some momentum lately. This is the ideal rally setup.
It has also yet to see real price discovery past .5
Large trade already opened.
DYOR, I believe this coin has a ton of potential.
Hederas' Council consists of entities like Google, IBM, Boeing Through VentureX, Standard bank.. Just to name a few.
But you all don't care about that.

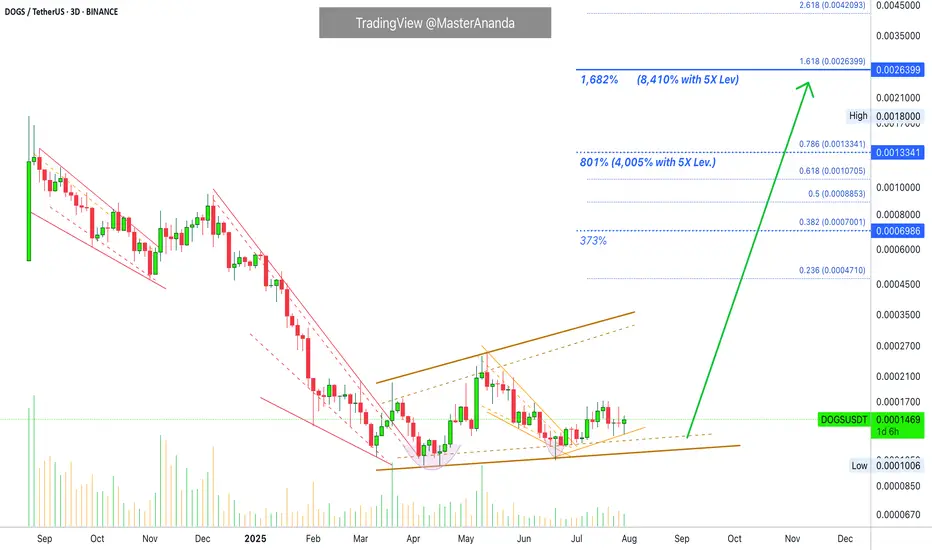
Dogs 5X Leveraged Trade-Setup (8,410% Profits Potential)Dogs continues to consolidation at bottom prices producing higher lows. With each passing day/session and candle, DOGSUSDT gets closer and closer to a strong bullish breakout. If you remember recently this pair produced for us more than 800% profits with 7X, the entire move was about 150% strong, between April and May. The move that will develop now will be many times stronger. With a leveraged position we can easily aim for 300-500% profits. So 5X lev. can easily do 1,500 to 2,500%. But this is only the start, the move that is developing now is a major advance, bull market type of situation, and this can result in more than 1,000% growth for Dogs and many other altcoins. This can mean really high profits with leverage.
Leverage increases the risk of default and makes the game that much more complex, so you should avoid it if you want peace of mind. If you don't mind the extra risk and stress, you can go for the higher profits. Timing right now is great.
Once or twice per year only we get this major positive entry, high probability entry. It doesn't happen often. Only once in a while the market forms a clear bottom, a support zone, and from this bottom a new bullish impulse is launched. Only once every several years, the time is now.
This is a strong chart setup. Dogs has been sideways now for a full six months. Six months sideways is the perfect time duration for a 1,000% bullish jump. Give or take 5X, we are looking at 5,000% potential for growth.
Patience is key. The market will bless us with endless opportunities like this. I will show you another one right away.
Thank you for reading.
Namaste.
Bitcoin willIt hold if we stay above $115k ?? Fixing up last post I’ve deleted now as image was not good. Anyway simple RSI and Auto Fib Retrace with only general CRYPTOCAP:BTC market understanding backing this. This isn’t finacial advice at all. It’s pure speculation this post and anything related to it. I’m
Not a finacial advisor and I will not be held accountable for anyone’s actions that I didn’t do.
