BITCOIN GOLDEN CROSS ABOUT TO HAPPEN!bitcoin golden cross is about to happen! The last time this happened was in August 2021, 3 months before the latest all-time high. Get ready for potential volatility.
We have seen a 76% pump from the previous golden cross, If #btc price would follow the same trend 76% would land bitcoin at the 37k level.
major support right now in the daily timeframe will be the 200ma.
Crypto-trading

✅BITCOIN WILL KEEP GROWING|LONG🚀
✅BITCOIN went down to retest
A horizontal support
Which makes me bullish biased
And I think that a move up
From the level is to be expected
Towards the target above
LONG🚀
✅Like and subscribe to never miss a new idea!✅

Looks to be worth putting in a few hundred bucks here?
We could see a flag breakout anytime now!
Alethea AI token $ALI is new since 2022 and only has a 3BL circulating supply according to Coin Market Cap and Coin Gecko. With all the AI talk and how Google and Mircosoft is now investing billions into AI I see that this can give high gains with a relatively low supply for being a token.
Alethea AI network is focusing on becoming a research and development studio for combining generative AI and blockchain technology. The company is focusing on becoming a research and development studio for combining generative AI and blockchain technology so this does have the potential to see future partnerships that can launch this above a dollar fairly quickly. Once I see partnerships my hundreds will turn into thousands in the amount I will invest.


OCEAN swing trade ideaMarket key levels on OCEANUSDT for swing trade. Reaching an interesting position

#btcsstarburst BItcoin Zoom out readThis has been ongoing for over two years. Random comments and concepts. Mostly consistent Zoom out and follow along Gann study

DYDX - Decentralised Perpetual Protocol - High conviction Setup DYDX - Decentralised Perpetual Protocol - High conviction Setup $DYDX
Retest $2.7 level and the prolly next target is $4.42

$ATOM - Cosmos Layer 1 - 50% Potential$ATOM - Cosmos Layer 1 Blockchain - 50% Gains Potential
Developers have built hundreds of blockchain projects on Cosmos, including Binance Chain (BNB), Terra (LUNA), Crypto.com Coin (CRO), Cosmos Hub (ATOM), and more.
On a successful break out of $17, $ATOM has a potenital of 48% Gains,
Aggressive entries only here, will be adding on a clean break out above.
Support Levels - $10.5 ,$12.2
Next resistance - $16.5,$21.3,$25.5
Invalidation clean break below $9.5

LITECOIN Strong Resistance! Sell!
Hello,Traders!
LITECOIN has reached a
Strong horizontal resistance
And I think that we will see
A local move down
Sell!
Like, comment and subscribe to boost your trading!
See other ideas below too!

BRIEFING Week #5 : Markets Anticipated, Will Reality Confirm ?Here's your weekly update ! Brought to you each weekend with years of track-record history..
Don't forget to hit the like/follow button if you feel like this post deserves it ;)
That's the best way to support me and help pushing this content to other users.
Kindly,
Phil

TON Plan A / Plan B entry if price action gets rejectedTON Plan A / Plan B
Plan A price action may get rejected at 0.382 ( fib extension level )
enter on support bounce around 0.236 fib extension level
Plan B enter ( safer entry ) retest of price action 2.6747
Market Cap: 3.1B
Category: Layer 1 (designed by telegram)
Target 1: 3.2122
Target 2: 3.5786
Target 3: 3.8845
Stop Loss: 2.2410
Manage Risk - have a stop loss in place
Not Financial Advice
This is for Entertainment Only

XMRUSDT In case of failure, this range can be similar to the photo
❌These analyzes are just to give a better perspective for you dear ones
Do not base on buying and selling❌

IMPORTANT BTCUSDT SOON CRASH?,❗️IMPORTANT BTCUSDT SOON CRASH?,
On our 1 Hour timeframe chart, and
after forming a Head and Shoulders Pattern, we are currently consolidating on the trend that it has formed, broke a structure to the downside, right now we are currently retesting its POI (Point of interest)

BRIEFING Week #4 : Still want to Play Crystal Ball ?!Here's your weekly update ! Brought to you each weekend with years of track-record history..
Don't forget to hit the like/follow button if you feel like this post deserves it ;)
That's the best way to support me and help pushing this content to other users.
Kindly,
Phil

TFUEL: VIEW OF INCREASETFEUL showing on low time frame volume.
we will see if this volume is able to get confirmed.

SNX : READY FOR THE BREAKOUT BOXThe market is still stable, and there are not much of changes, SNX seems interesting and is able to breakout in the coming time.
We will see if it's able to get an uptrend to the breakout box.

KNC : OVERVIEW UPTRENDKNC is one of the coins selected today for an uptrend. We will closely monitor the coin to see if it can generate further gains

CRV : INCREASE VIEWThe market seems still stable for day trading, CRV can show coming time an increased view for day trading since it's an important target for confirmation of an uptrend.
we will follow this coin to see if it's able to show some increased view.
At this moment the coin is still stable and going depending on normal market trends,the study shows that the coin are able to increase coming time.
We check always the last possibility and chances on the markets.
CRV seems on this time frame interesting for the watchlist.
The coin has a good possibility to increase over the $1

DYDX : BREAKDOWN VIEWDYDX : BREAKDOWN VIEW
we will follow to see if this coin is able to break down more to check the below levels.


Bitcoin Analysis, Support/Resistance zonesBINANCE:BTCUSDT
Resistance zone: 18800
Support zone: 16200
Next target: 14700

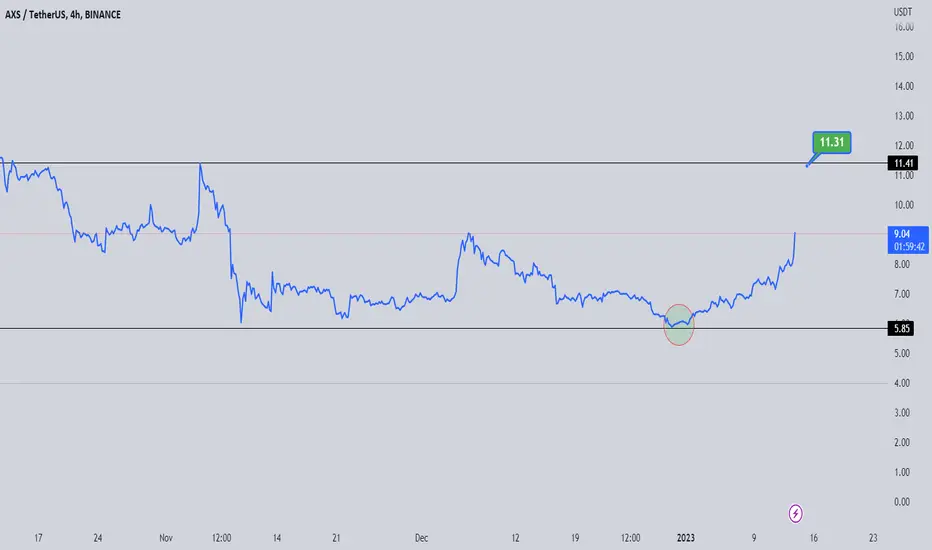
AXS : ENTERING NEW UPTRENDAXS seems to enter a new uptrend since the volume shows good trends.
FOCUS target $11.30
Depending on the last live trend scan is this the trending coin.
✅BITCOIN GROWTH AHEAD|LONG🚀
✅BITCOIN will keep growing
Because the pair is in the uptrend
And recently broke the key level
So we will be expecting
Bullish continuation
LONG🚀
✅Like and subscribe to never miss a new idea!✅
