ADA Spot Trade Setup – Support Level OpportunityCardano (ADA) is currently sitting at a key support zone, presenting a solid risk-to-reward long opportunity if bulls can hold the level.
🛠 Trade Plan:
Entry: $0.63 – $0.70
Take Profit Targets:
$0.78 – $0.84 (First Target)
$0.96 – $1.02 (Extended Target)
Stop Loss: Just below $0.58
Crypto-trading

Trading opportunity for GPSUSDTBased on technical factors there is a Buy position in :
📊 GPSUSDT
🔵 Buy Now
🪫Stop loss 0.02200
🔋Target 0.04300
📏 R/R 3,2
💸RISK : 1%
We hope it is profitable for you ❤️
Please support our activity with your likes👍 and comments📝

BRIEFING Week #13 : ETH offers perfect opportunityHere's your weekly update ! Brought to you each weekend with years of track-record history..
Don't forget to hit the like/follow button if you feel like this post deserves it ;)
That's the best way to support me and help pushing this content to other users.
Kindly,
Phil

BITCOIN BEARISH WEDGE BREAKOUT|SHORT|
✅BITCOIN made a bearish
Breakout of the bearish wedge
Pattern which reinforces our
Bearish bias and we will be
Expecting a further move down
SHORT🔥
✅Like and subscribe to never miss a new idea!✅
Disclosure: I am part of Trade Nation's Influencer program and receive a monthly fee for using their TradingView charts in my analysis.

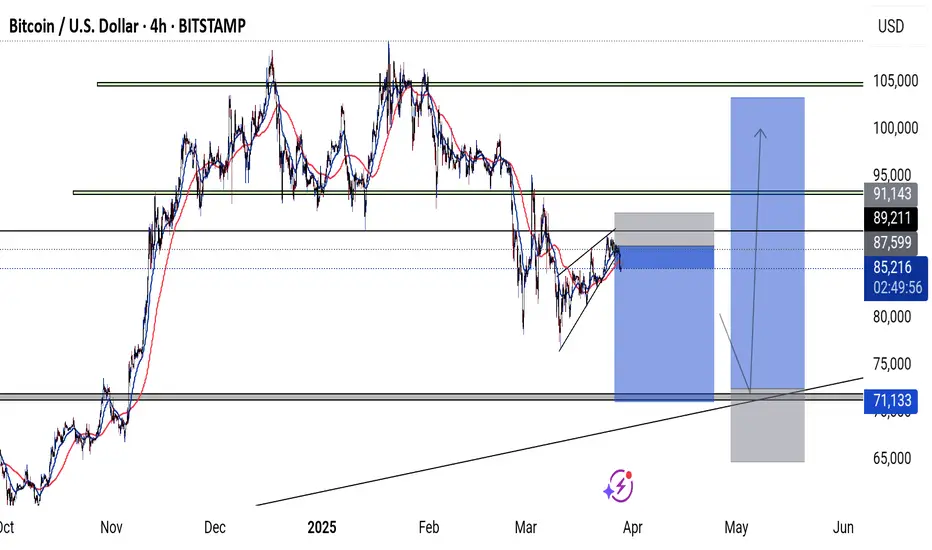
BTCUSDTo the bitcoin lovers, investors and traders, this is my forecast on BTCUSD.
With all the news that are circulating about the crypto world, bad or good. Currently BTC is looking bearish. I will be looking for buy at the 71,671 level if BTC will find support.
Please tell us what you think. Is BTCUSD going down or up ?
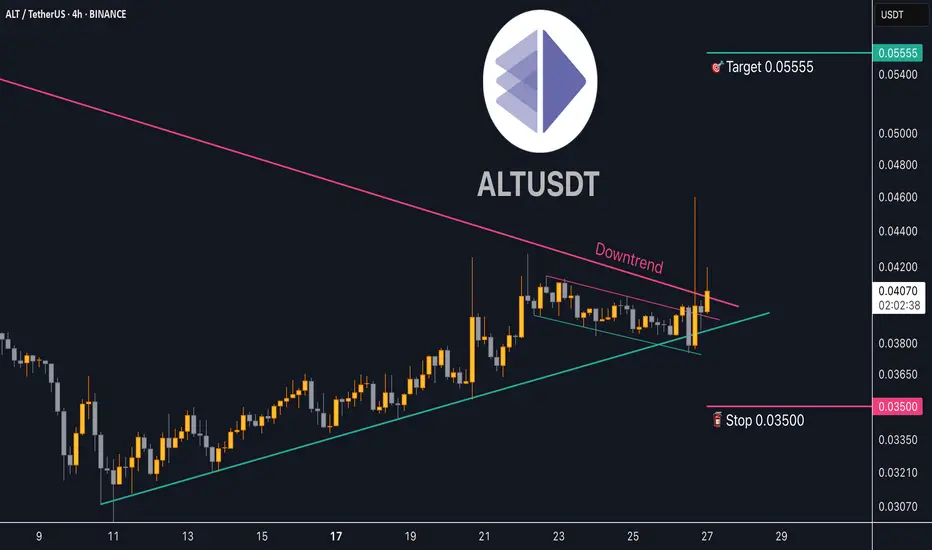
Trading opportunity for Altlayer ALTUSDTBased on technical factors there is a Buy position in :
📊 ALTUSDT
🔵 Buy Now
🪫Stop loss 0.03500
🔋Target 0.05555
📏 R/R 2,4
💸RISK : 1%
We hope it is profitable for you ❤️
Please support our activity with your likes👍 and comments📝
Trading opportunity for MOVEUSDTBased on technical factors there is a Buy position in :
📊 MOVEUSDT
🔵 Buy Now or by Breakout
🪫Stop loss 0.3680
🔋Target 0.5500
📏 R/R 2
💸RISK : 1%
We hope it is profitable for you ❤️
Please support our activity with your likes👍 and comments📝

ETH/USD – Bullish Breakout & Buying OpportunityEthereum has broken out of a descending channel and is consolidating near a key support zone. The price action suggests a potential bullish continuation, with a buying opportunity forming above the $2,000 - $2,100 support level.
Key Levels to Watch:
Support: ~$2,000, ~$1,800
Resistance Zone: ~$2,250
Target: ~$2,530
Trading Plan:
Buy Entry: On breakout and retest above $2,250
Stop-Loss: Below $2,000
Take-Profit: $2,530
If Ethereum successfully breaks resistance with volume confirmation, it could rally toward $2,500+, making this a strong bullish setup. Keep an eye on price action for confirmation. 🚀

BTC at a Critical Crossroad – Buckle U🤯 BTC at a Critical Crossroad – Buckle Up! 🚀
Ladies and gentlemen, welcome to "Bitcoin Wrestling Mania!" 🎤💥 BTC is currently stuck in a high-stakes battle with the legendary 200 EMA resistance 🥊🔥. We've conquered the 20 EMA, but let’s not pop the champagne just yet – the daily candle hasn’t closed! 🕰️ Expect surprises! 🎭
📊 Resistance Levels Ahead:
🔹 First Boss: 50 EMA Resistance 🏰
🔹 Final Boss: The 89,773.0 Fortress 🚧
Now, we're seeing some short-term bullish vibes 🟢, but wait – the market makers might have other plans 🕵️♂️💰. The smart money hasn't entered the ring yet, which means... well, expect plot twists! 😵
🔻 Possible Correction Zones:
💥 Support 1: 80,548.0
💥 Support 2: 76,123.0
So, will BTC power through the resistance like a champion 🏆, or are we about to witness a dramatic correction 🤕? Drop your thoughts below – let’s piece together the puzzle! 🧩👇
#BTC #Crypto #Trading #Bitcoin 🚀

Trading opportunity for HYPEUSDTBased on technical factors there is a Buy position in :
📊 HYPEUSDT
🔵 Buy Now
🪫Stop loss 11.400
🔋Target 16.750
📏 R/R 2
💸RISK : 1%
We hope it is profitable for you ❤️
Please support our activity with your likes👍 and comments📝

BRIEFING Week #12 : Alt-Season might be coming soonHere's your weekly update ! Brought to you each weekend with years of track-record history..
Don't forget to hit the like/follow button if you feel like this post deserves it ;)
That's the best way to support me and help pushing this content to other users.
Kindly,
Phil

BTC | USD - The Crypto Rodeo with PipGuardBTC | USD - The Crypto Rodeo with PipGuard
Hello, fellow financial misfits! Already regretting not closing your trade when you were in profit? Don’t worry, you’re in excellent company.
Before we dive in, let’s get one thing straight: if my analysis is saving you from ending up like FTX , then do yourself a favor— drop a boost, follow me, and leave a comment!
🚀 LET’S GO:
- Analysis to compare with the previous one that gave us a sweet 6K move, from 82K to 76K. Well done, colleagues! No Ferraris this time either, but at least you won’t have to sell your cat to cover your margin call. 🐱💸
CURRENT SITUATION: THE MARKET CIRCUS
Here we are, fresh update just for you, because I know that without my guidance, you’re staring at your charts like a confused goldfish. 🐟
Meanwhile, while Bitcoin figures out whether to go up, down, or just mess with us all, the real world keeps delivering its fair share of nonsense. Trump (a.k.a. the blond guy with a ramen wig) 🍜 is still keeping us entertained, while geopolitics is tangled up like a pair of earphones in your pocket.
And now, get this: Russia is using Bitcoin to trade oil with China and India.
🔹 Mother Russia’s Trick:
1. China and India pay for oil in yuan or rupees.
2. Everything gets converted into Bitcoin and other cryptos.
3. Russia cashes in and smirks while sipping vodka. 🍷😏
Meanwhile, we’re stuck dealing with KYC, banks blocking our withdrawals, and regulations changing every five minutes, while Putin is out here trading like a Wall Street shark. And us? Just trying not to get wrecked by the market.
TECHNICAL ANALYSIS - BITCOIN’S MAZE
📈 General trend: Still bullish, but with the emotional stability of a trader on 50x leverage in a pump & dump. 🎢
📌 Current price: 83K
📌 Key level: 84K, possible bearish rejection.
📌 Warning! It might push up to 87-86K to grab liquidity before pulling a textbook dump.
📌 Fun fact: If it closes above 87K on a higher timeframe, we could see a bullish reversal signal. Otherwise, grab your helmet, because we’re going down. 🪂
PRICE TARGETS
📉 Bearish targets:
1. 80.140K
2. 76.600K
3. 74.000K
4. 70.000K
5. 66.000K (if we hit this, light a candle for crypto) 🔥
📈 Bullish targets:
1. 86.700K
2. 89.000K
3. 92.000K
4. 95.000K
5. 102.000K (if we get there, big party and we all buy a Lambo… toy version) 🚗
If you enjoyed this analysis, support PipGuard , because financial information served with sarcasm and expertise is the only kind worth reading. Follow, boost, and comment, or I’ll send you a chart with invisible candles on a white background. 🎭
Until next time, may volatility be with you!
PipGuard 🚀

Secure profits of SHORTBitcoin (BTC) Market Analysis – March 10, 2025
Chart Overview & Key Insights
This is a daily timeframe BTC/USDT chart on Bybit, showcasing a confluence of indicators including the BitcoinMF PRO signals, standard error bands (not Bollinger Bands!), Fibonacci levels, and support/resistance zones. Below, the Fisher Transform indicator is displayed for trend confirmation.
🔍 Current BTC Price Action & Key Observations
Price: $79,404 (-1.60%)
BitcoinMF PRO last short signal hit take profit (TP) → This often results in buy pressure as shorts take profits and exit, creating demand.
A new short signal is forming, but it’s in a riskier position:
Shorting too late into a move can be dangerous, as the market tends to reverse to hunt late shorts.
Price is already near key support zones (~$80,133 and lower at $73,240).
Linear Regression (LR) Channel: Price is currently testing the lower boundary, which often acts as support.
Volume Analysis: Increasing red bars show strong selling pressure, but potential buyer defense near key levels.
📉 Fibonacci & Support/Resistance Levels
🔻 Key Supports:
$80,133 (Short-term support)
$73,240 (Stronger support)
$65,485 (Major support)
🔺 Resistance Levels:
$86,163 (First target if price rebounds)
$92,957 (Major resistance)
🛠 Fisher Transform Indicator (Bottom Panel)
The Fisher Transform is deep in the oversold zone, which historically indicates a high probability of reversal.
If the blue line starts turning upward, it can indicate a bounce incoming.
Right now, Fisher is at extreme levels, meaning that while more downside is possible, a reversal could be forming soon.
📉 CME Gap Around $70K – What It Means
CME gaps occur when Bitcoin futures on the Chicago Mercantile Exchange (CME) close for the weekend and reopen at a different price.
A well-known market phenomenon is that Bitcoin tends to "fill" these gaps over time.
There is a gap in the $70K region, meaning Bitcoin may be magnetized toward that level before a major reversal.
🔍 How This Affects the Current Market?
Current BTC Price: $79,404
CME Gap Zone: $70,000–$72,000
Major Support Zones: $73,240, then $65,485
🛠 Possible Scenarios
1️⃣ BTC moves down toward $70K to fill the CME gap before bouncing.
This is a logical move, especially as Bitcoin is already in a downtrend.
Traders should be cautious of a liquidity grab below $73K.
2️⃣ If BTC doesn’t drop immediately, a short squeeze could come first.
Many late shorts have entered the market (as seen in open interest data).
A squeeze up to $86K– GETTEX:92K could trap them before Bitcoin eventually moves down.
📊 CME Gap Probability in the Current Context
🔹 Likelihood of BTC filling the $70K CME gap: 8/10
🔹 Before that, BTC could see a bounce (short squeeze): 7/10
🧠 What’s the Next Most Probable Move?
📊 Probability Scale (1-10)
Next Move Probability: 7/10 for a bounce before further downside
📉 While BTC is in a downtrend, several factors indicate that shorting now is riskier than before:
Last BitcoinMF PRO short hit TP → Buy pressure from short profit-taking.
Extreme oversold Fisher Transform.
Price sitting near critical support ($80K zone).
🔹 Possible Scenario:
Short squeeze to $86K before any further drop.
If $86K gets rejected → A continued downtrend to FWB:73K or lower.
📢 Conclusion & Trading Strategy
If you are short: Secure profits or set a tight stop-loss in case of a short squeeze.
If you are long: Look for signs of Fisher Transform turning up before entering.
Shorting here is riskier as the market may hunt late shorts before going lower.
⚡ Watch for a relief bounce! While more downside is possible, liquidity grabs often happen before continuation moves. Be strategic with stops and TP zones.
📜 Ancient Wisdom – Patience & Timing in Trading
There’s an old Jewish saying:
"Gam zu l'tovah" – "This too is for the best."
A great trader, much like a wise man, waits for the right moment instead of rushing into moves impulsively. If the market is preparing a short squeeze, traders who chase shorts too late may find themselves trapped. Timing is everything.
🔹 BitcoinMF PRO users caught this downtrend early – consider using it for future trades!
🚀 Get it on TradingView today! 🚀

Vine trade update!BYBIT:VINEUSDT.P
So, vine made the bottom I suspected and took the turn... so now I would be looking to snipe my entry also as you can see these bars are on the 4HR charts therefore there should be more than enough time to snipe with ease on the 15M... the charts don't stop. trades are there all day every day it's just on you.
either way I'm doing what I said!
Build a system that you believe.

BRIEFING Week #10 : Dollar reversed, WTI may be nextHere's your weekly update ! Brought to you each weekend with years of track-record history..
Don't forget to hit the like/follow button if you feel like this post deserves it ;)
That's the best way to support me and help pushing this content to other users.
Kindly,
Phil

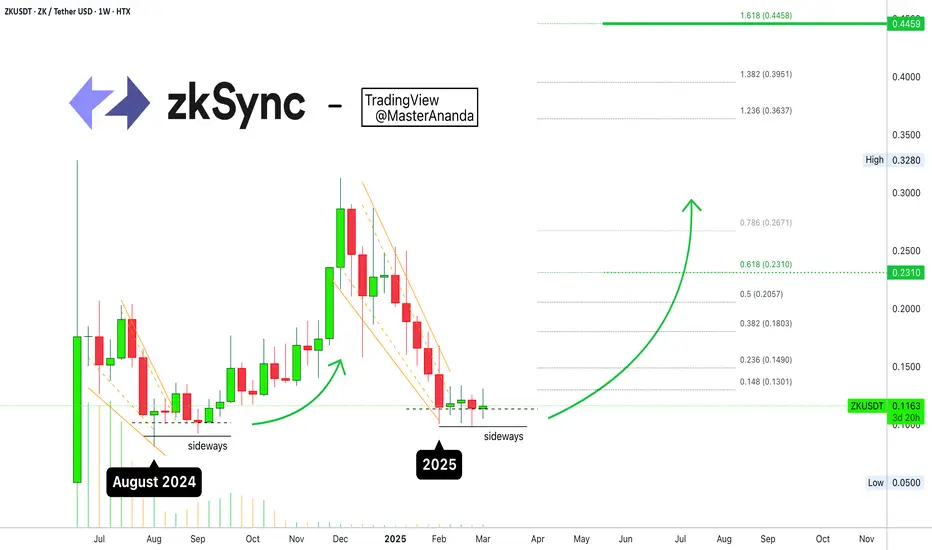
zkSync Hits Bottom: Trading Basics & Bull-Market TheoryFour weeks sideways after a major flush? This type of action gives it all away. It gives away the fact that the market is no longer bearish because the action changed from straight down to null, sideways. It is likely to change from sideways to up.
Look back to August 2024, it is the same all over again. Watch. zkSynch (ZKUSDT) went down, stopped falling to move sideways for several weeks. This was followed by a strong bullish wave.
We have the drop in 2025 and the sideways action, what follows?
Bitcoin is going up, the Altcoins will do the same.
The same volume signal is present here as well, the one we saw on the LayerZero chart. While bearish and neutral action is happening, trading volume is really low. This means that no real participants are present, the chart is being drawn by trading bots. Just watch. When prices start to go up, volume will go up as well. This is the signal that people are buying, and only now the price is great.
Buy at support. Buy at the bottom. Buy when red. Buy when prices are low.
Accumulation at support and then hold.
When the market is green, hype, high and up; that's the time to consider taking profits because the bull-market ends at the top. A bull-market starts at the bottom, that's when the market is bullish, when prices hit bottom and the oscillators start to read oversold. Oversold oscillators, bottom prices and positive news show up. These are the early signals pointing to a market reversal and change of trend. This what we call bullish and we are bullish now. Here we just need the initial bullish breakout for confirmation and the bulls are in.
When the oscillators hit overbought, everything is green and the market is hitting new All-Time Highs but negative news start to show up, this is a sign of overheating and surely what follows is a long-term drop. That's why I say the best time to buy is when prices are low. Sorry if this is too basic, but we start from scratch and get into the complexity as the bull-market develops.
First we buy and hold. Later we will consider different trading strategies, leveraged trading and so on. But first, spot trading, zero risk and a high potential for rewards.
Namaste.
BRIEFING Week #9 : Is this just a Bad Dream ?!Here's your weekly update ! Brought to you each weekend with years of track-record history..
Don't forget to hit the like/follow button if you feel like this post deserves it ;)
That's the best way to support me and help pushing this content to other users.
Kindly,
Phil

BTCUSD: Bearish Pattern Meets Bullish Liquidity – What’s Next?
📉 Bearish Outlook on LTF
On the 12H timeframe, a Head & Shoulders pattern is in play, with a projected target of $59,117.99 . This level aligns perfectly with the liquidity zone on the 4D chart, making it a key area of interest.
📈 Bullish Outlook on HTF
If buyers step in at this liquidity zone ($58,890.48) , BTC could see a second retest of the higher timeframe range before potentially reclaiming bullish momentum toward $146,750.87 .
🔍 Smart Money Perspective:
- A breakdown to GETTEX:59K confirms the Head & Shoulders pattern.
- A strong reversal from liquidity could turn this move into a second retest , fueling a long-term uptrend.
🎯 What’s Next?
Are we seeing a bearish continuation or the foundation for a massive reversal? Share your thoughts below!

BTC/USDT Technical Analysis – Rounding Top Breakdown 🔹 Asset: Bitcoin (BTC/USDT Perpetual Futures)
🔹 Timeframe: 1D (Daily)
🔹 Exchange: MEXC
📊 Market Overview:
Bitcoin has formed a rounding top pattern, a classic bearish reversal structure, leading to a strong downtrend. The price has recently broken below key support levels, indicating further downside pressure.
📉 Key Technical Factors:
✅ Rounding Top Formation: The gradual loss of bullish momentum followed by an aggressive sell-off confirms a trend reversal.
✅ Accelerating Downtrend: Angled resistance lines highlight the declining bullish strength, with negative slope angles reinforcing downward momentum.
✅ Critical Support Zone: BTC is currently testing a key support area (~$74,000 - $72,000). A breakdown below this level could accelerate the decline.
📌 Potential Trade Setups:
Bearish Scenario: If BTC breaks below the $74,000 support zone, we could see further downside towards $70,000 or even $65,000 in the short term.
Bullish Reversal: A strong bounce from the current support level with increased volume could invalidate the bearish outlook, pushing BTC back toward $90,000+ resistance.
🔥 Conclusion:
Bitcoin's structure is bearish, with the rounding top pattern playing out as expected. Traders should watch for a confirmed support breakdown or bounce to determine the next move.
🔔 Manage risk and stay updated for further developments! 🚀

DOT/USDT Technical Analysis – Potential Breakout Ahead🔹 Asset: Polkadot (DOT/USDT)
🔹 Timeframe: 1D (Daily)
🔹 Exchange: Bybit
📊 Market Overview:
DOT/USDT has been trading within a well-defined descending parallel channel, indicating a prolonged downtrend. However, recent price action suggests a potential trend reversal fueled by bullish signals.
📈 Key Technical Factors:
✅ Break of Structure (BOS): The price has started to break key structural levels, signaling an early shift in momentum.
✅ Strong Hammer Candle Formation: A bullish hammer appeared at the lower boundary of the channel, indicating buying pressure and potential bottoming out.
✅ Mini & Major Change of Character (ChoCH): A breakout above the mini ChoCH ($6.00) would confirm an early bullish reversal, while a move above the major ChoCH ($7.00) would solidify the bullish trend.
🎯 Potential Trade Setup:
Bullish Scenario: If DOT/USDT breaks out of the descending channel and successfully flips resistance into support (~$6.00), it could push towards $7.00 - $9.00 in the coming weeks.
Bearish Scenario: If the price fails to break out and gets rejected at resistance, we may see a retest of the lower levels (~$4.00 - $4.50) before a stronger move.
🔥 Conclusion:
DOT/USDT is showing promising signs of a trend reversal, but confirmation is needed above key levels. Watch for breakout confirmation and volume surge to support the bullish momentum.
🔔 Stay updated & manage risk accordingly! 🚀
#DOT #Polkadot #Crypto #Trading #TechnicalAnalysis

AGi/USDT IT"S TIME FOR THIS CYLCE COIN TO MOON NO 1 - Moon coinAGi/USDT IT"S TIME FOR THIS CYCLE COIN TO MOON NO 1 - Moon coin
can show interesting targets.
There is silent whale building on this coin since the breakdown

BRIEFING Week #8 : Risk-Off move this weekHere's your weekly update ! Brought to you each weekend with years of track-record history..
Don't forget to hit the like/follow button if you feel like this post deserves it ;)
That's the best way to support me and help pushing this content to other users.
Kindly,
Phil

TOSHI is testing the red resistance zone$TOSHI is testing the red resistance zone 🟥. If it breaks out, the first target is the green line level 🟩.
