Cardano Update · Straight Up · New ATH & MoreCardano is easy to predict. We already have three great examples. Remember Bitcoin Cash? It has been growing straight up for 100+ days. Cardano will do the same. What about XRP? It is already trading at new all-time highs and Cardano is in the same group/category; big market capitalization. Then we have Ethereum which is the most recent example, as predicted, it is moving straight up. No retrace nor correction which is normal because it went sideways for months before the current bullish breakout.
Cardano has now four green weeks and this is the fifth one. This one will not be red which means straight up.
Technical analysis
I already told you about EMA55 and EMA89, weekly timeframe, ADA is trading above. MA200 as well. Notice the descending triangle on this chart. This was the consolidation period and it already broke bullish.
Targets & new all-time high
Expect ADA to continue growing until it hits the highest prices since 2021. $1.83 and beyond. Once this level is conquered, we can start rooting for a new all-time and this will happen with a high level of certainty.
Cardano will easily reach $3 and move beyond $4. I think it can go much higher...
I will do a new publication with updated new all-time high projections. The targets above are valid for the coming months.
Just a friendly update.
And thank you for your continued support.
(If you enjoyed this post, follow!)
Namaste.
Crypto

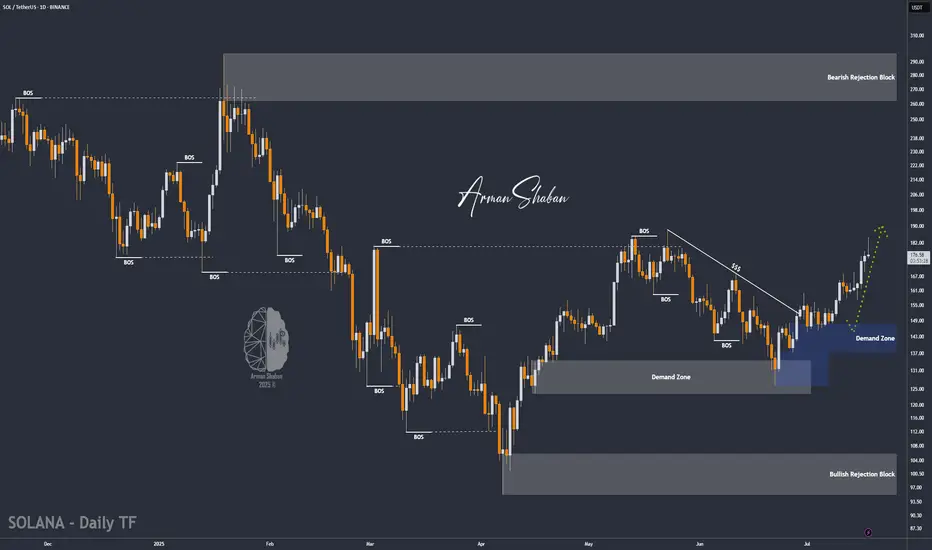
SOL/USDT | Next Bullish Leg Ahead if Key Support (READ)By analyzing the Solana chart on the daily timeframe, we can see that today the price climbed to $184, almost hitting the next target at $187, before facing a correction. It is currently trading around $176. If Solana manages to hold above the key support zone between $168 and $174, we can expect the next bullish leg to start, potentially extending up to $227. The previous analysis remains valid, with the next upside targets at $187, $220, and $263.
Please support me with your likes and comments to motivate me to share more analysis with you and share your opinion about the possible trend of this chart with me !
Best Regards , Arman Shaban
DOGE/USDT : eyes More Gains – Mid-Term Targets Up to $0.70! By analyzing the Dogecoin chart on the daily timeframe, we can see that since our last analysis around 7–8 months ago, the price started its rally from $0.10 and surged over 370% to reach $0.48. After that, it corrected back to around $0.13 and is currently trading near $0.27. If Dogecoin manages to hold above $0.25, we can expect further upside movement in the mid-term. The next targets are $0.287, $0.32, $0.41, and $0.70.
Please support me with your likes and comments to motivate me to share more analysis with you and share your opinion about the possible trend of this chart with me !
Best Regards , Arman Shaban

BTC/USDT LONG SET UP (BITCOIN)Entry Price 1: $118,000
Entry Price 2: $116,500
Stop Loss: $115,000
Take Profit 1: $121,000 (Close 25%)
Take Profit 2: $124,000 (Close 50%)
Take Profit 3: $127,000 (Close 75%)
Take Profit 4: $130,000 (Close 100%)

APT - APTOS Coin - Swing Long Idea📌 Fundamental Sentiment:
The entire crypto market is rallying, alongside other risk assets. This momentum is largely driven by U.S. policy expectations — specifically, Trump’s increasing pressure on Powell to resign and aggressively push for rate cuts from the Federal Reserve.
📌 Technical Analysis:
Price is currently testing the HTF supply zone with strong momentum. Additionally, it’s approaching a long-term bearish trendline that has dictated the downtrend since February 2025.
📌 Gameplan:
I want to see:
A clean breakout above the HTF supply zone with daily candle closure.
A confirmed break and close above the HTF bearish trendline on the daily timeframe.
If both confirmations align, I’ll start preparing for swing long setups, potentially riding into the early stages of a 2025 altseason.
—
🔔 Like & Follow for more daily updates. Feel free to drop your thoughts in the comments!
$PENGU: Taking Profit and Watching for a TurnIf you find this information inspiring/helpful, please consider a boost and follow! Any questions or comments, please leave a comment!
PENGU has made a strong move off the 0.007 level, now it just popped cleanly out of consolidation beneath the key LOI at 0.032. That break gave us the signal we needed for continuation, and so far, the price has followed through nicely.
But now, we’re approaching a zone where things could get a bit trickier.
This advance is starting to look like a classic wave 3 impulse, and while there’s no clear confirmation of a top yet, signs are beginning to flash caution. That means it’s time to start watching for potential topping behavior—especially if we move into a broader consolidation phase.
Here’s what’s on my radar:
• Wave 3 Exhaustion?
Still unconfirmed, but this could be the final leg of the wave 3 structure.
• AOI or Key Level Rejection
A stall or strong reaction near resistance could be a red flag. Channel parallel being reached.
• Bearish Divergence on the EWO
Momentum isn’t keeping pace with price. That’s often a precursor to a deeper pullback.
No need to force the next move here. This thing could just keep ripping up, but I am being extra cautious here. Not only to look for a potential top, but if a retrace is given, a potential long add to my current trade. Taking profit at these levels makes sense, especially given the early entry from 0.012 and my trade plan.
As always, trade what’s printed, not what’s hoped for. Stay nimble.
Trade Safe!
Trade Clarity!

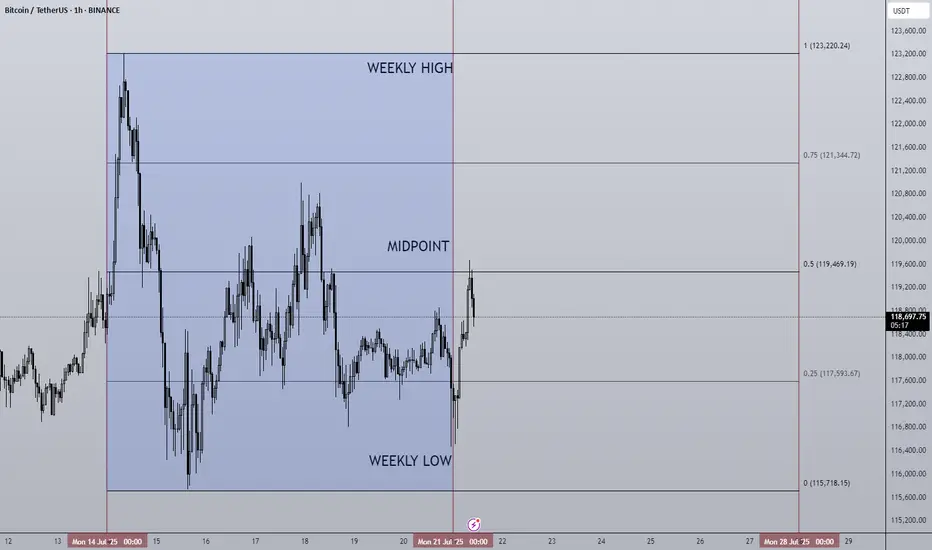
21/07/25 Weekly OutlookLast weeks high: $123,220.24
Last weeks low: $115,718.15
Midpoint: $119,469.19
New BTC ($123,220) & SPX ($6,315) ATH last week! We're really seeing progress being made on all fronts now, bitcoin saw its sixth week of net inflows into BTC ETFs ($2.39B).
The week began strong hitting the new ATH very early and then settled into a tight range to cool off. Altcoins however surged in relation to BTC to break out of HTF downtrends and begin to make up lost ground. One of the beneficiary's of this price movement has been ETH, breaking out from a multi year downtrend against BTC and hitting $3,800 in its USD pair.
For this week I do expect much of the same for BTC as momentum is with altcoins for now. However, as those altcoins reach HTF resistance levels it becomes very important for Bitcoins chop to be accumulation for the next leg up and not distribution for the way down. With so few pullbacks the threat of a sudden correction is present but the probability drops should BTC look to press higher with strong demand.
The ECB Interest rate decision takes place on Thursday but no changes to the 2.15% rate is forecast. In terms of news there are no planned upsets that I can see.
Good luck this week everybody!
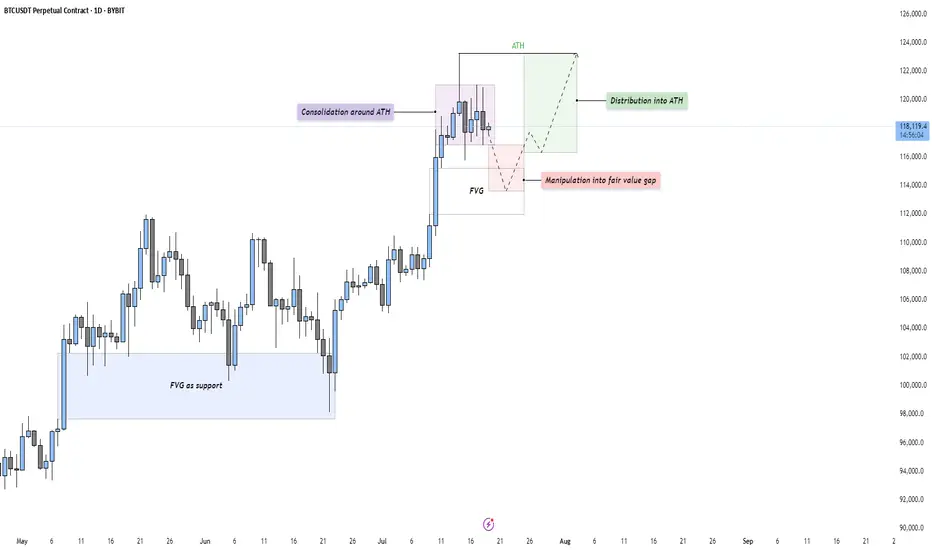
BTC - Consolidation, Manipulation & DistributionMarket Context
After a strong impulsive rally, Bitcoin is currently consolidating just beneath its All-Time High (ATH). This type of consolidation following an extended move higher often indicates indecision in the market — a pause that either leads to continuation or reversal. The current structure suggests that price is building energy for the next leg.
Consolidation and Liquidity Above ATH
The price action is tight and sideways around the ATH, which likely means liquidity is building above. Many stop-losses and breakout orders are sitting just overhead — classic conditions for a Buy Side Liquidity Sweep. This range may serve as a trap for early breakout traders, providing an opportunity for smart money to manipulate price lower before taking it higher.
Fair Value Gap Retest Scenario
Below the current range, we see a Daily Fair Value Gap that aligns with prior bullish imbalances. A move down into this Gap would represent a manipulation phase — shaking out weak longs before rebounding. The Gap also acts as a potential support level where buyers might be waiting. If price reaches into this zone and reacts strongly, it may offer a high-probability long setup.
Distribution or Reaccumulation?
While this could be interpreted as distribution beneath resistance, it’s equally valid to consider it a reaccumulation phase — a temporary markdown into demand before a fresh expansion. If the market dips into the Gap and quickly reclaims the range, it opens the door for a clean breakout above the ATH and continuation toward the 124,000–126,000 region.
Final Thoughts
Price rarely moves in a straight line. It pauses, retraces, and often tricks participants before making the real move. This type of consolidation presents opportunity — but also demands patience and clarity.
If you found this breakdown insightful, a like would be much appreciated! And I’d love to hear your thoughts in the comments — are we about to sweep down into demand, or is the rocket already on the launchpad?
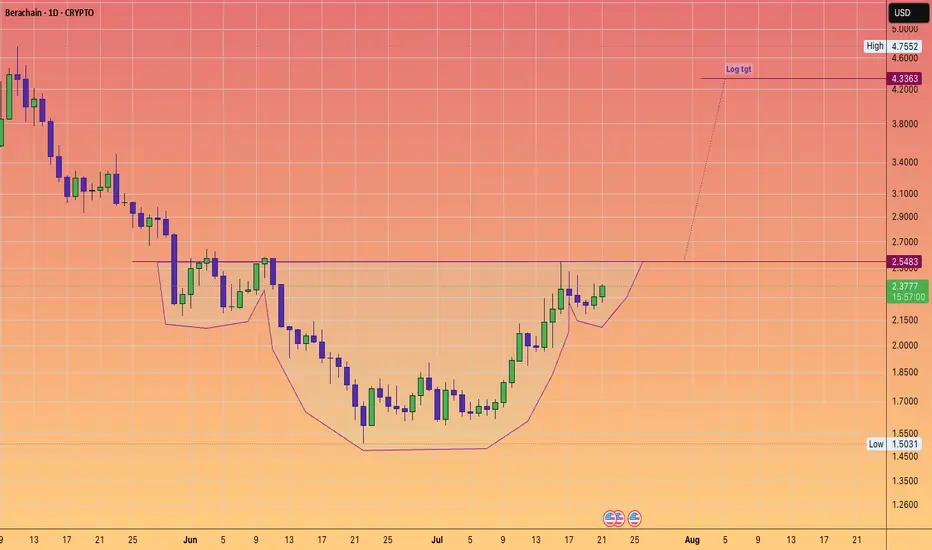
Berachain MOGGING the bears! Back to over $4#InverseHead&Shoulders
clean setup
log tgt provided.
sorry its altseason 100 things going on
no lengthy description needed :)
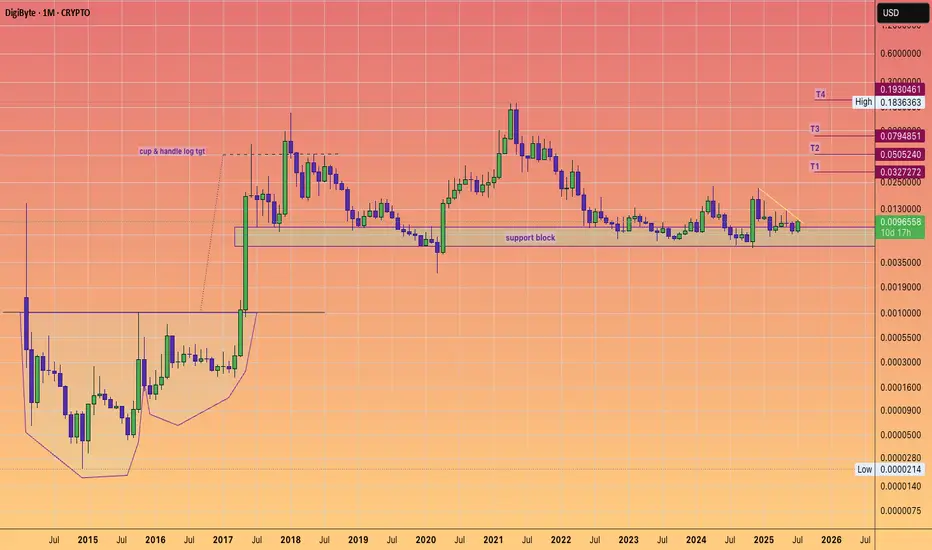
Digibyte $DGB Breakout watch. Bullish surge ahead?Digibyte appears to be reawakening, and a long accumulation phase appears to be ending.
If we scroll back to the beginning of the chart we can see the massive cup and handle and the subsequent moonshot to 5 cents.
I think 5 cents will also come back into play, in these coming weeks and months a healthy 5X.
As we know technically Digibyte is known for speed and decentralisation and UNDERvaluation.
Their much loyal supporter base deserve another moon mission.
Bitcoin monthly RSI CYCLEEvery time Bitcoin peaked in previous cycles, its monthly RSI exceeded 90. In this cycle, the RSI hasn't surpassed 75, but I expect a breakout through 75 to at least 86 in the coming months.

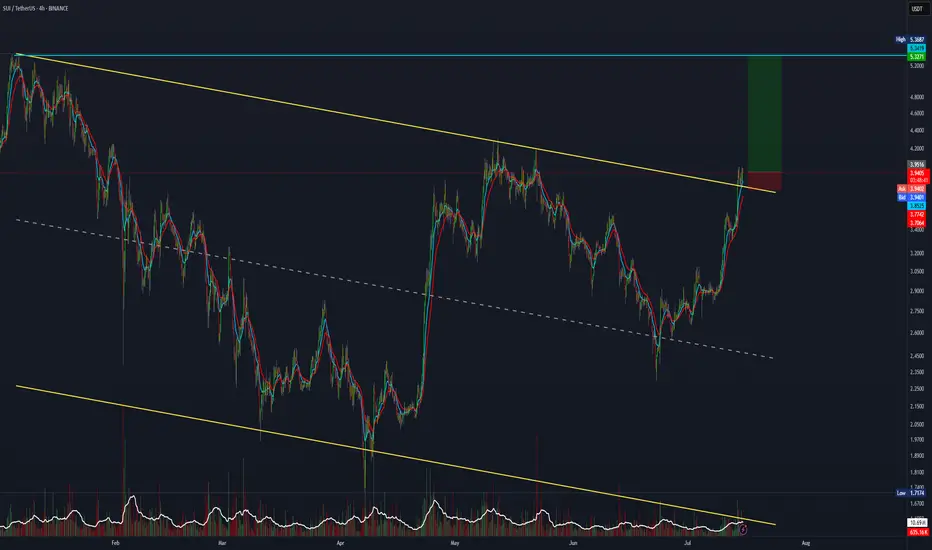
SUI trade setup with a 7:1 risk-to-reward ratio.SUI has broken out and retested the major channel. If you're bullish, this 7:1 R:R setup is worth considering.
Entry: 3.94
Stop Loss: 3.77
Target: 5.30.
20:1 R:R for SolanaTaking a chance on this super high-risk setup with a 20:1 R:R before it takes off.
Entry: 177.78
Stop Loss: 173
Target: 260

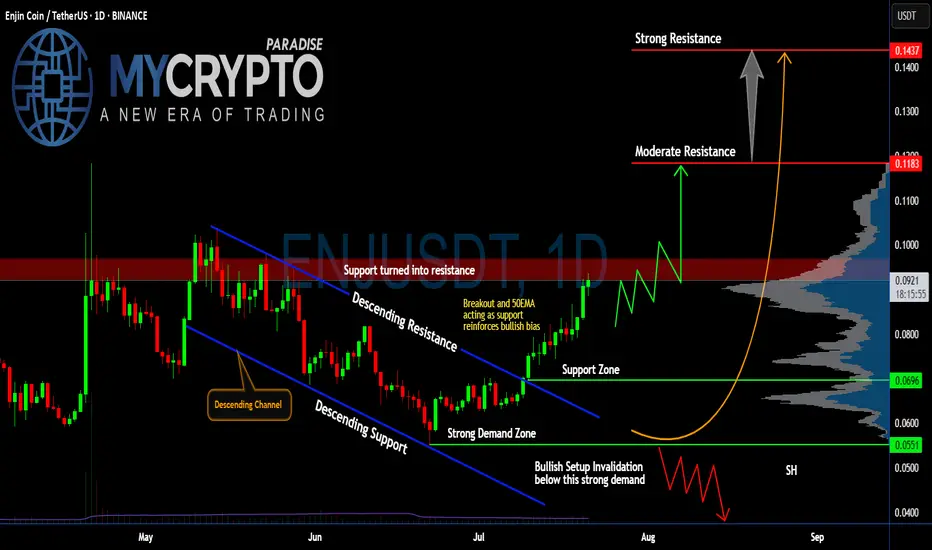
Will #ENJ Soar Further or a Trap is Set Ahead? Watch Closely Yello, Paradisers! Is this breakout on #ENJUSDT the start of a strong bullish reversal, or just another trap before a brutal flush to shake out late buyers? Let’s break it down:
💎After weeks of bleeding inside a clear descending channel, #EnjinCoin has finally broken out of the descending resistance, showing the first real bullish momentum in a while. Price is currently trading around $0.0917, with the 50EMA now acting as fresh support—this adds weight to the bullish bias for #ENJ.
💎If bulls can break above the resistance zone (previously support) between $0.091 and $0.096, we could see a push toward the moderate resistance at $0.1183. That’s the first major hurdle where sellers are expected to step in. A clean breakout above this level would open the door for a larger move toward the strong resistance at $0.1437, where a heavy supply zone sits, and profit-taking will likely accelerate.
💎The strong demand zone between $0.0551 and $0.0696 has been respected multiple times in the past, with aggressive buying every time price dipped into it. This is classic accumulation behavior, which often precedes stronger impulsive legs up—if volume keeps supporting this move.
💎But don’t get trapped, Paradisers. If the price breaks back below $0.0696 and especially loses the strong demand at $0.0551, the bullish setup for #ENJUSD will be invalidated. That would likely trigger a deeper correction, pushing us back toward $0.04. We’ll wait patiently for the next high-probability setup before taking any new positions.
Stay patient, Paradisers. Let the breakout confirm, and only then do we strike with conviction.
MyCryptoParadise
iFeel the success🌴
SUPER Breakout Incoming or Just Another Trap Before the Flush?Yello, Paradisers is SUPER about to explode out of this structure, or are we being lured into a fakeout before the next rug pull? This setup is too clean to ignore, and the next few candles will tell us everything.
💎The daily chart on #SUPERUSDT reveals a well-respected descending channel that has dictated price action for over two months. After multiple rejections from the upper boundary and rebounds off the lower trendline, the price has now shown its first serious signs of momentum since bottoming in the strong demand zone around $0.45–$0.50. This zone has held firmly, marking the third time price has bounced from this key level a textbook area of interest where buyers consistently step in.
💎What's notable here is the confluence between the demand zone and the descending support line. The most recent bounce was not only from this dual-support area, but also accompanied by a shift in momentum that has pushed the price back toward a critical inflection point the resistance-turned-support zone at $0.58–$0.62. This level has acted as resistance before and now becomes the level to reclaim for the bullish scenario to stay valid.
💎If the price breaks and closes above the upper boundary of the descending channel and holds above the $0.60–$0.62 region, the path opens toward the moderate resistance at $0.75. Should bullish momentum continue, we could be looking at a retest of the psychological and historical strong resistance zone near the $1.00 mark where we’d expect both aggressive profit-taking and liquidity to build up.
💎On the flip side, any failure to break out and sustain above the current resistance would likely send price back down to retest the demand zone. If the structure gives in and closes below $0.45 on the daily timeframe, this would invalidate the bullish thesis completely and could trigger a sharper drop toward $0.35 or even lower as the broader market liquidates over-leveraged longs.
MyCryptoParadise
iFeel the success🌴

OFFICIAL TRUMP Last Barrier · $30 or $100 Next · MixedThe last barrier is on now. The last barrier as in the last and final resistance level TRUMPUSDT (OFFICIAL TRUMP) needs to conquer before a major rise. Will this rise reach $30 or $100 or higher? Continue reading below.
Make sure to boost this publication and follow to show your support.
Hah! Resistance is confirmed as EMA89, what a drag. This is the blue dotted line on the chart but notice something else. Look at the magenta line, EMA55. TRUMPUSDT is trading above EMA55 but below EMA89. Bullish and bearish. Bearish and bullish. Mixed?
There is nothing mixed.
The main low happened 7-April. A higher low in 22-June. Can you see?
This is not mixed, this is bullish confirmed.
If the market were to move lower, then in 22-June we would have either a test of the 7-April low or a lower low. The fact that the drop stopped higher means that buyers were present. People were actually expecting for prices to drop and once they dropped they bought everything that was being sold. Prices couldn't move any lower because people were buying up. These are smart trader, smart money; experience for sure.
They managed to buy some tokens at a lower price within the "opportunity buy zone." This zone is available no more and now we have the mix of resistance and support; EMA89 and EMA55. What happens next?
Based on the previous signal I just showed you and marketwide action, Bitcoin super strong, we know that TRUMPUSDT will follow and break-up. Yes! Massive growth.
Both targets are good and will hit. Short-term, we will see a challenge of $30 and long-term we will see $100 and beyond.
Thanks a lot for your continued support.
Namaste.

Enjin Coin Ready for a Truly Major Advance · PP: 941%Technical analysis is truly an exact perfect science, when mastered. If you master this tool you can use it successfully to make very strong and accurate predictions.
If you can make one prediction right, then the tool works.
If you can make several correct predictions, then the tool being valid is confirmed.
If some predictions fail, we have to assume our interpretation is wrong rather than the tool. If the tool is the one at fault, then all predictions would be either wrong or random. And since we can make thousands of highly accurate predictions, it means the tool works.
Back in late 2024 ENJUSDT was rejected twice at EMA89 resistance. As soon as it broke above this level it produced a strong advance. This wasn't enough and the market moved lower. As it reached a major low point in April and June 2025, the same conditions showed up.
ENJUSDT was rejected twice below EMA89 as resistance, notice the red arrows on the chart. Currently, Enjin Coin managed to conquer EMA89 and this is bullish. Looking at past history and knowing what we know about EMAs, this means that the doors are open for a strong bullish wave.
Enjin is set to produce a major advance and this is already confirmed. Just like late 2024 but much stronger, prices will go much higher because we are in the year of the bull market, post Bitcoin halving, every four years. Marketwide growth is happening and will only increase. This pattern has never been broken, it is already happening, it is confirmed and guaranteed.
Namaste.

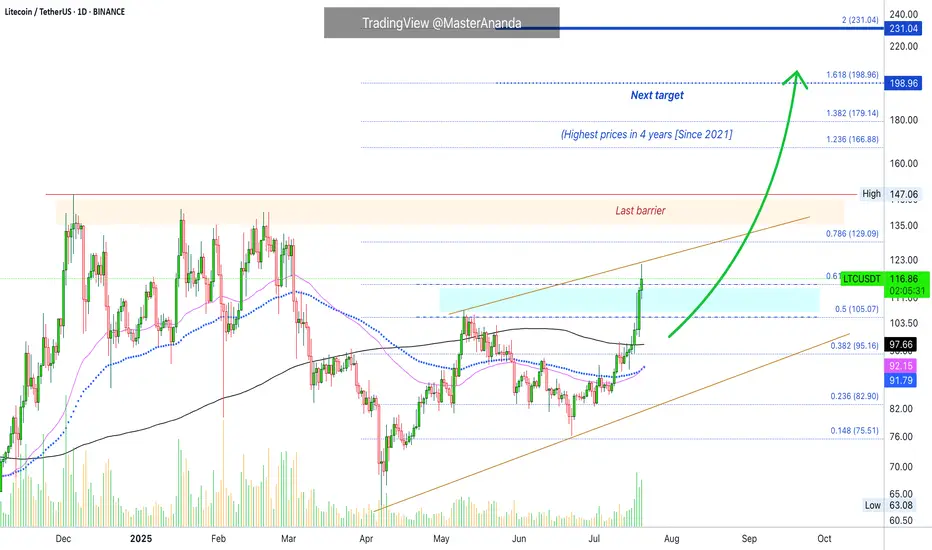
Litecoin's Path Beyond $200 Revealed · Daily TimeframeWe looked at Litecoin on the weekly timeframe which is the long-term picture, but we also need to consider the daily to see what is happening up-close.
As soon as we open this chart we have three signals that stand out:
1) Litecoin is now trading above MA200 safely and rising. This is a very strong bullish development and supports additional growth.
2) Trading volume has been rising significantly being now the highest since February 2025. The difference is that in February we were in distribution, resistance being confirmed with prices set to move lower. In this case, the action is rising from support and volume is rising rather than dropping.
3) May's peak has been broken. Many pairs are still trading below their high in May. Those that broke this level are the ones moving first and this signal exudes strength. Litecoin is now one of the top performers specially in the group with a big market capitalization.
The next barrier is the December 2024 high at $147. Short-term the next target is $129. As soon as the former breaks, we are going to be looking at the highest price since 2021.
Litecoin is fighting resistance today, 0.618 Fib. extension at $115. It is trading above this level but the confirmation only happens at the daily close. If it closes above, bullish confirmed. It if closes below, it means that there will need to be some struggling before higher prices. This struggling can last a few days just as it can extend. Seeing Ethereum and how it is moving straight up, Litecoin is likely to do the same.
Overall, conditions are good for Litecoin on the daily timeframe.
Thank you for reading.
Namaste.
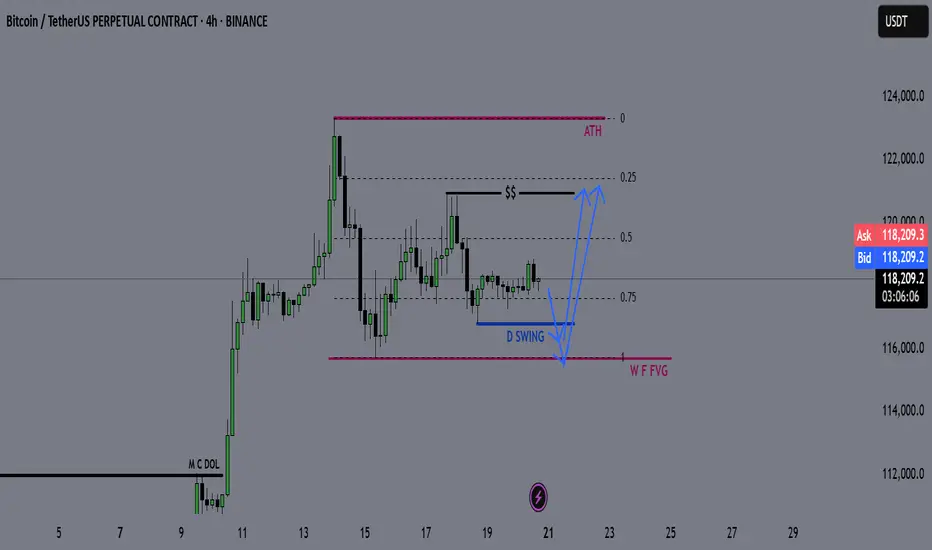
BTC Weekly Recap & Outlook 20/07/2025📈 BTC Weekly Recap & Outlook
Market Context:
Price continued its bullish momentum, fueled by institutional demand and supportive U.S. policy outlook.
We captured solid profits by following the game plan I shared earlier (see linked chart below).
🔍 Technical Analysis
✅ BTC made a strong bullish move, breaking into new all-time highs.
📊 The daily RSI entered overbought territory, which signaled the potential for a short-term retracement or consolidation.
Currently, price is ranging, and RSI is cooling off. That tells me the market is likely building energy for the next leg up — but not before a significant liquidity run.
🎯 Game Plan
I'm watching for one of two potential setups:
1️⃣ Liquidity Sweep to the Downside
- A run of the daily swing low
- Into the most discounted range (0.75 Fib zone)
OR
2️⃣ Tap into the Weekly FVG Zone (marked with the purple line)
Either move would create the liquidity and energy needed to fuel a breakout above the equal highs (EQHs) marked by the black line.
🚀 Target
First Target: EQHs (Black Line)
Second Target: Price Discovery (new ATHs)
💬 Let me know your thoughts or drop your own chart ideas below!
📌 Follow for Weekly Recaps & Game Plans
If you found this useful, make sure to follow for weekly BTC updates, market outlooks, and detailed trade plans based on structure and liquidity.
ETH 1H – Breakout or Bull Trap ?
ETH just broke above the 0.236 Fib with a strong push.
✅ Trend structure remains bullish:
MLR > SMA > BB Center.
But something feels off...
🔍 Volume surged late — likely short liquidations.
OBV didn’t confirm — it's still lagging.
RSI is extended. Structure looks tired.
Could be a liquidity grab above recent highs.
If price closes back below the Fib, momentum could fade fast.
📌 Key zones to watch on a pullback:
– 1H 50MA
– Previous support clusters
We’ll be here to watch it unfold.
Always take profits and manage risk.
Interaction is welcome.

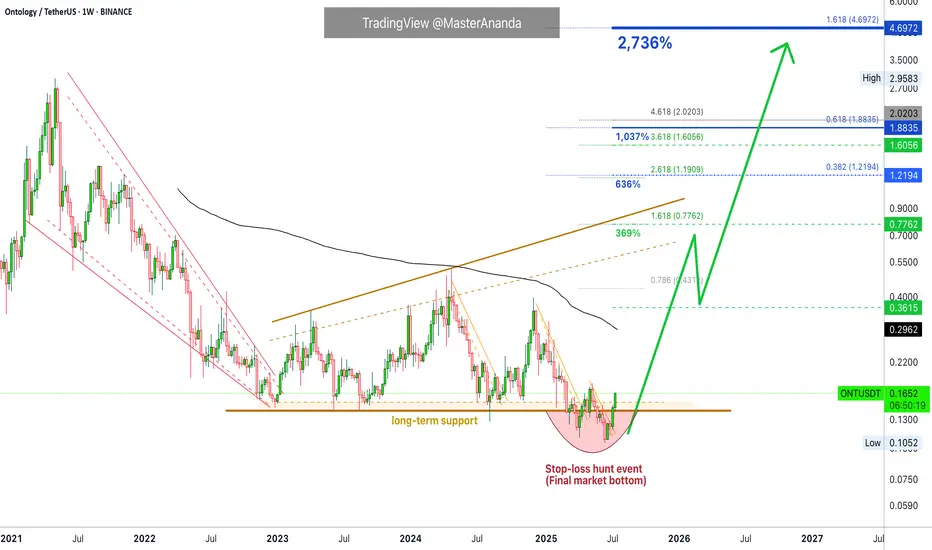
Ontology Back Above Final Bottom · Crypto, The Future of MoneyOntology is now trading back above long-term support. Long-term support was established by multiple lows in 2022, 2023 and 2024. In 2025, ONTUSDT broke briefly below this level. This drop ends up being a "stop-loss hunt event." Once the action recovers above long-term support, the market is confirmed ultra-bullish and ready to grow long-term.
Long-term growth is what you see projected on the chart with targets at 1,000% and even beyond 2,000%. Can be higher of course.
A massive rally is expected because of the prolonged consolidation period. The longer the accumulation phase, the stronger the bull market that follows.
If the market was set to enter a new bearish cycle, instead of a recovery above long-term support we would get a rejection and this rejection would lead to lower lows. Instead, ONTUSDT moved below just to recover. This recovery is all we need to go all-in.
Notice we have two full green candles and we are about to close this week. This is the start of very strong, major bullish action.
Good afternoon my fellow Cryptocurrency trader, how are you feeling in this wonderful day?
The altcoins market continues to heat up but as can be seen from this chart, you've seen nothing yet. Yes, some pairs are really advanced and this is only good because we know the rest of the market will follow.
The sequence goes like this: First Bitcoin moves. Then Bitcoin remains high, strong trading near resistance. This signal is taken by the top 25 altcoins and they start to move forward as well. When the top altcoins move forward and remain strong, the medium sized capital projects then start to grow. Finally, the small size and the rest of the market moves forward.
The previous bear market was brutal.
The last consolidation period is the largest and longest ever.
Fundamental conditions continue to improve.
While Cryptocurrency was considered a crazy innovation, technological porn, things are different now. We have laws and regulations coming out in all the major nations of the world supporting the adoption and development of Crypto. Humanity continues to adapt, grow and evolve.
With a new regulatory framework now in place, it is only a matter of time before Crypto takes over the world. We don't use cash anymore... We use electronic transfers and credit cards; these are also coming to an end.
We will say next: We don't use card anymore, we simply make transfers using our computers and phones. It is more efficient, it is easier and we already have a cell phone so we don't need to hold a card or a bunch of paper to buy stuff.
Crypto is free. Crypto is new. Crypto is accessible. Crypto is young... Oh, and it has amazing room still left available for growth. We can become rich through Crypto.
Thanks a lot for your continued support.
Namaste.
Hedera Update · Keep Holding · No Selling, YetHedera (HBAR) looks awesome. The action and chart right now is one of the best in the market. I love the fact that the candles are moving straight up. This can be equated to how FUN Token (FUN) has been performing in the past month. What one does, the rest follows.
The most interesting signal comes from MA200. Trading is happening above this level and that's all we need to know. When HBARUSDT broke above it, any bullish potential and bullish signals become fully confirmed. It is not a question of "if" anymore but instead a done deal. Growth is expected to happen for a period ranging between 3-6 months once this signal shows up.
This means you can see a strong retrace in a month and still, you remain calm and hold because you know higher prices are still possible. This means that if you see a correction after three months, you can take profits of course but still know that the top is not in. It will take a while before the entire bullish process is complete.
The top is not only calculated based on time duration but also on price levels and marketwide action. Depending on how the rest of the market is doing; looking at Bitcoin and at what price the pair in question is trading can help us confirm if the top is in. For now you just keep on holding.
Each chart/project/pair needs to be considered individually. If your technical analysis ability is lacking, you can always contact me and I will publish an update for you. If you publish news articles, videos, trade-signals or even TA, you can come to me for confirmation, ideas or just inspiration and I will take care of the rest. Once you have your update you can decide what actions to take. It is still early in this game.
The initial portion of the bull market is long gone. Here it started in November 2024, you can see it as the "market bottom." We are on the second portion now in 2025. The year started with a correction and the correction ended in April-June with a very strong higher low. Projects like this one reveal super-strength compared to the rest of the market, it happens with the top 100.
If you consider some of the smaller projects I've been sharing, you see double-bottoms compared to 2024, 2023 and even 2022 and even new all-time lows. Here the low in 2025 is far away from November 2024 and this is good news. That is why I say that each chart/pair needs to be considered individually because conditions are not the same for each project. The market has now thousands of good projects and tens of thousands of trading pairs. It is impossible to say how one will move based on the other because they are just too many and too far away.
The bigger picture and the general bias, yes, bullish all across. Exact resistance and support levels, where to sell, where to buy; should I continue to hold? This is what needs to be considered individually.
Your support is appreciated.
If you enjoyed, please follow.
Namaste.

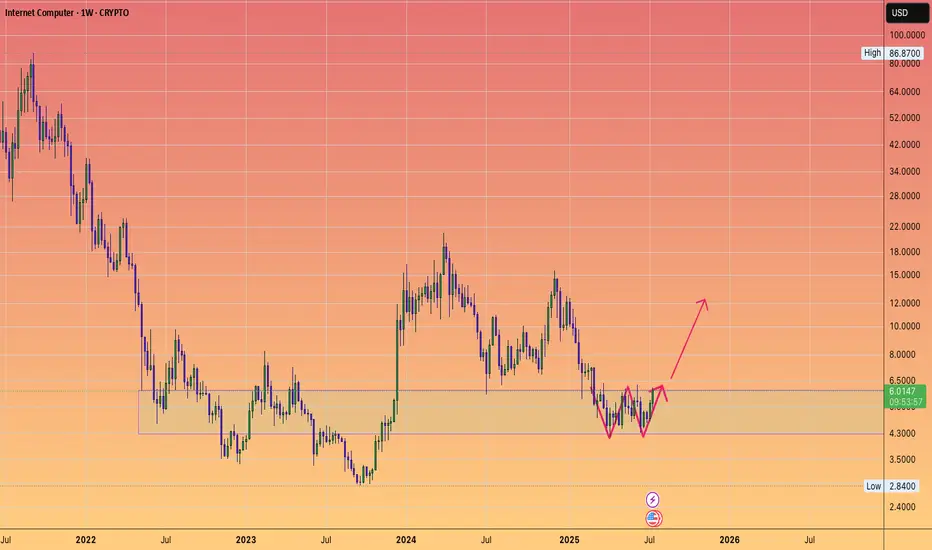
ICP still in the reload support zone....W pattern.
I like it down here.
Low risk accumulation block given the backdrop of #altseason going on.
Enjoy.
;)