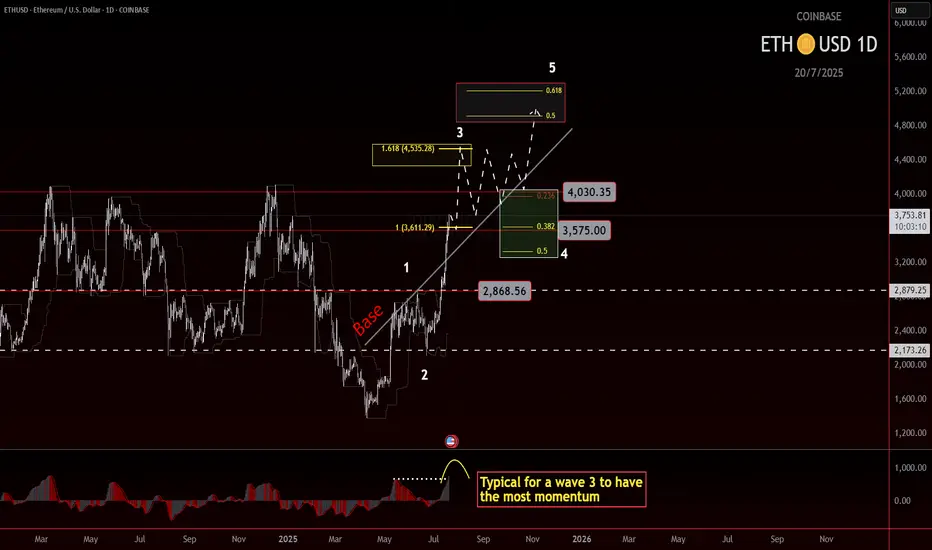
ETH roadmap to 5000!Ethereum Wave 3 in Play? Eyes on the $4500 Target
Ethereum may currently be progressing through a wave 3, which is often the strongest leg of an impulse. The structure so far supports that idea, and based on standard projections, the most likely target sits near $4500.
If price can break and hold above the 4k level, we could see a consolidation forming above the previous high. That would be a constructive sign and might set up the next leg higher.
But there’s still a chance ETH struggles to clear that level. If that happens, consolidation could form just underneath, which would still be acceptable within a wave 3 framework. What matters next is the shape and depth of the pullback.
Wave 4 will be the key. A shallow or sideways correction would keep bullish momentum intact. A deeper pullback doesn't ruin the structure, but it does mean we’ll need to watch support zones more closely.
If wave 4 behaves well and broader market conditions stay supportive, then a final wave 5 could bring ETH into the $5000 region. That’s the upper edge of this current roadmap, based on conservative assumptions.
Stay flexible. Let the structure guide the bias.
Crypto
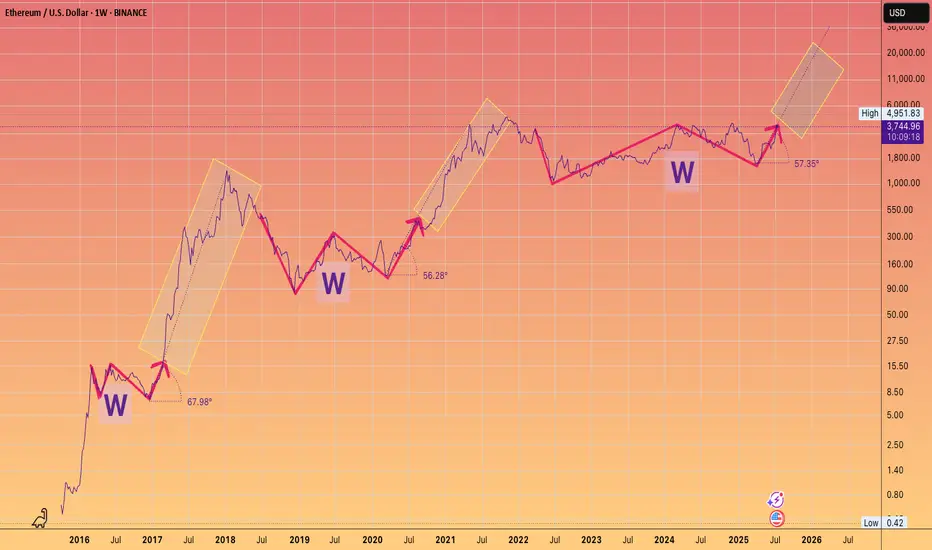
3 Wins to Glory.You guys know my long term Targets for ETH.
What I wanted to highlight is the angle of the Banana zone has been remarkably consistent on the Log chart.
Granted we only have 2 - 2.5 data points
But note how even in 2025 the run is adhering to the approx 60 degree angle of attack, after breaking out of their respective W's.
something to monitor.
Time to Peel Some Gains — BananaUSDT Ripening at the Midline
📈 Technical Overview:
BananaUSDT is currently testing the midline of the descending channel. A confirmed breakout above this level could trigger a bullish move toward the top of the channel, which aligns with our secondary target. Until the breakout is validated, the price may continue to range within the current structure.
🔸 Watchlist Status:
Setup is not confirmed yet — keep this on your watchlist and wait for a clear breakout above the midline.
📍 Next resistance: Top of the channel
📍 Invalidation: Rejection at midline or breakdown below recent support
📉 Risk Management:
Enter only after confirmation, and risk no more than 1% of your capital. Always define your stop-loss.

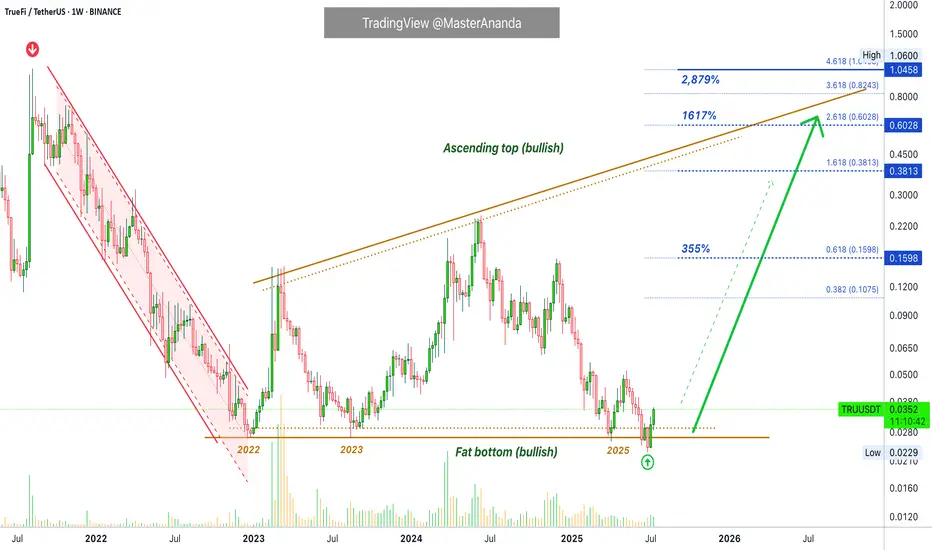
TrueFi · Bitcoin vs the Altcoins · Low Risk vs High RewardsTrueFi is trading at bottom prices. Notice the big difference between this pair and the ones that are trading high, near resistance or at a new all-time high. This is the difference I want to point out to new buyers.
If you are entering the market just now, you should be considering pairs like this one rather than the ones that are already pretty advanced. This is because the ones trading low/near support have more room available for growth, higher profits potential and very little risk. When prices are trading near the bottom, there isn't much room to go lower. When prices are trading high, even with marketwide bullish action, a correction can develop anytime.
We look for pairs like this one to buy and hold.
The second consideration is related to growth potential. While Bitcoin is awesome; Bitcoin is crypto; Bitcoin is great and is here to stay, it is already worth trillions of dollars. If everything goes amazing for Bitcoin, we might enjoy an additional 100% growth before the cycle ends. On an altcoin, in comparison, we can enjoy 1,000%, 2,000%, 3,000%, 5,000% or more. So you need to choose wisely.
A whale can easily choose Bitcoin because of liquidity issues, accessibility, security, stability, accounting, long-term performance, etc. A tiny fish is better off with the altcoins market, they have more room for growth.
Technical analysis
The red channel reveals a downtrend, the previous bear-market. The flat bottom in the following years reveals a consolidation period, long-term. Not a downtrend but creating a base. From the bottom we grow.
TRUUSDT is no longer bearish, moving down, instead it accumulated for years and now that this accumulation phase is over we are ready for massive growth.
We witnessed first a downtrend, then sideways (consolidation) and now comes an uptrend. These are the only three ways in which the market can move. Down—neutral—up.
The logical next step after a downtrend is always a sort of transition period, after this transition the uptrend starts.
We will have an uptrend now, this is what we call a "bull market." Higher highs and higher lows."
If you enjoy the content, you can always follow for more. It is easy and free and you get to receive updates every time I publish a new article.
Thanks a lot for your continued support.
Namaste.
$SHIB Ready to Move?CRYPTOCAP:SHIB has printed confirmed weekly bullish divergence in RSI and is now attempting to overcome the weekly 200EMA resistance.
A High Volume Node lies just above but a close above this will signal a bullish trend ready to move the initial target of the weekly pivot point followed by the 0.0003579 High Volume Node.
Price completed its retracement to the 'alt-coin' golden pocket 0.786 Fibonacci retracement.
Bearish divergence is currently growing on the weekly RSI but will be diverted with a thrust high!
Is it MEME season? CRYPTOCAP:DOGE also looks ready to go!
Safe trading

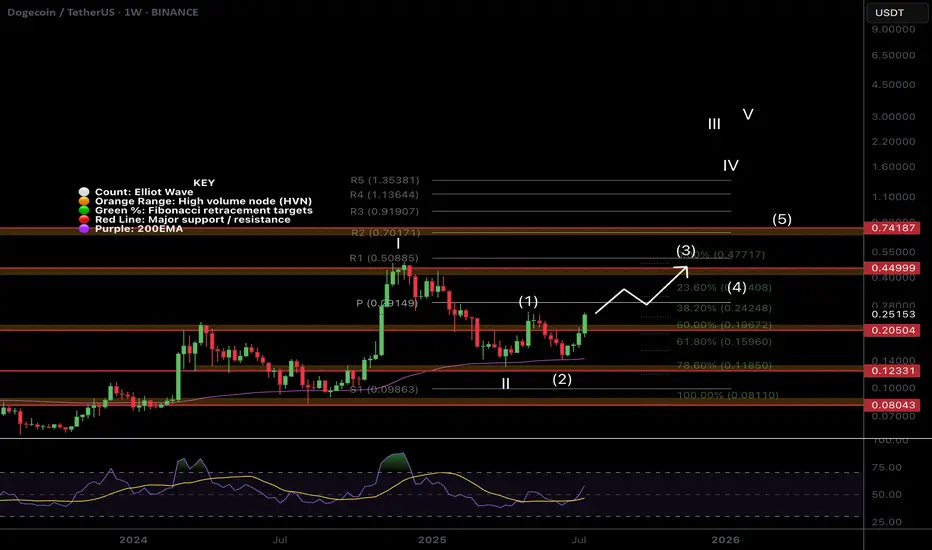
$DOGE Flipping to Bullish Structure!CRYPTOCAP:DOGE is coming to life after a second test of the weekly 200EMA as support and about to make a higher high, cementing in that higher low and flipping the macro structure bullish!
If the count is correct wave 3 of (III) should be powerful! The weekly pivot should put up a challenge as the first resistance before the High Volume Node at $0.45
Safe Trading
BITCOIN - Price can bounce up from support line to $125000Hi guys, this is my overview for BTCUSD, feel free to check it and write your feedback in comments👊
For a long time, the price was trading sideways inside a wide flat range between the $99000 support area and the $112000 resistance level.
After accumulating volume, bitcoin made a strong upward impulse and performed a breakout, pushing above the top of the flat.
Following this movement, the price action began to form a rising wedge pattern, moving between its clear support and resistance lines.
Recently, price tested the resistance line of the wedge and then started a predictable correction back down towards support.
Now, BTC is approaching the support line of the wedge, which aligns with the important horizontal support area around $112000-$113500.
I expect that the price can test this support line and then bounce up to the $125000 resistance line of the wedge.
If this post is useful to you, you can support me with like/boost and advice in comments❤️
Disclaimer: As part of ThinkMarkets’ Influencer Program, I am sponsored to share and publish their charts in my analysis.

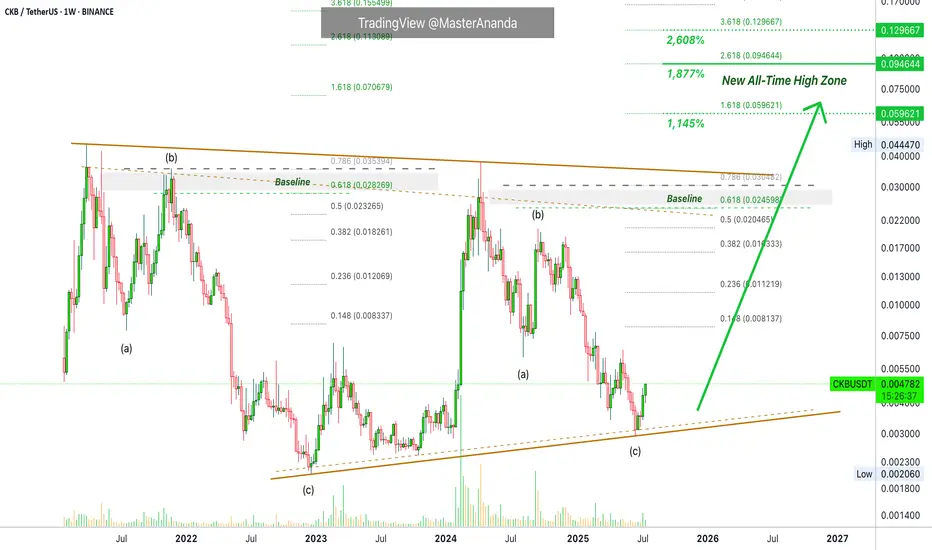
Nervos (CKB) · 1,877% - 2,608% Profits Potential · New 2025 ATHNervos (CKB) is headed first for the "baseline" to produce some 500% growth. This is the start...
Good morning and thanks for taking the time to read.
I appreciate your continued support.
The last four week we have seen rising prices, this is the start. The baseline level on the chart is actually the first wave fully in and complete. Maybe the first and part of the third if we consider a five up-wave structure.
Within a consolidation period, the baseline would be the end of the bullish action. After reaching this level, CKBUSDT would move back down to produce either a lower low or higher low compared to the start of the bullish move. We are not in a consolidation period anymore, we are entering the 2025 bull market phase so things will be different.
Instead of the baseline being an unbreakable resistance, CKB is set to continue higher. It is set to challenge the last all-time high and produce a new all-time high. The chart here shows that this is possible and highly probable.
The major correction between April 2024 and June 2025 was a classic ABC. This means that we are about to experience a bullish impulse composed of five waves. 1,2,3,4,5. The 2 and 4 are corrections. The action happens contrary to the main move/trend. The 1, 3 and 5 are advances and happen in accordance with the main move.
This should be smooth sailing with long-term growth. I am mapping 1,877% profits potential on the chart but there can be more, much more.
Namaste.
COTI Higher High (All-Time High) Confirmed · 2,612% Pot. ProfitsLet me remind you of one of the classic sayings, "higher lows will lead to higher highs —always."
While some charts are mixed; some projects produce shy lower lows and we don't know if this counts as a true lower low from a TA perspective; other pairs produce lower lows but still have potential for a new all-time high, some pairs produce double-bottoms and the situation becomes mixed; other pairs remain 100% clear. Here we have COTIUSDT with long-term higher lows.
The end of the bear market produced a bottom price that is many times higher compared to the start of the last bull market. A new all-time low (ATL) is simply not a question on this pair. The situation is 100% perfectly clear. Since we have an ultra-strong multiple-years long higher low, we can easily expect a higher high, which simply means a new all-time high (ATH) in the coming months. That's the beauty about TA and Crypto, you can predict the future if you know what to look for.
The easy targets here opens more than 580% profits potential.
COTIUSDT is trading with a full green candle today as it breaks out of a falling wedge pattern. The falling wedge is simply a downtrend. This downtrend is being broken.
On top of the long-term higher lows we have a local higher low, which is between June 2025 and October 2023. This is also long-term but not as long compared to the March 2020 market bottom and all-time low.
All this to say that market conditions are really good for this pair. The chart is super strong. This week we have a full green candle, trading at the top of the range and the session is about to close. When the session closes full green next week will be straight up. You will be witnessing the strongest action on this pair since early 2024 but with a big difference. It will be sustained. In early 2024 the big candles here only lasted three weeks. In 2025 you can have anywhere between 8-16 weeks straight up or even 24-32, etc. Whatever is needed for maximum growth to unravel. You won't be disappointed. You will be happy with the results.
Namaste.

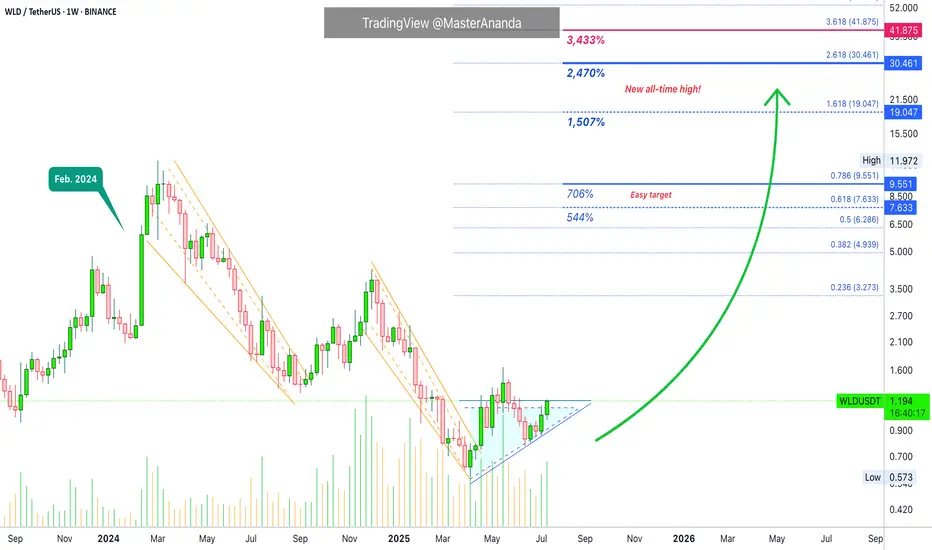
Worldcoin · Sudden Strong Jump · Beyond 2,400% Profits PotentialThe stage is now set. Chart and market conditions are perfect for a strong sudden jump. The type of advance that can change your life.
Good morning my fellow Cryptocurrency trader, I hope you are having a wonderful day.
Worldcoin (WLDUSDT) is still trading at bottom prices but with a perfect reversal pattern complete. The action is moving weekly above EMA8/13/21 and this week is closing green. This type of chart signal predicts astonishing growth. Wait is not necessary anymore.
This growth is already happening because we have two full green candles but this isn't it. The last two candles are full green but small. Things will change for the better. We will have full big green candles, something like February 2024 but instead of just one candle and then the action running dry and the start of a correction, we will have many big green candles coupled with sustained growth. It will be the best you've experienced since joining Crypto. Your profits will go through the roof; your capital will continue to appreciate; everything grows.
Volume is starting to rise as well but still relatively low. We have low volume because it is still early. The thing about "early" is that everything changes in a day. A sudden price jump. So today we are seeing prices below $1.20, in a matter of days WLD can be trading at $3 and then higher. Once the bullish breakout happens there is no going back.
We have an easy target first around 500-700% profits potential. The main stop opens up 1,500% and then we have more. Another strong target opens up 2,470% and this should be achievable in the coming months. I plotted just one more target just in case the speculative wave does what it tends to do best, surprise us all.
Just as a bear market can produce new all-time lows, a bull market can produce new all-time highs. Mark my words. Crypto is going up. Bitcoin is going up. Worldcoin is going up. The entire market is about to have the best yet period of growth.
If you are reading this now, you have great timing. Market conditions will be so much different in just two months. What seems normal today, and abnormal today, will be the norm. When it was a strange happening to see a 700% bullish wave, you will be seeing +1,000% across the entire market and many projects doing many times that long-term. It is hard to explain, but it is going to happen —Guaranteed.
The altcoins market is set to grow long-term.
Namaste.
The Crypto Era- Just updated an old chart!
- If you want to know where we stand, it's clearly outlined on the chart.
Some older Analyses :
- HODL strong!
Happy Tr4Ding !

SUI: Calm Before the Wave 3 Surge?CRYPTOCAP:SUI is shaping up to be one of those charts that makes you lean in a little closer.
Right now, it appears to be sitting inside a potential wave 3, but something feels off. It hasn’t exploded yet. And when you’re looking for wave 3 behavior, that’s what you want: speed, commitment, follow-through. A clean surge, ideally in a straight line, that clears doubts and leaves the doubters behind.
We’re not seeing that yet. Right now the move is decipherable at many nested degrees making this move feel cautious.
And that opens the door to some possibilities:
It is a wave 3, just one that hasn’t lit the match yet.
We’re still nesting, multiple wave 1s and 2s stacking before the actual move hits.
Or it's a wave C of a Zig Zag.
As for levels, $4.20 stands out. Whether this turns into a rocket or a reset likely hinges on how price reacts there.
Stay nimble. If this is a true wave 3, it’ll leave no time for hesitation.
Be early, but not reckless.

FLOKI Headed to $0.01. Cents Floki to the upside after break out from bullish triangle pattern. Target is the 141.00%

The SqueezeWhile it is logical to assume that the bulls are the ones about to get squeezed, I am going to be a contrarian and bet on the SHORTs getting liquidated, big time.
Good afternoon my fellow Cryptocurrency trader, how are you feeling this Saturday?
Every now and then, every once in a while the market enters a fight between down and up. When tensions rise, when people become anxious, when greed is strong, that's the time for a market squeeze to develop.
Seeing how good Bitcoin is doing, the strong Ether advance, how the altcoins are moving ahead and the rest, it is easy to rationalize that the market will squeeze all the over-leveraged LONG traders. I will repeat myself again, this is a SHORT squeeze.
Let's wait and see. Prices are going up. 1 Billion in liquidations coming next.
Let the bears run. Let's us start a mini bull-run phase.
Namaste.

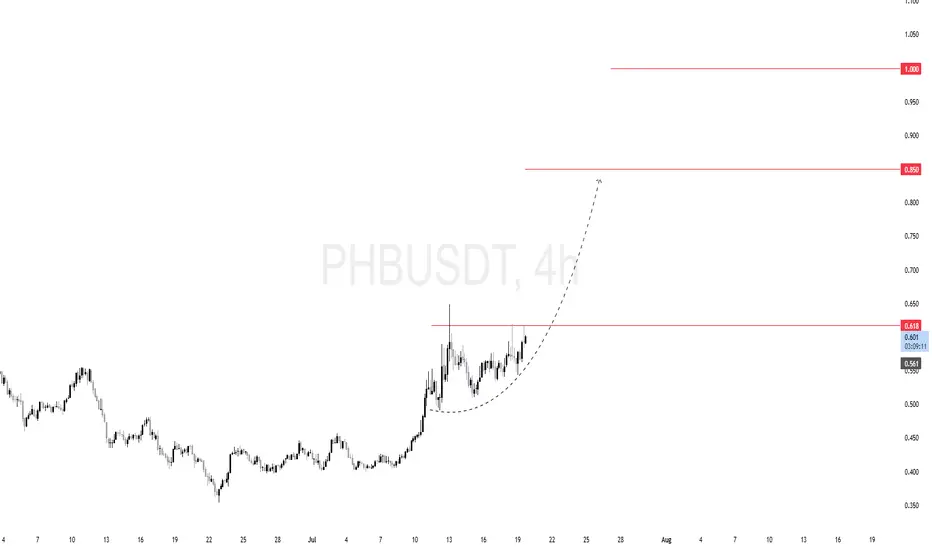
$PHB (PHBUSDT) 4HPrice spent several sessions consolidating below the $0.618 resistance zone. This horizontal level has been tested multiple times, building up buy-side liquidity above it.
We're seeing a rounded base formation — a classic bullish continuation pattern. It signals strong demand and positioning by smart money.
If $0.618 gets cleared with volume, we can anticipate rapid upside movement with the following key targets:
🎯 First target: $0.85
🎯 Final target: $1.00 (psychological level and historical supply)
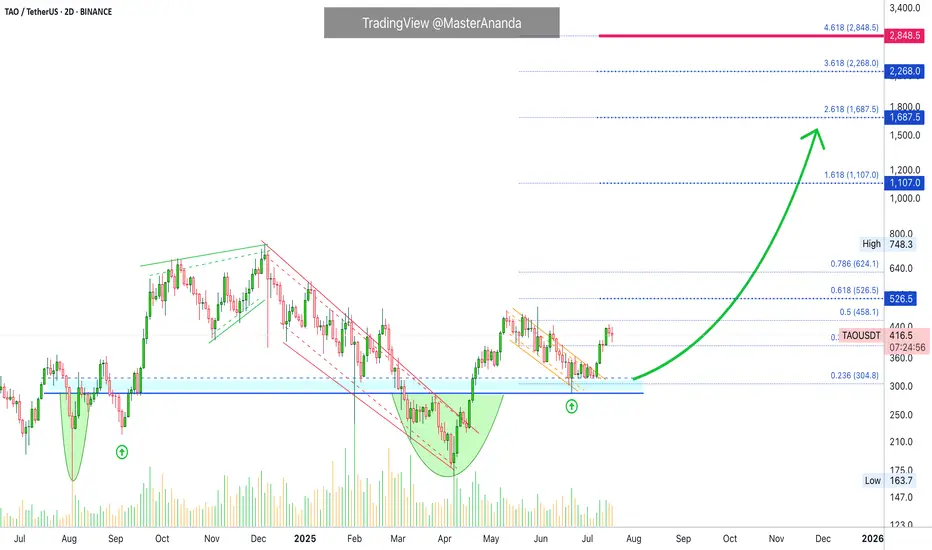
TAO's (Bittensor) True Potential Exposed · How About $3,000?Remember when I kept saying these are "conservative targets"? Why should we look for conservative targets when we know the market will do magic in the coming months? Why?
Let's focus more on realistic targets, optimistic targets, strong targets, good targets, successful targets; higher is better, less is not more.
We've been here many times before. I am happy and grateful to be able to count with your continued support. You can count with my analyses, great entry prices and timing. You can count with a unique market perspective 100% free of outside influences. I am not paid through USAID. 100% independent and everything you see is my mind, my soul, my heart and my spirit. It is my understanding of the market based on thousands of charts, thousands of publications, thousands of successful trades and more than a decade of experience. We are here to win and to trade. We trade to win, make no mistake.
Bittensor's (TAO) bottom is in, a long-term double-bottom; the beauty of TA.
A major low in August 2024. A new low in April 2025. The fact that these two happened at the same price is good news and it is already confirmed. Something as simple as the same level being hit twice helps us predict the future when it comes to the price of this, and others, trading pairs.
With the bottom in we can focus on growth. TAOUSDT is still early considering the bigger picture because the action is still happening below its May 2025 high. But conditions are good, very good I should say, because TAOUSDT is trading daily above EMA55, EMA89 and EMA233, a long-term moving average.
The break just happened days ago. If we are set to experience growth for 3-6 months, minimum, after this signal shows up, this opens the doors for prices much higher to what we've been considering in the past few months.
$1,100 is a good target but an easy hit. Only 30% higher compared to the last major high in December 2024.
$1,687 is the first strong resistance that TAO will face during its bull market bull-run. My bet is that it will break.
Going higher, we can see TAO trading at $2,268 later this year and even higher, just below 3K.
Now, this chart is very young so even while being optimistic we do not have enough data to project higher targets but there is no limit to how far-up a project can go during the price discovery phase. When we enter new all-time high territory and the final fifth (speculative) wave, all bets are off. You can aim for the moon or higher.
Namaste.
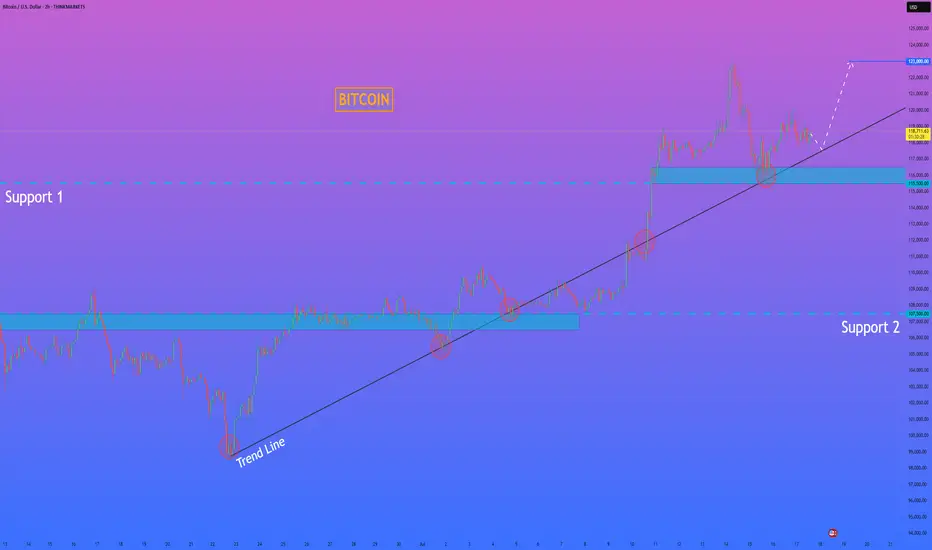
HelenP. I Bitcoin will correct to trend line and then start riseHi folks today I'm prepared for you Bitcoin analytics. The price has been trading in a strong bullish structure, clearly respecting the ascending trend line since the rebound from the 107500 level. Each time the price touched the trend line, it formed a higher low and continued the upward movement. After breaking through the important Support 1 zone (115500–116500), BTC made a strong impulse upward and reached a local high above 122000 points. Currently, the price is making a pullback and moving closer to the trend line again. This area has previously acted as a major point of interest for buyers, and now it's expected to play a key role once more. The support zone and trend line are converging, which makes this level critical for the next move. I believe BTCUSD will bounce from this area and continue its bullish momentum. My goal is set at 123000 points. Given the market structure, higher lows, and strong reaction from the support zones, I remain bullish and expect further growth from current levels. If you like my analytics you may support me with your like/comment ❤️
Disclaimer: As part of ThinkMarkets’ Influencer Program, I am sponsored to share and publish their charts in my analysis.
Avalanche's (AVAX) $229 & $363 Bull Market Potential ExposedStarting from the December 2020 low, Avalanche (AVAX) grew a total of 5,245% to its November 2021 all-time high. Now, if we take the true market bottom, when trading started back in September 2020 with a low of $0.85, total growth by the end of the bull market amounts to 17,152%.
It doesn't matter how you slice it, both are incredibly strong numbers.
Do you really think Avalanche will consolidate for years only to grow 500%, 600% in its bull market? I don't think so. This prolonged consolidation period was a test. Those that remained true to the market; those that continued to hold; those that continued to develop, to build and to grow within the market; all those people will be rewarded, big time.
Let's consider the true potential for AVAXUSDT in early 2026 or late 2025.
The main target is $229. I think missing a new all-time high is out of the question. We are going for the top as the market has been growing behind the scenes for so long. So much hard work has gone into making Cryptocurrency accessible to everybody and this hard work is about to pay off.
This $229 target opens up 880%. Keep in mind that this coming from current prices. If we were to consider the bear market bottom, this number would be much higher, something around 2,564%.
The next target, a "strong all-time high," is open at $363. This would give us a total profits potential of 1,450%.
As you can see, Avalanche is trading at bottom prices with plenty of room left available for growth. It is still very early if you focus on the long-term.
Thank you for reading.
Your support is appreciated.
Namaste.

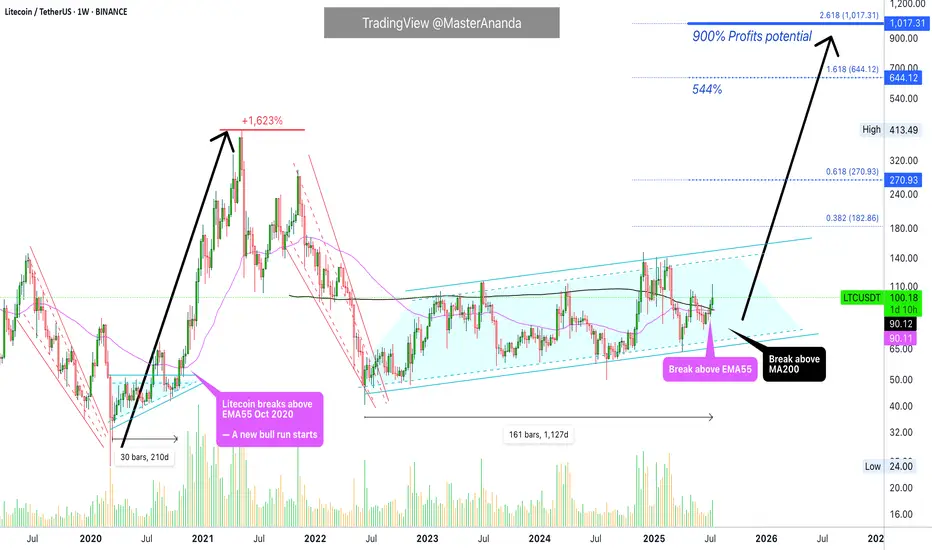
Litecoin $1,000 (900%) ExplainedBack in 2020, just 210 days of consolidation led to a 1,623% strong bull market. How much different market conditions we have now. Since 2022, Litecoin has been consolidating. The length of this consolidation is now 1,127 days. More than five times the previous consolidation and then some.
How much higher can Litecoin go compared to a past period?
How much more growth can a project produce when it has been building strength for so long?
LTCUSDT is now trading weekly above EMA55. When this happened back in 2020, what followed was sustained growth. Straight up, literally, for a period of 203 days. No stops.
Back in 2020, Litecoin moved above EMA55 first in August just to be rejected. The second time was the good one. This year the situation is the exact same. Litecoin broke above EMA55 in May and was rejected. The second time is happening now in July and this is the good one.
Litecoin is also trading above MA200 fully confirmed and there is a golden cross between EMA55 and MA200. We are very close to a major marketwide bull-run.
$644 in this bullish cycle is a high probability target for Litecoin, but prices can go higher, much higher because market conditions continue to improve and institutions will gain access to Litecoin through Exchange-Trade Funds (ETFs). This means that a standard price projection would be a disservice to us. We are aiming for $1,000+ on this bullish cycle but it can end up closing higher of course.
After the new all-time high is hit, it is normal to see a correction or even a bear market. This one should be short and small compared to previous ones. See you at 1K.
Namaste.
$NEAR Local Still looks corrective..Though the CBOE:NEAR weekly looks good the same pattern on NEAR that I have highlighted here was also found on NYSE:FET and EURONEXT:RNDR local charts that has held these coins back from moving compared to others and appears corrective in nature and they all end at the daily 200EMA on bearish divergence.
Just something to look out for. A rejection in alts now could see fresh lows
Safe trading

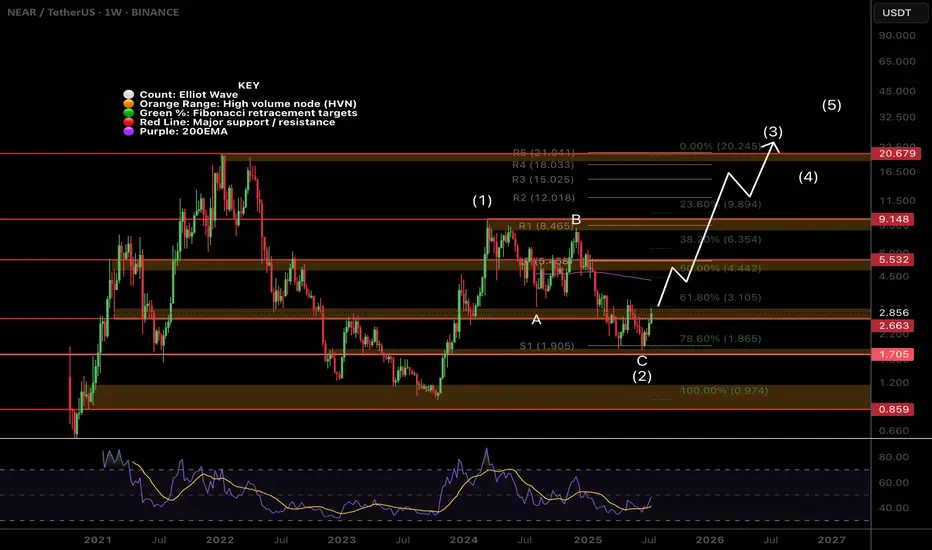
$NEAR Weekly TextBook Elliot Wave!CBOE:NEAR Weekly chart is a great demonstration of the text book motif wave followed by ABC corrective wave.
Bullish divergence has printed on the weekly RSI at the S1 weekly pivot support and the 'alt-coin golden pocket' 0.786 Fibonacci retracement. Price is closing in the major resistance High Volume Node.
The upside target is the newly printed weekly 200EMA followed by the weekly pivot and major resistance HVN just above $5.
A terminal target for this cycle may only see NEAR hitting all time highs around $21, the R5 weekly pivot point.
Safe trading
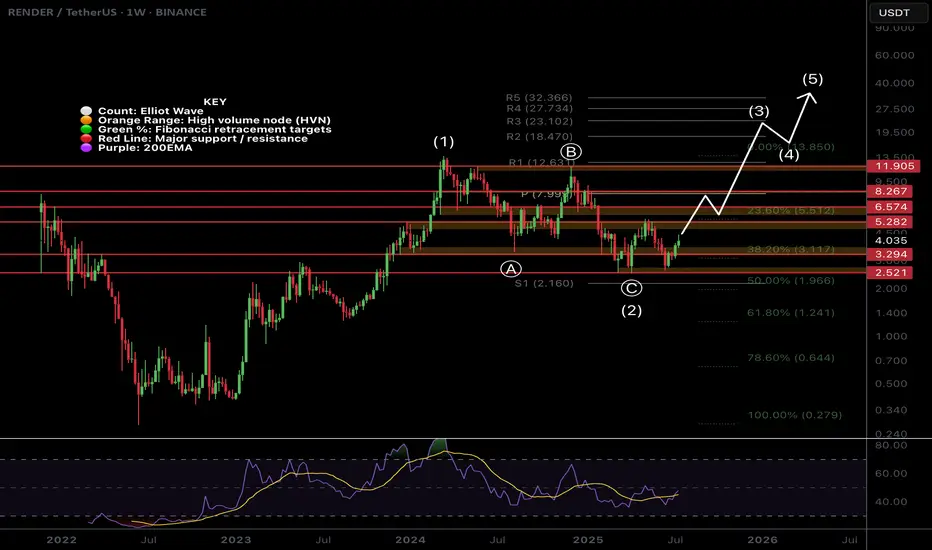
$RENDER Weekly Brings Clarity!CRYPTOCAP:RENDER weekly chart shows long term strength through the depth of the Fibonacci retracement not even reaching 0.5.
The depth of the recent swing low been so close wave (C) does concern me that the larger correction is not yet over and maybe price does want to visit the 'alt-coin' golden pocket of the 0.618-0.768 Fib retracement Where the would be a High Volume Node (not drawn).
For now the upside target is the weekly pivot but the local chart has a lot of work to do first with daily 200EMA!
Safe trading
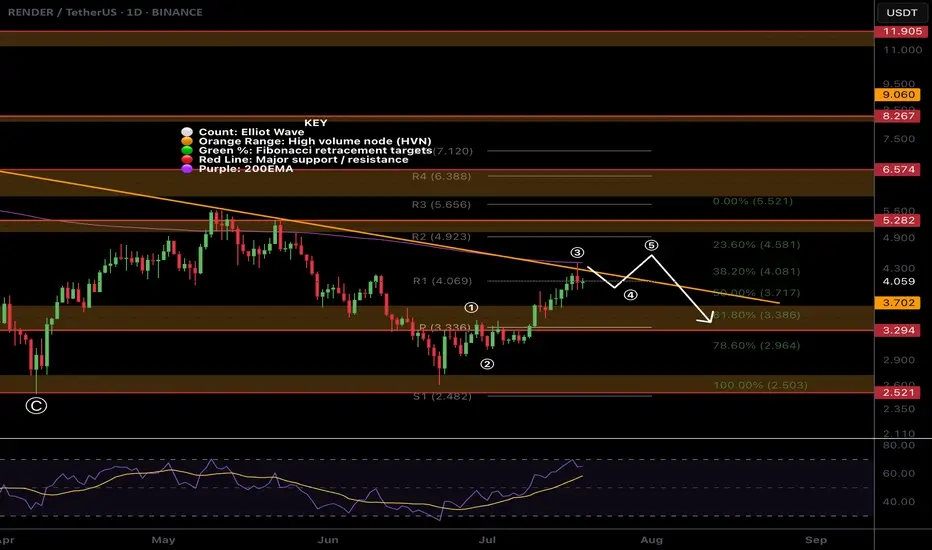
$RENDER At Major Resistance!CRYPTOCAP:RENDER has been relatively weak. Looking at the local chart it appears we have finished a wave (3) at the daily 200EMA and descending resistance.
Price has overcome the High Volume Node (HVN) support flipped resistance but a strong at coin pull could see fresh lows for Render.
There is also daily bearish divergence on the RSI.
The Elliot Wave count could also be an ABC corrective wave up which has now terminated.
If its a new motif wave and a major bottom has formed , wave 2 should find support at the HVN, daily pivot and 'alt-coin' golden pocket between 0.168 and 0.782 Fibonacci retracement
Safe trading