Most Will Get Trapped on EGLD’s Next Move Don’t Be One of ThemYello Paradisers, did you catch the EGLD breakout or are you still waiting for confirmation that’s already gone? While most traders are sleeping on this setup, it has just completed one of the cleanest breakout-and-retest patterns we’ve seen in weeks, and what comes next could leave many trapped on the wrong side.
💎#EGLDUSDT recently broke through its descending resistance with strength and has now retested that same level, which is acting as solid support in the $14.30–$15.00 range. This successful flip of resistance into support is a textbook bullish signal, and it’s holding beautifully indicating strong buyer presence and increasing the probability of continued upside.
💎If this support holds firm, #EGLD is eyeing a move toward the $18.00–$18.25 region, where moderate resistance is expected. A break above this could open the path toward the $19.90–$20.40 zone, a significant resistance level that may shape the next macro structure on this chart.
But it’s not all upside. If EGLD fails to hold the $13.00 level and especially the key invalidation point at $11.85 this entire bullish setup breaks down, and sellers will likely take control. The bullish momentum would collapse fast, and the door would open to much deeper downside levels.
MyCryptoParadise
iFeel the success🌴
Crypto

Is ASTR About to Break Out or Break Down? Don’t Miss ItYello Paradisers! Are you positioned correctly, or will you once again find yourself on the wrong side of the market when the real move begins? If you’ve been with us, you know we’ve been waiting for this kind of setup with patience, and now it's time to pay attention.
💎#ASTR/USDT has been moving inside a clean descending channel, respecting both the upper resistance and lower support lines consistently. However, recent price action suggests a potential shift in momentum. After tapping into the strong demand zone between 0.0200 and 0.0215, the price has shown multiple sharp rejections from the lows, indicating that buyers are quietly stepping in.
💎Currently, the price is attempting to break out of the descending structure. We are closely watching how it reacts around the 0.0240 area, which is now acting as probable support. A successful retest of this level would be a significant structural shift, and it opens up the path to retest 0.0280 our first minor resistance. If momentum continues to build and that level breaks, the doors are wide open toward the 0.0310–0.0320 zone, with the final strong resistance sitting around 0.0345.
💎On the flip side, invalidation occurs if the price fails to hold above 0.0210. A clean break below that level could send #ASTR back toward 0.0190, nullifying the current bullish setup. Until then, we remain cautiously optimistic, waiting for the market to confirm direction before committing fully.
Stay sharp, Paradisers. The market is about to pick a side and we’ll be on the right one.
MyCryptoParadise
iFeel the success🌴

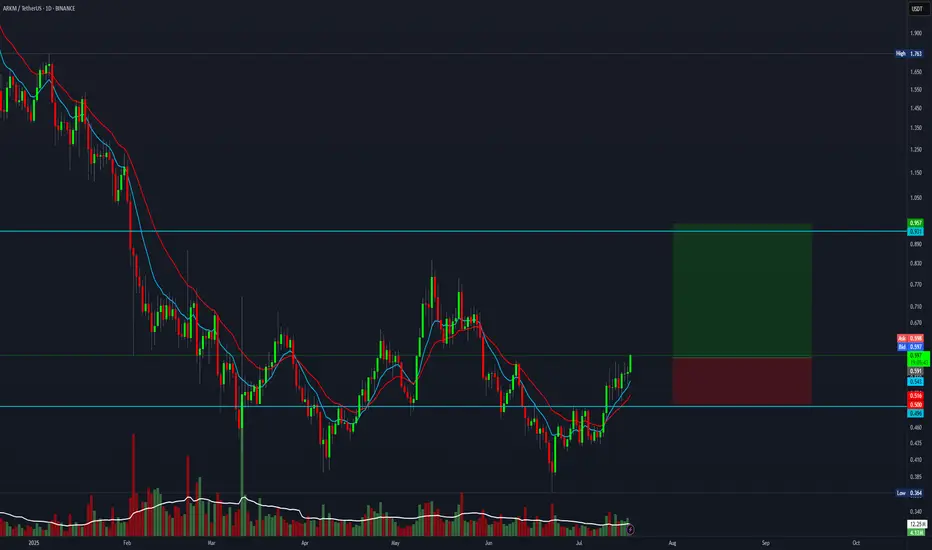
4:1 R:R trade setup for ARKMEverything is pumping right now, and this one also offers a 4:1 R:R setup.
Entry: 0.596
Stop Loss: 0.500
Target: 0.950
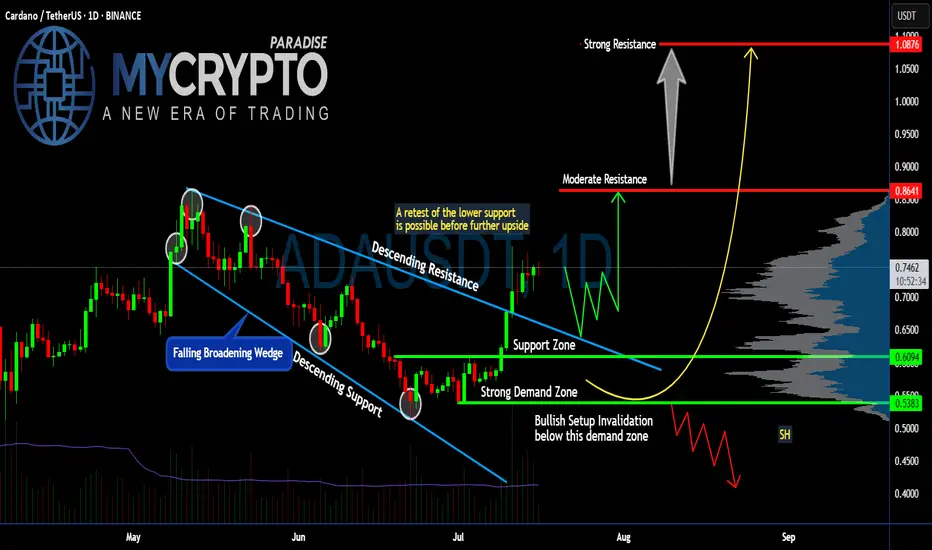
Is #ADA Ready For a Major Move or a Trap is Ahead? Watch this Yello, Paradisers! Is this breakout on #Cardano the start of a major upside move or just another bull trap waiting to flush out impatient traders? Let’s break down the latest #ADAUSDT setup:
💎After weeks inside a falling broadening wedge, #ADA finally broke above the descending resistance, signaling a potential trend reversal. The breakout above $0.70 has pushed the price toward the current $0.74 zone. The soaring volume and a positive broader market outlook reinforce our bullish bias. While this looks bullish, the key question is whether #ADAUSD will hold above its reclaimed support or retest lower levels first.
💎The structure is straightforward: #ADA reclaimed the support zone around $0.70 after bouncing strongly from the demand zone near $0.61–$0.60. This demand zone remains the critical area to watch—any healthy retest here would provide a high-probability continuation setup for bulls.
💎If buyers maintain control, the first target sits at the moderate resistance of $0.86. That’s where the next notable selling pressure is expected. But the real battle will take place near the strong resistance at $1.08—a zone where major distribution and profit-taking could occur.
💎However, the bullish setup becomes invalid if #ADAUSD loses the $0.61–$0.60 demand zone. A confirmed close below $0.538 would flip the structure bearish, signaling a potential continuation to lower lows.
Stay patient, Paradisers. Let the breakout confirm, and only then do we strike with conviction.
MyCryptoParadise
iFeel the success🌴
Is #THETA Ready For a Major Reversal or Another Fakeout ahead?Yello, Paradisers! Is this breakout the beginning of a bullish reversal for #THETA or just a setup to trap the herd before a sharp dump? Let’s break down the setup of #ThetaNetwork:
💎After weeks of slow bleeding inside a falling wedge, #THETAUSDT has broken out of this pattern. The price is currently hovering around $0.718, and it’s the first time in weeks we’re seeing real bullish momentum starting to build. The volume is slowly picking up, so the probability of a bullish push is higher.
💎A clean breakout above the descending resistance now opens the door toward moderate resistance at $0.999. That’s the next key hurdle where we expect sellers to show up. If bulls are strong enough to clear that zone, we’re targeting the strong supply level at $1.284, where significant distribution will likely begin.
💎Why this setup matters: The support zone between $0.60 and $0.66 has acted as strong demand for multiple weeks now for #THETAUSD. Price wicked into it again recently and got bought up quickly, forming a potential higher low. This kind of accumulation behavior often precedes a strong leg up if volume confirms the move.
💎However, if price loses the key support at $0.60, and more importantly breaks below the setup invalidation level at $0.439, we’ll treat this as a failed breakout and expect a deeper correction. That would bring us back into the lower demand zones, and we’ll sit on our hands until the next proper high-probability entry appears.
Stay patient, Paradisers. Let the breakout confirm, and only then do we strike with conviction.
MyCryptoParadise
iFeel the success🌴

Axie Infinity Trades Within Opportunity Buy Zone · (PP: 16,253%)Right now Axie Infinity is trading within the "opportunity buy zone," this is a level just below the support zone from 2024, 2023 and 2022. It is trading in this zone searching for liquidity. Once this move is over, AXSUSDT will never be available at these prices in the future. The lowest will be the long-term support zone from 2022-2024.
Can Axie Infinity hit a new all-time high in 2025 or 2026? It is possible. But, in this chart setup and analysis we are focusing on high probability conservative targets.
"Back to baseline" is the very easy target. The first target after that sits around $20 for 677%. The main target goes higher, $32 for 1,111%. A strong target is $55 and this one opens up 1,983% profits potential.
A new all-time high can be $268 & $435. Really huge numbers. Just to give you an idea, the second one would be equal to 16,253% profits potential. The first one, $268 would be equal to 9,975%. This is theoretically possible so I don't want to commit to it but is good to keep an open mind with market conditions improving at the speed of light. If we can say there is such a thing.
Technical analysis
The bottom in 2025 matches the mid-way stop of the 2021 bull market. So this is an interesting and valid zone for a reversal.
We don't need to go any deeper in looking for reversal signals because a marketwide bullish bias is already confirmed. We've been bullish since 7-April 2025. Some pairs move first others later though and that's why some are already very high while others are very low. This is good because it gives us time to adapt to the market. If everything were to move together at the same time on the same date, it would be too late to buy anything low. Because the market cycles through different sectors, groups and pairs, we can buy the ones that are low now knowing that they will eventually move ahead. Everything grows. Everything will grow. The 2025 bull market is already confirmed.
Thanks a lot for your continued support.
Namaste.

The Correction Is Over! Bull FlagThe bull flag is a popular pattern. Everybody who has seen a chart is familiar with this pattern. It is a continuation pattern.
When I say that the correction is over I am not talking about the short short-term, I am talking about the bigger picture.
Yes, bullish action is expected to start and intensify within weeks, no!, days. But still, with thousands of projects, it takes lots of time before energy (money) reaches all sectors of the market. Allow for strong variations but the correction is over which means growth.
The correction is over means that the low is already in for most pairs and will be in, in the coming days for all remaining pairs.
The correction is over means that everything will grow, just as it did after the 7-April bottom low. The difference is that this new wave will be many times bigger and stronger than before.
TOTAL2 produced an advance from early April until late May. The retrace produced a bull flag continuation pattern. The pattern has run its course, it will resolve with a new phase of growth. It won't take long. It will be obvious in a matter of days. No need to pray, Crypto is going up.
Namaste.

XRP - One More Wave Soon!Hello TradingView Family / Fellow Traders. This is Richard, also known as theSignalyst.
📈XRP has been overall bullish trading within the rising wedge pattern in blue.
However, it is approaching its all-time high at $3.4.
🏹 The highlighted blue circle is a strong area to look for buy setups as it is the intersection of the orange demand zone and lower blue trendline acting as a non-horizontal support.
📚 As per my trading style:
As #XRP retests the blue circle zone, I will be looking for bullish reversal setups (like a double bottom pattern, trendline break , and so on...)
📚 Always follow your trading plan regarding entry, risk management, and trade management.
Good luck!
All Strategies Are Good; If Managed Properly!
~Rich

Solana - The Cup is Almost FullSolana is printing a textbook cup & handle formation on the daily, and price is now pressing against the neckline resistance near $185, just below the psychological $200 zone.
This structure reflects months of accumulation and rising momentum. A confirmed breakout above the $185–$199 resistance would likely trigger the next upward leg.
This setup signals trend reversal continuation, and if SOL closes above $199 on high volume, momentum traders may pile in quickly.
📌 Invalidation below $150 = pattern risk-off.

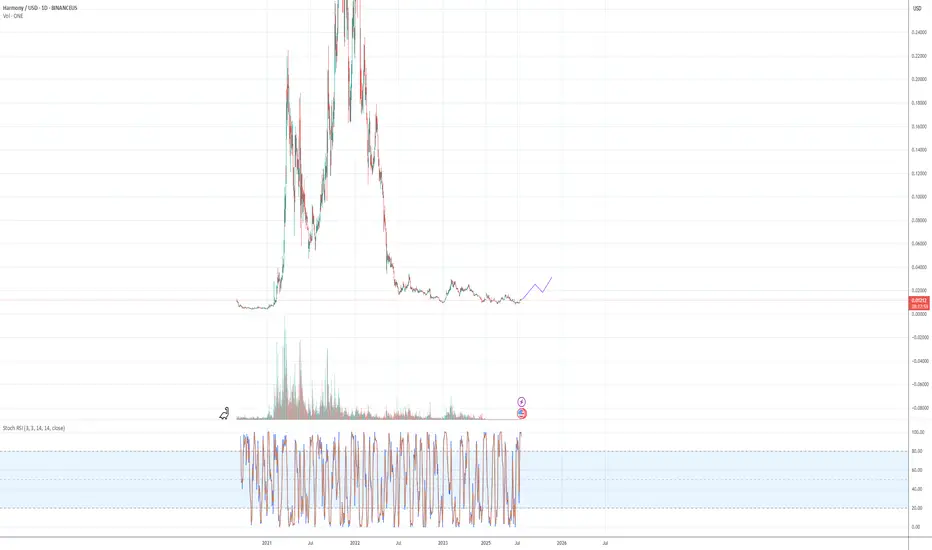
$ONE - HarmonyOne recovery will be EPIC, great devs/communityThey had a rough battle in 2021 after an incident that has been remediated but has strived to make things right with their Recovery ONE project. This was one of the most promising projects back then with insane transaction speeds and low fees. Looking very forward to where they go. This is my opinion only and should not be taken as investing advice. I do have a stake in HarmonyOne.
CRYPTOCAP:BTC , CRYPTOCAP:ETH , CRYPTOCAP:ADA
ETHUSD - Stretched price. Pullback to CL likelyPrice tagged the U-MLH, the stretch level.
Think of it like the 2nd STDV.
Now think Mean Reversion.
With such a stretch, price has a high chance to revert to the mean - down to the Centerline (CL).
What is this information good for?
a) take profit (...or 50% partial)
b) short on intrady signs
But if it is open and close above the U-MLH, then there's a good chance that price is advancing to the Warning Line, the extension of the Center to U-MLH.
Let's observe what happens.

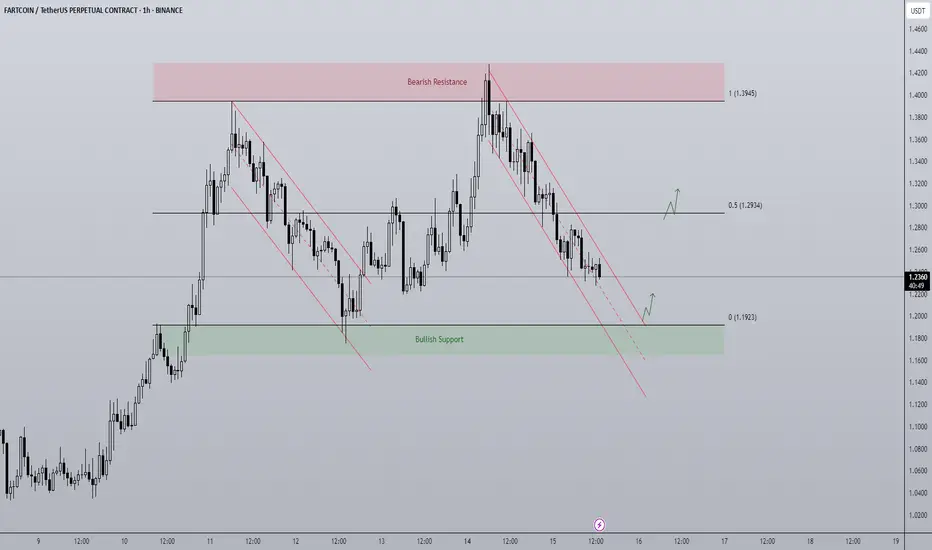
Fartcoin - Rangebound repeat? A BTC makes new highs attention has turned towards altcoins to play catch up.
FARTCOIN has been a top performer of the last month and currently on the 1D timeframe finds itself in a rangebound environment capped between $1.1923 - $1.3945. The end of last week price trended down in a bearish channel from top to bottom and it looks to be doing the same currently. As the supply zone above the range high got swept, price printed a SFP getting back inside the range and began trending down, for me there are two actionable long entries here:
- A range low bounce + breakout of trend channel would be an ideal long entry. An area of clear support coupled with a breakout is a historically strong setup with a clear invalidation if price breaks below the range and gets accepted.
- A more aggressive but potentially less ideal setup would be a breakout of the downtrend before hitting range lows. Higher risk as the level of support is not as defined but in the more risk-on environment crypto is currently in, the chance of major support levels being front run does go up as buyers become more impatient when FOMO grows.
The midpoint is key level to look out for too as a reclaim would mean a run at the highs, rejection opens the door to retest the lows.
AIXBT – Ready to Break Out?
This is AIXBT on the daily chart.
Price is now testing a confluence of resistance: the 50MA and the 0.5 Fib level — both aligned in the same zone.
Both systems are in long mode:
* PSAR is bullish
* MLR > SMA > BB Center
The RSI just broke out of a month-long bullish divergence, signalling fresh momentum.
Why AIXBT could outperform after the GENIUS / CLARITY / Anti-CBDC acts:
1. AI x BTC is the hottest meta — and AIXBT is riding both waves.
2. Not a CBDC, not a stablecoin — less regulatory friction.
3. Low cap + trending narrative = upside volatility.
Conclusion:
If the systems are long, I listen. AIXBT is aligned both technically and fundamentally.
I’m long: not financial advice.
Always take profits and manage risk.
Interaction is welcome.

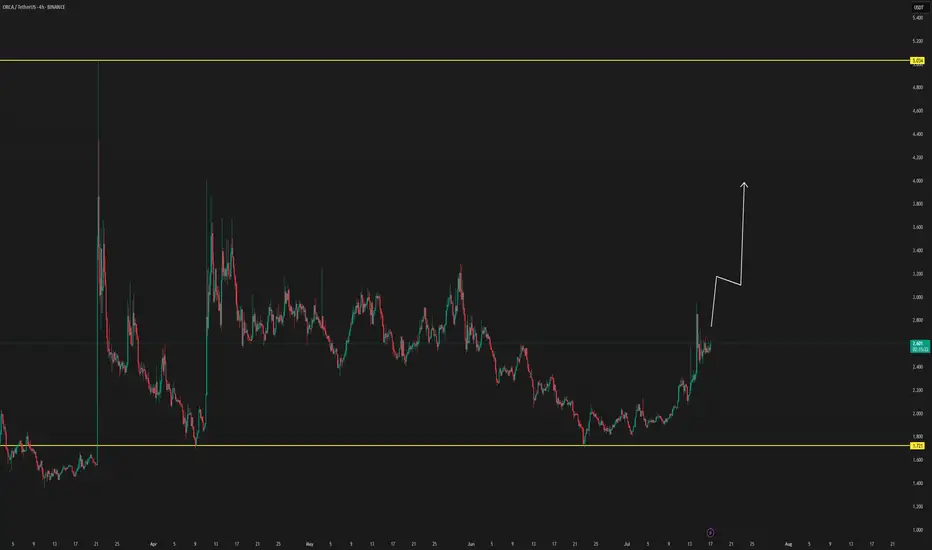
ORCA/USDT NEW VOLUME ENTERYORCA shows for the first time in long time ago a new volume uptrend, which can get confirmed in the next hours to a new volume.
When there are new confirmations or updates, they will be listed here below.
If there is new confirmations coming, we could see this coin soon to targets
$3.17
$4.20
Best target $5
The trend study shows there is new interest in ORCA
SOL/USDT : SOL Rebounds Strong – Is a 25% Rally Just Beginning?By analyzing the Solana (SOL) chart on the daily timeframe, we can see that after dropping to the $147.75 zone, the price experienced renewed buying pressure and has since rallied to around $159, delivering over 6% return so far.
This cryptocurrency shows strong bullish potential, with short-term gains possibly exceeding 25%.
The next upside targets are $168.5, $187, $220, and $263.
Please support me with your likes and comments to motivate me to share more analysis with you and share your opinion about the possible trend of this chart with me !
Best Regards , Arman Shaban

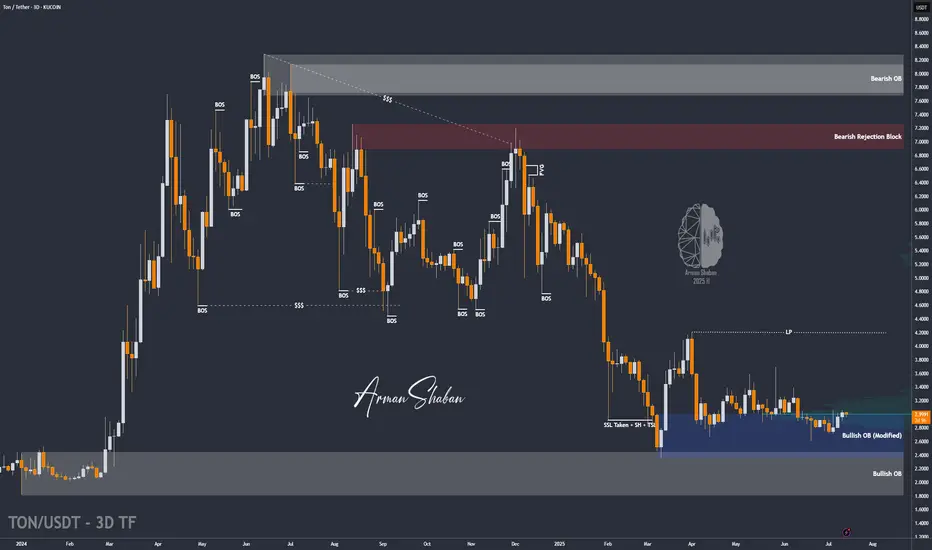
TON/USDT : Get Ready for a new Rally! (READ THE CAPTION)By analyzing the Toncoin chart on the 3-day timeframe, we can see that the price has finally managed to grow over 3% as expected, and is currently consolidating above the $3 level. We’ll have to see how far this bullish momentum can continue — but to be honest, I expected a stronger move considering the market rally and Bitcoin repeatedly hitting new ATHs. Still, no worries — once Bitcoin takes a breather, altcoins will likely begin their powerful runs! Based on previous analysis, the next targets are $3.15, $3.63, $4.20, and $4.68 respectively.
Please support me with your likes and comments to motivate me to share more analysis with you and share your opinion about the possible trend of this chart with me !
Best Regards , Arman Shaban
$PENGU Taking a Breather? CSECY:PENGU Taking a Breather? Wave 4 May Be Brewing
After a strong move, CSECY:PENGU looks like it might be pausing for breath. The recent action suggests we may have just wrapped up a small-degree Wave 3, with price now struggling to clear a key resistance level from earlier in the structure.
That hesitation could mark the early stages of a Wave 4 correction...Conservatively.
Here’s the zone I’m watching for a potential W4 pullback:
- .236 to 50% retracement of Wave 3, measured from the Wave 2 low
- Most Likely Target (MLT) sits right around the .382 fib
- Keep an eye on time symmetry—Wave 4 may offset the time duration of Wave 2
- Price could react off the base channel as a support guide
If this is a W4, it could give us a clean continuation setup into Wave 5—provided it holds structure and doesn’t overlap the Wave 1 territory. Stalking the pullback as it plays out, and am ready to react if we see support step in at the expected fib levels or the base channel.
Trade Safe!
Trade Clarity!

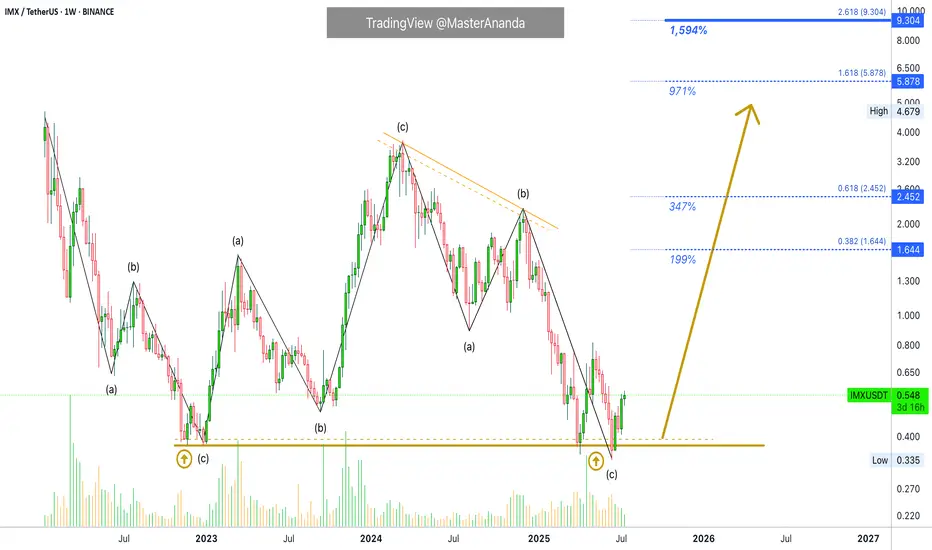
A New All-Time High Guaranteed for ImmutableX (1,600% PP)IMX produced a strong bullish cycle between December 2022 and March 2024. The entire bullish wave was corrected beyond 100%. This means that IMXUSDT hit a lower low. It went below the starting point of the last bullish wave. This is good in several ways.
The last move being deleted in its entirety opens the doors for a new bullish cycle with unlimited growth potential. We also know that all weak hands have been removed. Anybody who wanted to sell had more than a year to do so with all profits erased from the previous cycle. A total flush, a full reset.
The last bullish cycle produced more than 850%. We now know that this much is do-able so it becomes very easy. Last time market conditions were mixed to say the least, but not extremely bullish nor the best possible.
If IMXUSDT can grew this much in a mixed market, how much can it grow in a favorable market, in a bull market?
So, we aim for a strong higher high, a new all-time high. This opens up $5.9 an $9.3 as target for this newly developing bullish phase.
Thank you for reading.
Namaste.
Frax Share 1,104% Target Explained · Scam Wick & MoreFrax Share is starting to recover with strong bullish momentum. The low for this pair was set 3-February with what many people call a "scam wick." Higher lows since. A higher low in March then again in April and June. Only a few pairs completed their lows in February and this is good.
The scam wick was so strong that you can be certain there is no need for prices to go lower again. From now on, we can witness sustained long-term growth.
The "back to baseline" level opens up an easy 224% potential profits. This is the level where you can say, "Ok, I want to triple this Bitcoin with very low risk." And it works like a charm because the action will end up much higher. This is the kind of move that cannot fail. We use spot of course as the whole strategy becomes a simple wait —buy and hold.
The next target gives us 664% and requires the highest prices since May 2022, more than three years. This one is good but some resistance will need to be conquered to get there.
The final target that is mapped on this chart opens 1,104%. This is a strong target but is also do-able. When all is set and done, we can end up with an even higher target. These are only conservative projections and hard to miss. I cannot say with a high level of certainty how far up Frax Share will go, the chart is a bit strange, but I can say with 100% level of certainty that we are entering a major bullish wave. 500% to 1,000% growth is an easy guess. Anything extra is welcomed and accepted.
Thank you for reading.
Namaste.

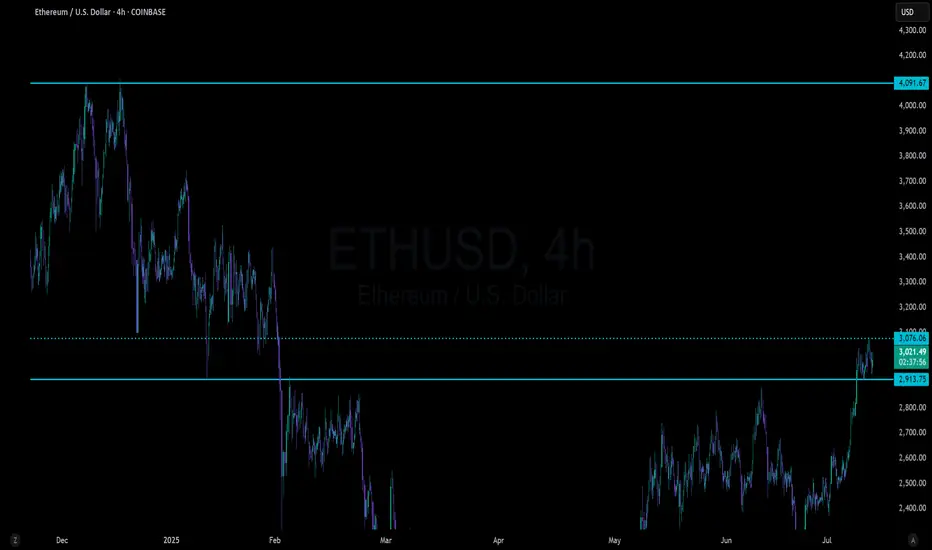
Ethereum reached to our target
Ethereum reached to $3400 that we talked about since weeks ago, but now the daily RSI is at overbought area and we might see a correction.

Reserve Rights · A Rising Trend · New ATH Potential in 2025I took my time drawing this chart for you showing all the different stages of the market cycle.
We are looking at Reserve Rights (RSRUSDT) on the weekly timeframe.
Full chart
» A bear market ends with an ending diagonal pattern and final bottom.
» The reversal forms as a classic cup and handle pattern.
» The market transitions from bearish to bullish and turns green.
» Price action changes from lower highs and lower lows to higher highs and higher lows.
» RSR creates a rising channel.
» We are witnessing the start of the next advance.
» Reserve Rights is ready for a higher high and the highest prices in four years, since 2021.
Current price action
» RSRUSDT is on its fourth consecutive green week.
» In early 2024, it produced 7 consecutive weeks closing green as a minor advance.
» The correction that followed was brutal but ended as a higher low in August 2024 than a new advance, this time a total of 17 weeks rising but not all green.
» We are set to experience the last and strongest bullish wave for this RSRUSDT bullish cycle.
» It should be many times stronger compared to last two.
2025 New all-time high
» The final target for this wave can be many times higher than what is shown on the chart.
» On the chart I am showing only a very conservative target.
» I expect higher prices.
» Looks like a good pair based on TA.
Thank you for reading.
Namaste.

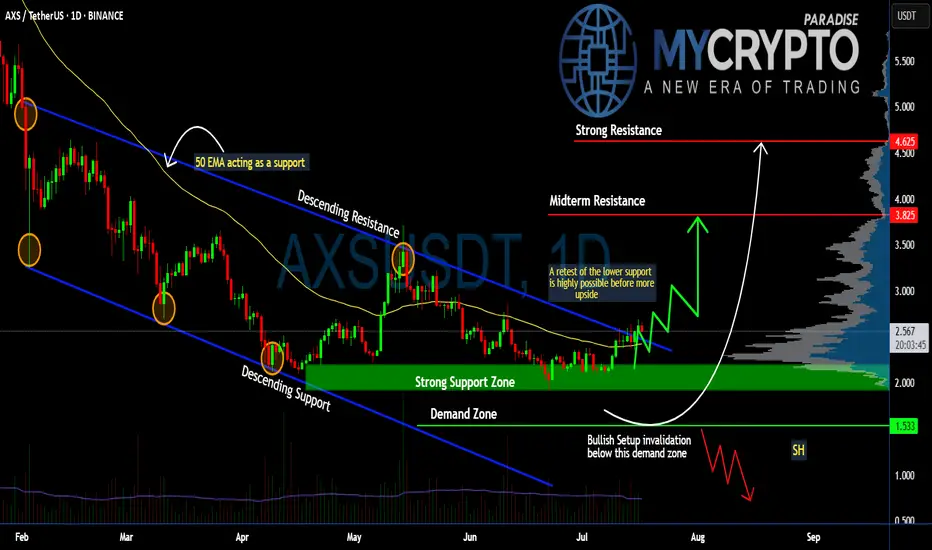
Can #AXS Bulls Sustain the Momentum or Will it Fall? Key LevelsYello, Paradisers! Will #AXS finally deliver a strong upside move, or are we just seeing another setup to trap impatient bulls before a deeper drop? Let’s break down the latest #AXSUSDT structure:
💎After months inside a descending channel, #AxieInfinity has finally broken above the descending resistance, showing early signs of a potential trend reversal. The current price trades around $2.56, but history tells us a retest of lower levels is still highly possible before any sustained upside move. The soaring volume and a positive broader market outlook reinforce our bullish bias.
💎The structure is clear: the strong support zone sits between $2.20–$2.00, and this is the first critical level to watch. A healthy retest here would provide a high-probability continuation setup for bulls. Below that, the demand zone at $1.53 is the last stronghold—losing this level would invalidate the bullish scenario completely.
💎If buyers maintain control, the first upside target stands at the midterm resistance of $3.82, where some profit-taking and selling pressure are expected. A clean breakout above this zone could push the price toward the strong resistance at $4.62, where major distribution could occur.
💎However, the bullish setup becomes invalid if #AXSUSD loses the $1.53 demand zone. A confirmed daily close below this level would flip the structure bearish and open the door for a move to new lows.
Stay patient, Paradisers. Let the breakout confirm, and only then do we strike with conviction.
MyCryptoParadise
iFeel the success🌴