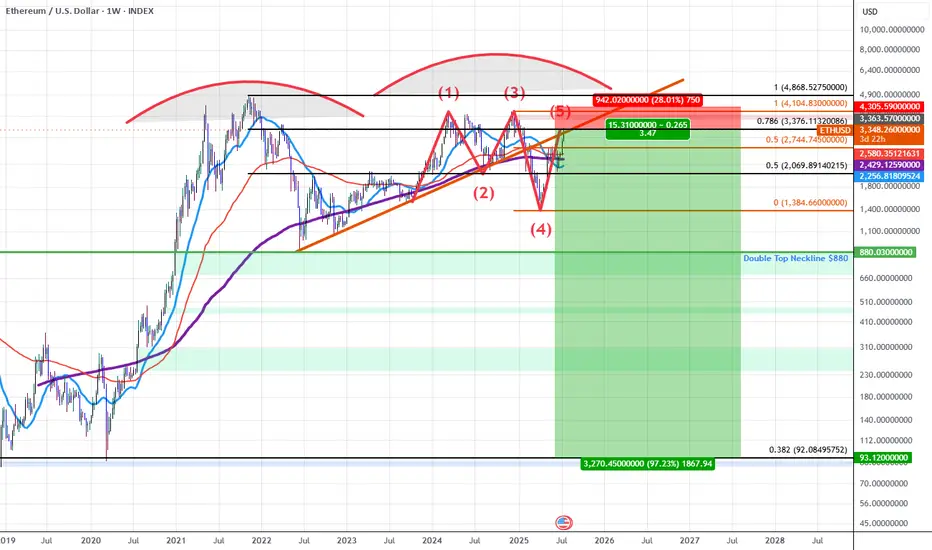
ETHUSD: Double Top into A Bearish 5-0 Breakdown (Extended)Updated Commentary: ETH has extended a bit further than projected as the Pattern Completed at the 0.618 but ETH gapped into the 0.786 instead. The gap up aligned with an upside gap fill on the CME futures as well as a gap fill on the grayscale ETH futures ETF $ETHE. The easier move from here to simply add to the ETH shorts and adjust the stop to be above the previous highs while sizing up at the 0.786 and playing off this gap higher as an anomaly. Beyond this, my view on ETH at the current 0.786 retrace remains the same as the original Idea posted as ETH rose into the initial 0.618 PCZ the details of which I will also include once again below as it still remains relevant.
ETH for the last 5 years has been developing a Double Topping pattern which has put in a series of lower highs during the most recent 2nd run up. As we've confirmed these lower highs we've broken down below trendline and are finding resistance at the trendline which happens to have confluence with the PCZ of a Bearish 5-0 wave formation near a 0.786 retrace.
As we begin to find weakness and Bearish price action begins I suspect price will make it's way towards the neckline of the double top aligning with the $880 price level if ETH breaks below that level there will be no significant support until it reaches the all-time 0.382 retrace down at around $92.10.
In short it seems ETH is in the early stages of a macro breakdown which could result in value declines greater than 80%.
I also suspect that we will see many of the assets that ran up significantly going into this week to sharply reverse those run-ups as this week comes to a close and the new week begins mainly due to the effects of OpEx, this includes: Bitcoin, MSTR, SOL, XLC, META, and BTBT. Long-dated Put accumulation on these assets at these levels is far easier to manage than naked short positions and that's how I will go about positioning here.
Crypto
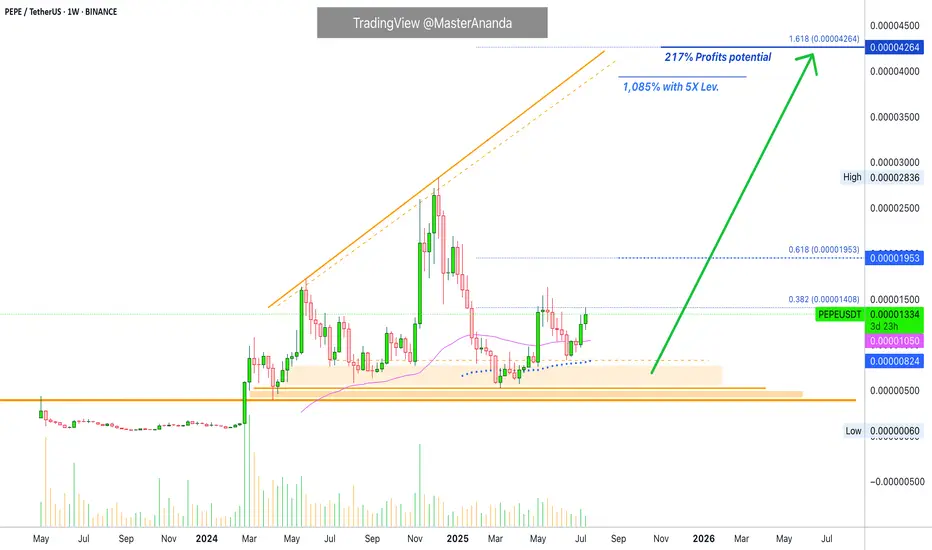
Pepe's Bullish Bias Intensifies · 217% PP = 1085% 5X Lev.The bullish bias for PEPEUSDT is starting to intensify, still early of course. It is still early on this one because the action is still lower than the 19-May high. There are many projects that are already trading above their last high. So it is good news to find a pair that is moving below because we know that soon it will be moving above. In the coming days.
While the 19-May wick high reached 0.00001632, the weekly close happened at 0.00001361. As you can see from the chart, the current price is already higher than the highest weekly close and this gives us a strong bullish signal.
Notice again how the action moved above EMA89 back in mid-April. When the retrace happened, May-June, the recovery happened above this level. A signal of strength.
PEPEUSDT moved briefly below EMA55 only two recover and this is the second week above this level. Trading weekly above EMA55 & EMA89 means that the bullish bias is fully confirmed. A fully confirmed bullish bias means we are set to witness a higher high, and a higher high means prices moving above 0.00001953, short-term. In a matter of days.
The main target for this move is 0.00004264 giving us a nice 217%. With 5X leverage, relatively low risk, that would be beyond 11X (1,085%).
In a matter of days, the entire altcoins market will be bullish and moving higher. Make sure you are fully invested by the time everybody is rushing to buy. That is, you should be all-in now. It is not too late.
Thank you for reading and for your continued support, it is truly appreciated.
Namaste.
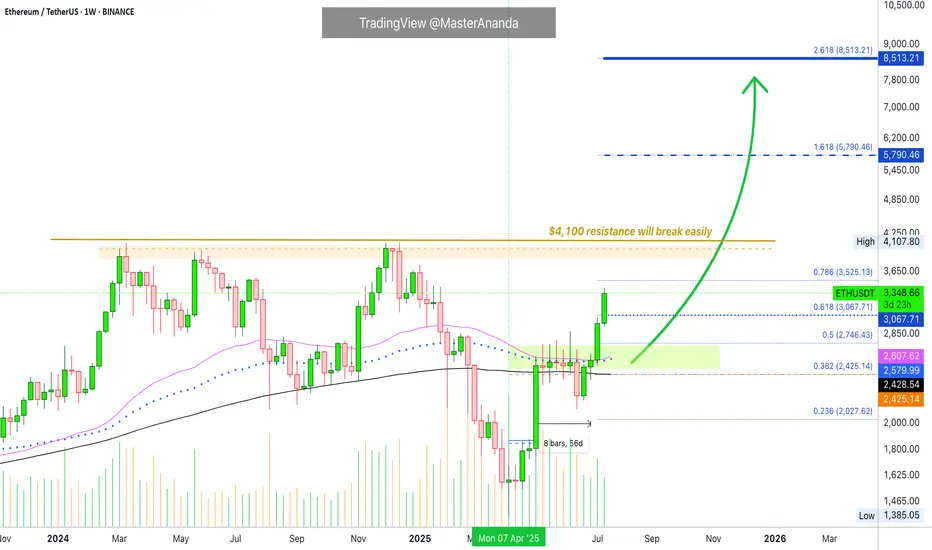
Ethereum · Going beyond $5,790 · $8,513 Next TargetThe eight weeks of consolidation, 56 days, happened as compressed (sandwich style) action right in-between MA200 and EMA55/89.
The EMA55/89 duo worked as resistance while MA200 worked as support.
Before a major move the market always tends to produce a form of shakeout. Sometimes it is call a bear-trap, a shakeout, a liquidity-hunt or stop-loss hunt event, a failed signal, etc.
Here Ether (ETHUSDT) closed below MA200 one week just to recover the next. In this case, we will call it a failed breakdown but we know this is a way to liquidate over leveraged long-traders, also a way to catch unsuspecting bears ready to short. The conclusion is simple, Ether recovered the next week above MA200 and the following week above EMA55/89 which worked as resistance for six weeks. With these levels behind us, the market is full green.
Notice the last two candles, big huge green candle. That is because resistance is no more.
With no resistance to stop prices from rising, Ethereum started to grow and we are now in full blown bullish mode.
The last major high sits at $4,107. This is an easy target, the minimum. Once support is tested the action moves toward resistance and this is where we are headed.
Some people will wonder if resistance will break or hold. Some unsuspecting bears, again, will even short at resistance thinking this is the logical move, they will lose all.
The truth is that this resistance and major high will break easily, we know this based on marketwide action and Bitcoin, Bitcoin is hitting new all-time highs every other day. In this way, we know that Ethereum will soon catch up and do the same.
Many altcoins are moving forward and growing, and some already conquered their December 2024 high price. This is another indication that shows Ether will not stay behind.
Whatever you do when Ethereum goes up, do not short. You can short if you are going to close the short after just a few hours or a few days, but instead of shorting a bullish trend, go LONG and enjoy maximum profits on the way up.
» Ethereum will break $6,000 and move toward $8,500 and beyond in the long-run.
You read it here first.
Thanks a lot for your continued support.
Resistance will break and the altcoins market will continue to grow. Not only for a few months but for a very long time.
When correction time comes, it will last a few months, we will get higher lows and then additional growth. Think of the pattern that came up on Bitcoin but with the altcoins; long-term growth.
Namaste.
ETHEREUM WILL KEEP GROWING|LONG|
✅ETHEREUM is trading in a
Strong uptrend and the coin
Broke the important horizontal level
Of 3000$ which is now a support
And we are very bullish biased
And we think that ETH will
Reach at least the previous ATH
Of just short of 5000$ but the
First target is to reach and break
A resistance level of 4100$
LONG🚀
✅Like and subscribe to never miss a new idea!✅
Disclosure: I am part of Trade Nation's Influencer program and receive a monthly fee for using their TradingView charts in my analysis.

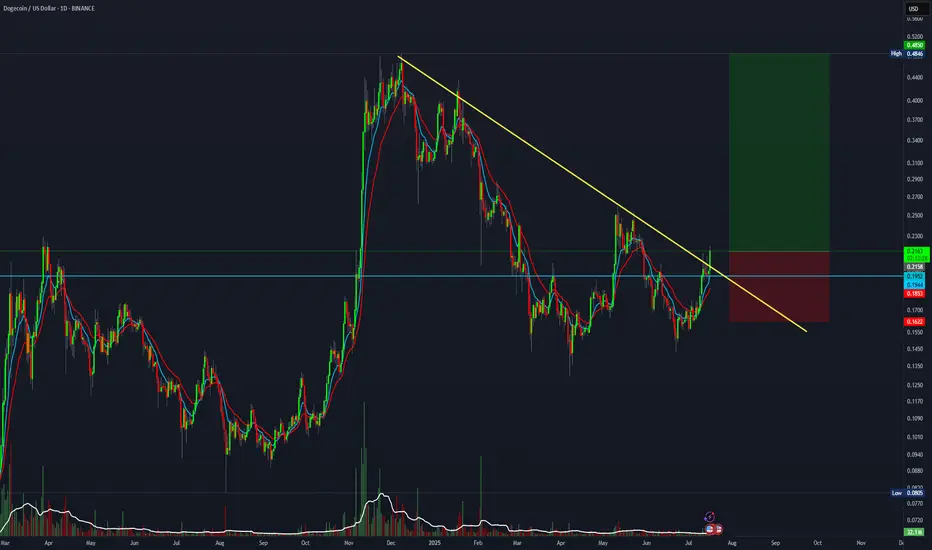
5:1 R:R for Dogecoin.DOGE is breaking out from the trendline. This setup offers a 5:1 R:R
Entry: 0.216
Stop Loss: 0.162
Target: 0.48
HBAR Is About to Melt Faces!I see a powerful reversal coming on HBAR due to a breakout from this falling wedge pattern. A new high above the $0.35 resistance should be coming soon. I’m bullish!
As always, stay profitable.
– Dalin Anderson

BRIEFING Week #29-30 : BTC stalling, ETH & then Alts ?Here's your weekly update ! Brought to you each weekend with years of track-record history..
Don't forget to hit the like/follow button if you feel like this post deserves it ;)
That's the best way to support me and help pushing this content to other users.
Kindly,
Phil

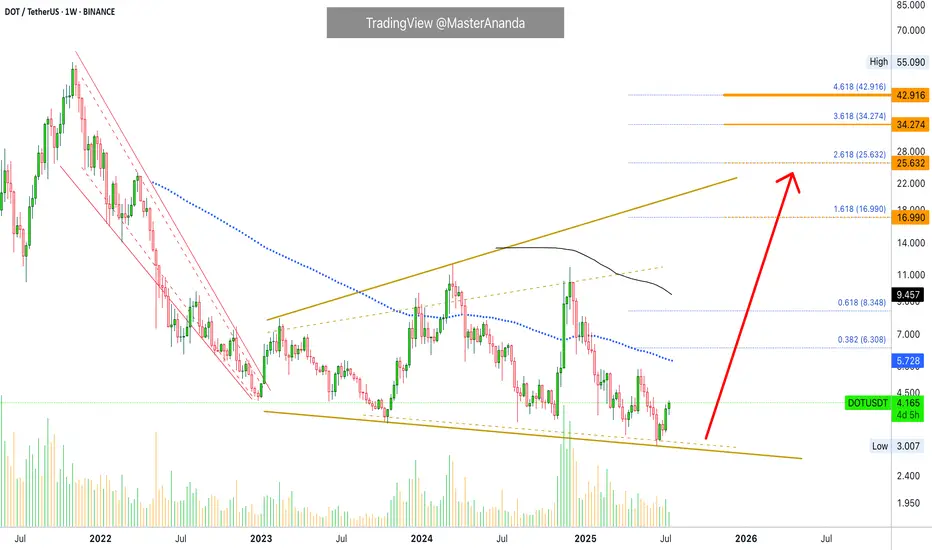
Polkadot Opportunity Buy Zone · Near Bottom · 2025 Bull MarketThis is what I mean: Opportunities are endless in this market. Compare Polkadot to say, Solana or Cardano which I shared just recently. Can you notice the huge difference?
First, Polkadot is still trading below EMA89 and MA200 weekly. Not to be taken as a bearish signal but instead to be interpreted as the pair being very early in its bullish cycle.
While Solana is trading ultra-high, super-strong, one of the strongest pair, which is bad if you want to go LONG (high risk with a small potential for reward), Polkadot is trading within the opportunity buy zone, very close to its bottom (low risk vs a high potential for reward).
I am a buyer. I am a Cryptocurrency fan. I am a bull.
So I want low prices and that is why low prices are good.
This is an opportunity, DOTUSDT. It is trading low now but it won't be trading this low for long, not even weeks. It is likely to start advancing within days. Once the bottom is gone it is gone forever. These altcoin projects will be the new tech giants and they will rise long-term. This is your chance. This is your opportunity for long-term trading success. Once you catch the bottom, you can't go wrong.
The chart is showing a long-term broadening channel. This is part of the transition period, from bearish to bullish, the consolidation phase. While the channel looks pretty big, the swings, if you activate the linear chart you can see the truth. Perspective. You will see a true bottom on the chart. From the bottom we grow.
When the action challenges the lower boundary of the channel, support; the market reverses, in this case Polkadot will start to go up. It is already growing. Several weeks rising. The upper boundary is the minimum giving us more than 425%. But we are not aiming for the minimum, we want high in the least, we want the maximum, so let's go for a new all-time high or just below the last one.
Namaste.
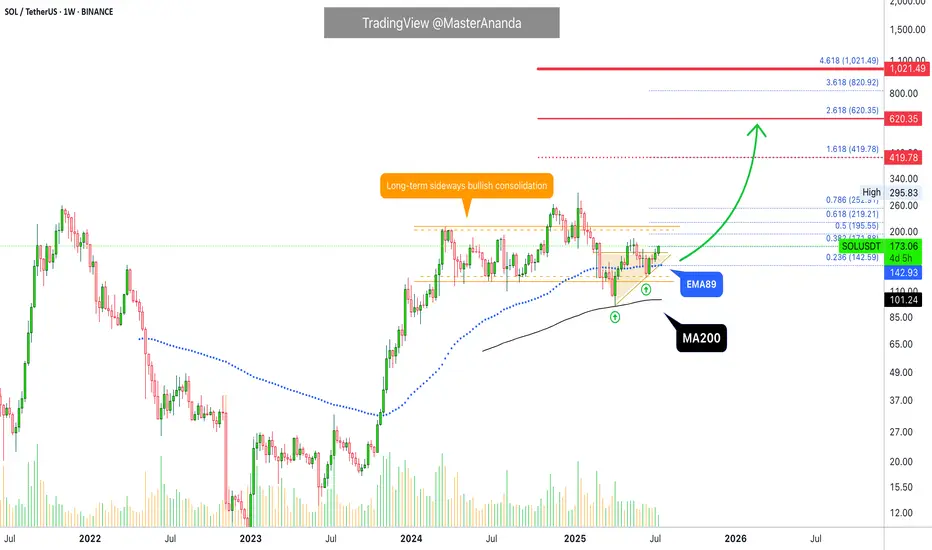
Solana Ultra-Bullish Above MA200 & EMA89 · $1,000 ExplainedOne guy was saying Solana was set to move lower because it already produced a "3,000% bullish wave." What nonsense... Solana is ultra-bullish. We don't do an analysis based on some unintelligent assumption rather, we focus on the data, the signals, the indicators, the chart.
Solana corrected and found support perfectly, exactly at MA200 in April 2025. Boom! It never went below so it was never bearish to start. A true long-term bull market a la Bitcoin.
And more recently, on the 16/23-June weeks, it traded briefly below EMA89 just to recover and later start rising. This is a strong bullish signal on its own. The fact that bears tried to push prices lower and failed; bullish. The fact that there is a strong higher low between the test of MA200 and EMA89. The fact that we can make mistakes with our interpretations but the chart is never wrong.
The fact is that Solana is going up with the next easy but strong target being $420. It can reach, later down the road, $620 and even higher to peak at $1,000+. Can you see what I see? Crypto is going up.
Bitcoin is going up. Solana is going up. Ethereum is going up. Cardano is going up. XRP is going up. Dogecoin is going up. We are going up. The new financial market is growing. It is not just these projects but Cryptocurrency will replace the old financial system, this is another fact. The older system will be left behind because Crypto's market cap. will grow so strong and so fast, maybe a 10 years long bull market will do the trick, we will start with four.
If you want to be high more forever rich, buy Crypto. Solana is a good choice.
Thanks a lot for your continued support.
Namaste.
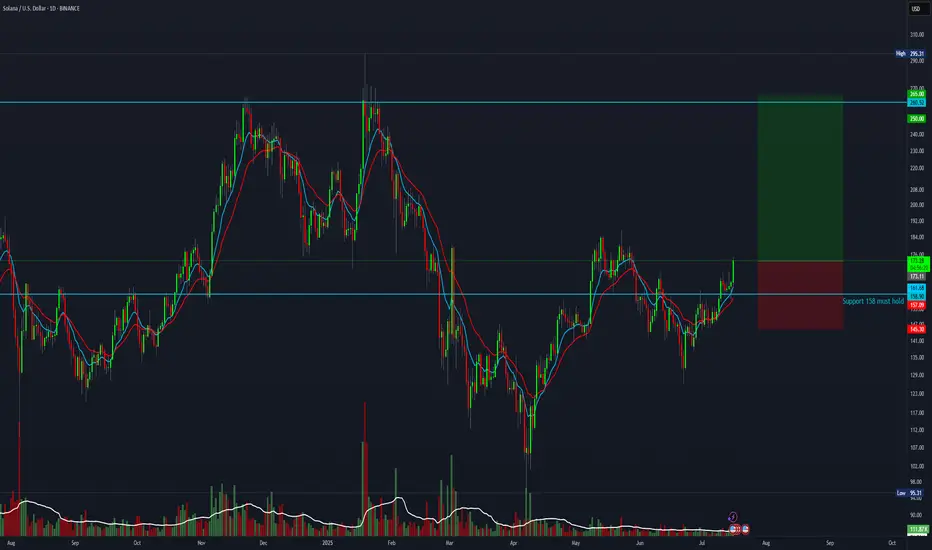
SOL trade setup with a 3.3:1 risk-to-reward ratioThis trade setup offers a 3.3:1 R:R
Entry: 174
Stop Loss: 145
Target: 265
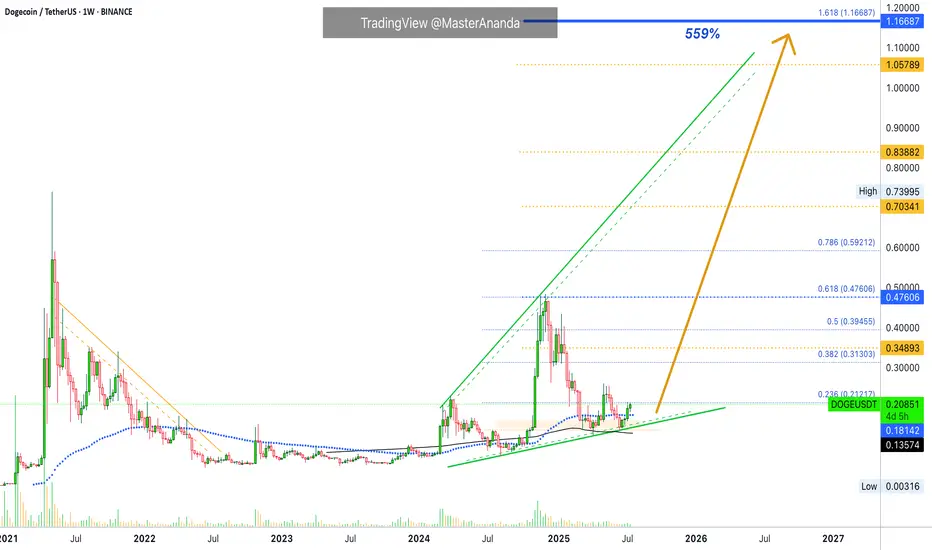
Dogecoin Mid-Term & Long-Term Targets · Advanced Trading TipsNotice here the same price dynamics we just saw with Cardano, the exact same:
» Dogecoin is now on the fourth consecutive green week.
» Dogecoin closed last week above EMA89 on a full green candle.
» Dogecoin is in a rising trend since August 2023 but the market bottom happened in June 2022 rather than 2023. A small variation compared to Cardano but these projects are in the same group, big capitalization, and they tend to move together. What one does, the rest follows.
The situation right now is really really good for this pair. Notice that Dogecoin is not only trading above EMA89 but also above MA200. This confirms that we will experience growth long-term.
The yellow targets are the intermediary targets while the blue ones are long-term. The minimum price Dogecoin will reach in this rise is $1.16. This is based on the long-term, the last all-time high, the previous bull market and the broader cycle. Now, it can definitely move much higher but we start with a strong target that has a high probability of success. Depending on how this level is handled, we can aim higher.
For example: I will always be here sharing charts. If at one point the market goes nuts and you need an update, just leave a comment or send me a message and I will look at the chart and share information based on the present day. Market conditions can always change.
Right now we have to make some wild speculations, still educated guesses but as the bull market is more advanced, we will know with a high level of certainty how far up each pair will go. That is because certain pairs tend to move ahead of the pack, look at FUNUSDT as a good example. It has been moving straight up.
An interesting bit of data. 5-May DOGEUSDT produced its last peak. Some altcoins are already trading above their May's high. This simply means that related pairs, those that move in a similar way, will do the same. This signal works as bullish confirmation, it means Dogecoin will continue to grow, with a high level of certainty, we know this based on price action, the chart and marketwide action.
You can use leverage on this setup even now as long as your liquidation is below MA200 to be safe. Very low leverage because it is already moving. If you do higher you are gambling. If you want to gamble that is also ok but we prefer trading: Low risk vs a high potential for reward and high probability chart setups.
The next leg up is already confirmed. We are moving up within days. The bullish action is already happening, it is already live; four consecutive weeks going up/green. Knowing this, we know the 5th, the 6th weeks and so on are composed of major bullish momentum.
Adapt now. Do whatever it takes, whatever you have to do to maximize profits. Opportunities are endless of course.
While it still early for this and many other pairs, there are some that have even less risk, trading at true bottom and the market will continue to have variations for all types of traders.
You can do great in this cycle.
Never take action on an impulse.
If an idea cannot wait a few hours to be implemented or a few days, then just let it go.
A true, valid and valuable idea will be valid even after the initial rush. They tend to come when everything is calm. If you get impulses when excitement is building up, hype and all that, sit, watch and relax, a shakeout can develop. If you feel like going in now hard, then go ahead, right now nobody is excited and nobody is hyped-up, this means that the market is rising and the bullish bias is confirmed. Only when we are approaching a crash everybody will start talking about forever more. When the market is good and low, nobody cares... If you do, you are already an expert.
Namaste.
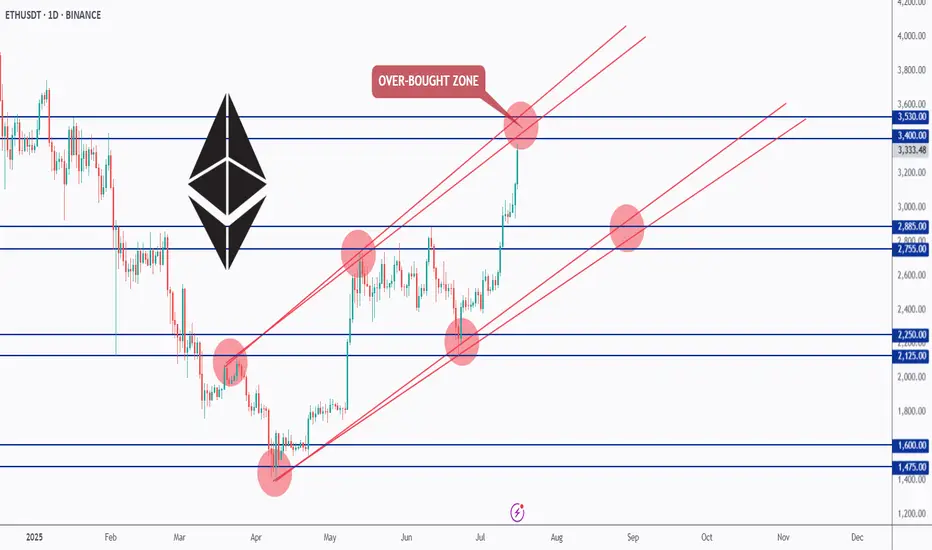
ETH Testing Overbought Zone — What’s Next?📊ETH has been overall bullish, trading inside this rising red channel for months.
After breaking above the $2,885 resistance, bulls took full control, and price is now approaching the upper red trendline — an overbought zone where we’ve seen rejections before.
As long as ETH holds above the $2,885 zone, the bulls remain in control. But since we’re near a strong resistance and the top of the channel, we’ll be waiting for a potential correction or at least a slowdown in momentum before looking for fresh entries.
📌 Key levels to watch:
Resistance: $3,400 – $3,530
Support: $2,885 – $2,755
Let’s stay patient and follow the market’s lead. 🧠
Let me know your thoughts in the comments 👇
📚 Always follow your trading plan regarding entry, risk management, and trade management.
Good luck!
All Strategies Are Good; If Managed Properly!
~Richard Nasr
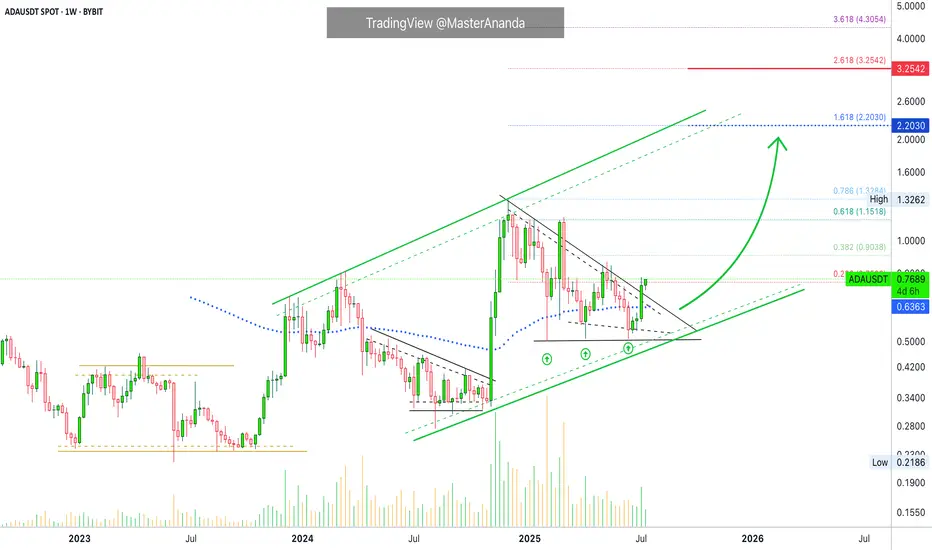
$2.2 Followed by $3.25 · Cardano Trend-Based Fib ExtensionCardano is a on a clear, and very strong, ascending channel rising since June 2023. We are clear, safe and confident about the bigger-broader market trend. An uptrend within a long-term bullish cycle.
After the peak in early December 2024 Cardano struggled to stay above EMA89—the blue dotted line on the chart—but this isn't the case anymore. After a triple-bottom, shy higher lows, last week ADAUSDT managed to break decisively above this level with a full green candle. This confirms the resumption of the late 2024 bullish wave.
Last week resistance was found at 0.236 Fib. extension. The weekly session closed right below it and this is shown as a thin tiny red dotted line on the chart. The current week is halfway through and ADAUSDT is now trading above this level. The bullish signal comes from the fact that the action is happening at the top of the candle; this is the fourth consecutive green week; the bullish bias is fully confirmed.
That is all there is. I just wanted to share a small update in support of our bullish bias based on chart data. You can rest easy knowing that the market will continue to grow.
Next target is $2.20 for 188%. Followed by $3.25 for 325%.
We use leverage on the big projects so the potential for profits can be multiplied by 5, 6, 7, 8, or 10X. The risk is higher of course, but so is the potential for reward. High risk vs a high potential for reward. You can always approach the pair spot if uncertain. If you lack experience but still want to join the ride, enjoy the rise, make money and have fun, you can buy spot, that is, buy and hold. The market will give you money if you are patient enough. This is the period where everything grows. Thanks a lot for your continued support. If you enjoyed the content consider hitting follow.
Namaste.
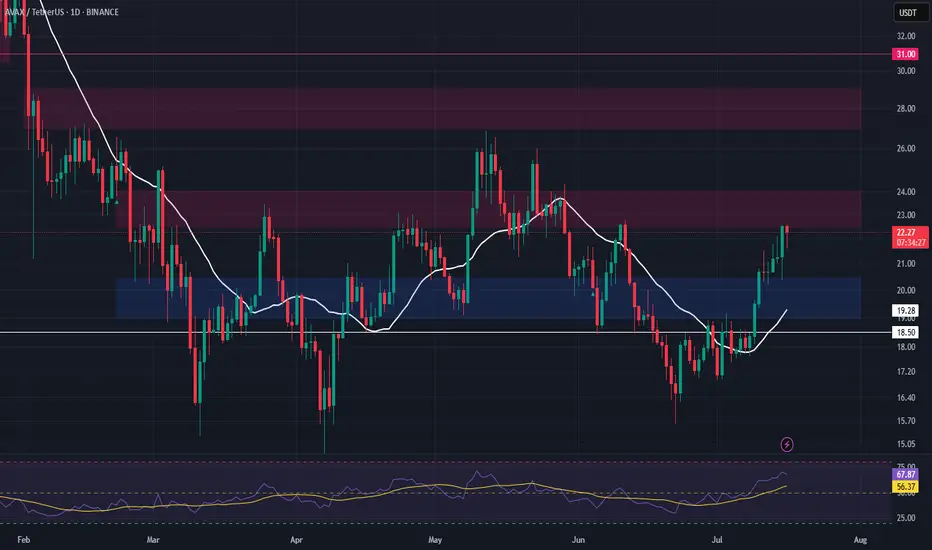
AVAX – Watching for Support Retest After Resistance TestAVAX is currently testing a major resistance level, and we’re anticipating a potential retrace into support. The $19.00–$20.45 zone offers a strong area to enter a long swing position on confirmation of the retest.
📌 Trade Setup:
• Entry Zone: $19.00 – $20.45
• Take Profit Targets:
o 🥇 $22.50 – $24.00
o 🥈 $27.00 – $30.00
• Stop Loss: Daily close below $18.50
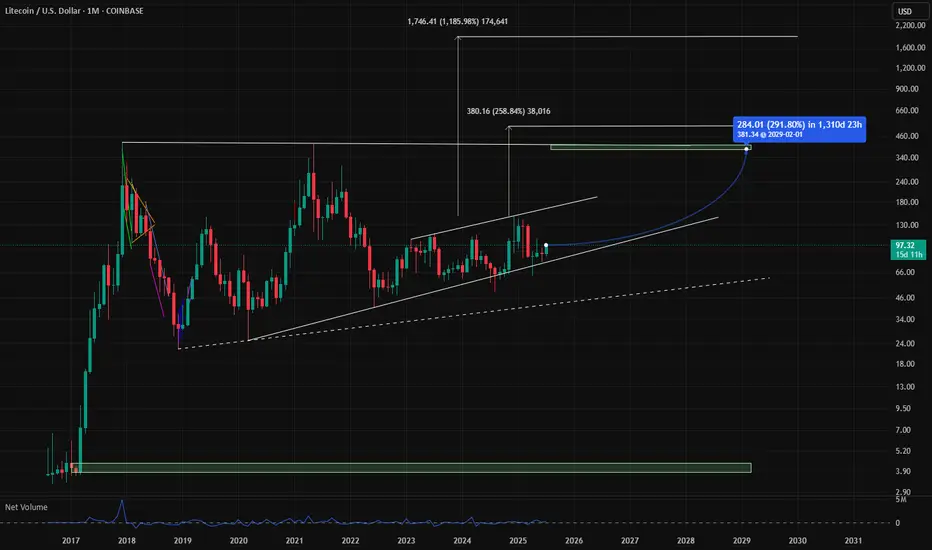
LTC Targets 400$ + 1900$ Litcoin LTC Targets for the next run are atm +290% is a realistic szenario. The addvanced targets at 1900$ are very impressiv but remember there are only 21 Mio. Coins too, like BTC because it is the fork and think about an alternative payment methode like btc, would be a reason for 1900$ pro LTC. So in Crypto is nothing unreal if you could imagine, but first of all approx. 400$ are a good direction. GM
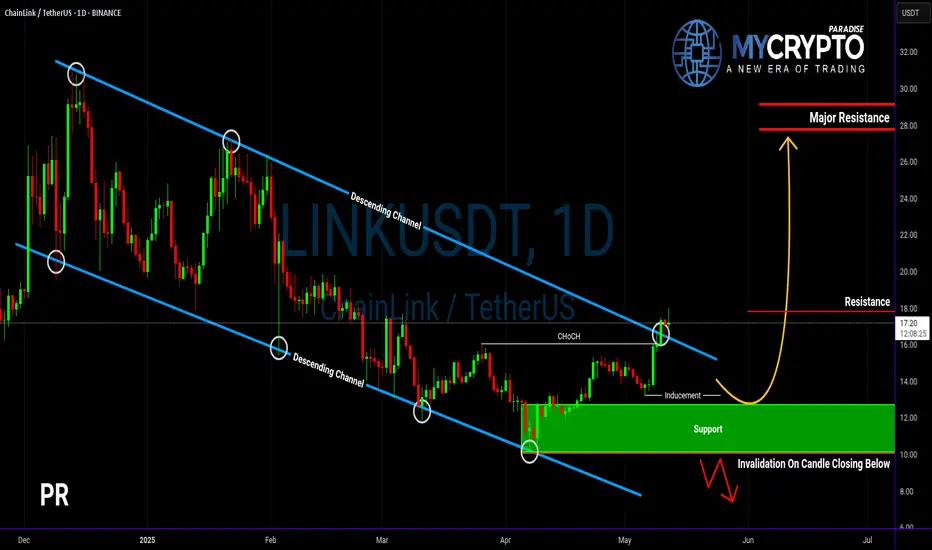
Will LINKUSDT Explode Soon — or Collapse Into a Trap?Yello Paradisers, are you prepared for the next big LINK move? The breakout you’ve been waiting for just happened — but before you jump in, let’s break down what’s really going on behind the chart.
💎LINKUSDT has officially broken out of its descending channel — a significant structural shift that immediately increases the probability of a bullish continuation. On top of that, we’ve seen a bullish CHoCH (Change of Character), a powerful sign that demand is stepping in. These are early but critical signs that bulls may be regaining control.
💎However, experienced traders know not to act on the first sign of strength alone. We now need to see how price behaves on the pullback. If LINK pulls back and takes out the inducement (removing weak hands), we’ll be looking for a bullish internal CHoCH (I-CHoCH) on the 1H timeframe. If that forms, the probability of a solid bounce from the support zone becomes extremely high — giving us the confirmation we need to position for upside.
💎On the other hand, if price breaks down and closes a candle below the support zone, this entire bullish setup becomes invalid. In that case, it would be wise to remain patient and wait for better, more reliable price action to develop before making any move. This is exactly where most traders lose by forcing trades instead of waiting for clear signals.
🎖A big liquidation event, which will first take both longs and shorts and fully get rid of all inexperienced traders before the real move happens, is very close to happening again. so make sure you are playing it safe Paradisers. It will be a huge money-maker for some and a total disaster again for the majority.
MyCryptoParadise
iFeel the success🌴
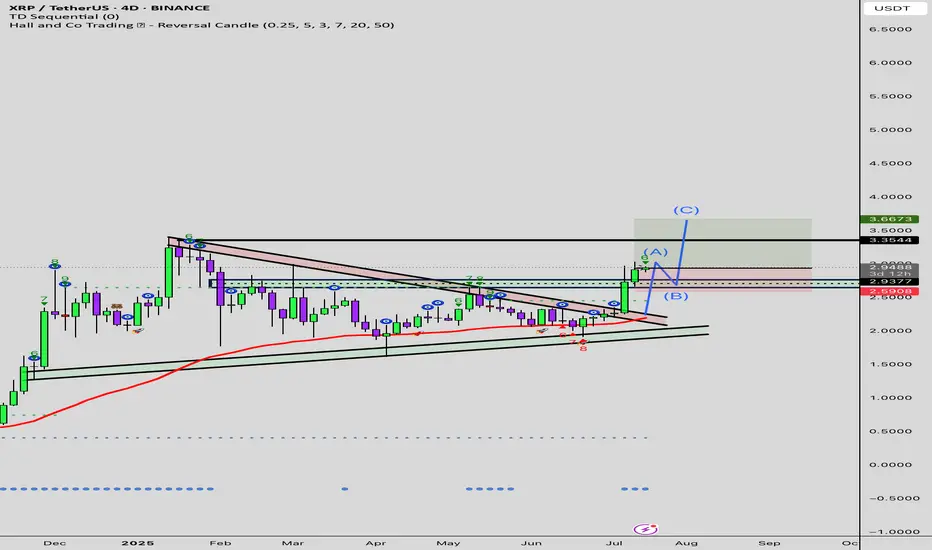
XRP/USD (RIPPLE) BUYtitle: XRP/USD (RIPPLE) BUY
Asset: Crypto
Symbol: XRP/USD
Market Entry Price 1: $2.9450
Limit Entry Price 2: $2.7450
Stop Loss: $2.6450
Take Profit 1: $3.145 (close 10%)
Take Profit 2: $3.345 (close 25%)
Take Profit 3: $3.645(close 50%)
Take profit 4: $3.845 (close 75%)
Let any remaining Xrp run risk free
ETH/USDT : $3000 Reached, It's time foe $4000? (READ)By analyzing the Ethereum chart on the weekly timeframe, we can see that the price has finally broken the strong $2700 resistance and pushed toward the next target at $3000! Currently trading around $3150 and now within the $3130–$3440 zone, I expect a short-term rejection from this area. However, given the overall market trend, this level may not hold for long, and we could soon see a breakout toward the next targets at $3500, $3740, $4100, and $4470!
Please support me with your likes and comments to motivate me to share more analysis with you and share your opinion about the possible trend of this chart with me !
Best Regards , Arman Shaban
THE LATEST ANALYSIS :

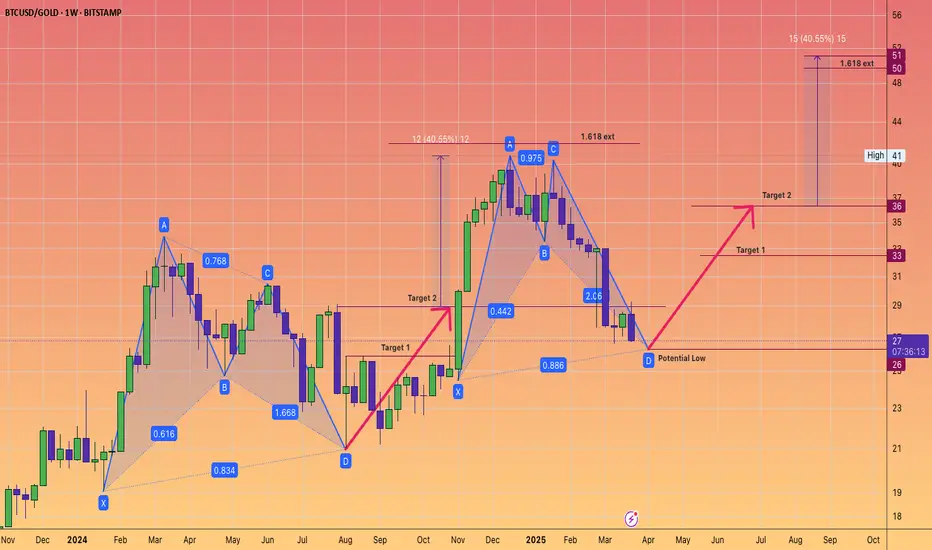
Bitcoin harmonic pattern. Back to back Gartley. BTCGOLD ratio.The BTC/GOLD ratio has experienced a significant correction, currently standing at 27 gold ounces per 1 Bitcoin, down from a peak of 41, representing a decline of 34%.
Gold, priced at $3,114 in US Federal Reserve notes, is in a sustained bull market.
It is reasonable to anticipate that the digital equivalent of gold will gain traction once gold stabilizes at a higher price point.
The Gartley pattern is recognized as the most prevalent harmonic chart pattern.
Harmonic patterns are based on the idea that Fibonacci sequences can be utilized to create geometric formations, which include price breakouts and retracements.
The Gartley pattern illustrated indicates an upward movement from point X to point A, followed by a price reversal at point A. According to Fibonacci ratios, the retracement from point X to point B is expected to be 61.8%.
At point B, the price reverses again towards point C, which should reflect a retracement of either 38.2% or 88.6% from point A.
From point C, the price then reverses to point D. At point D, the pattern is considered complete, generating buy signals with an upside target that aligns with points C and A, as well as a final price target of a 161.8% increase from point A.
Often, point 0 serves as a stop-loss level for the entire trade. While these Fibonacci levels do not have to be precise, greater proximity enhances the reliability of the pattern.
Will these consecutive Gartley patterns succeed in bolstering Bitcoin's strength? We will soon discover the answer.
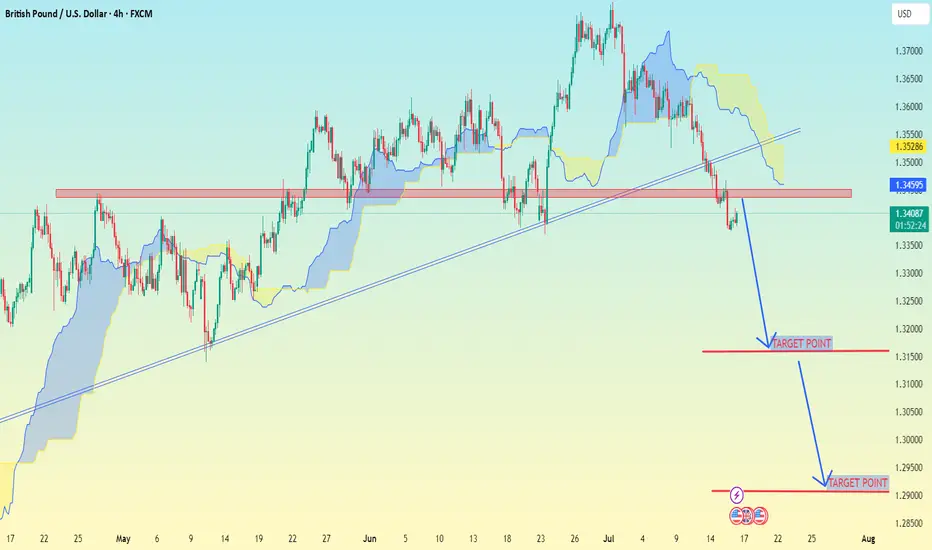
GBP/USD (4H time frame).GBP/USD (4H time frame)
---
📉 GBP/USD Trade Setup – 4H Analysis
Price has broken below a key trendline and horizontal support zone. Current structure shows bearish momentum with clean downside targets.
---
🔻 Sell Opportunity
Entry: 1.34000 (below broken support retest)
Target 1: 1.32000
Target 2: 1.29000
Stop Loss: 1.35200 (above resistance zone and cloud)
---
📌 Analysis Notes:
Price is trading below both the trendline and Ichimoku cloud – strong bearish confirmation.
Retest of broken support/resistance zone has already occurred.
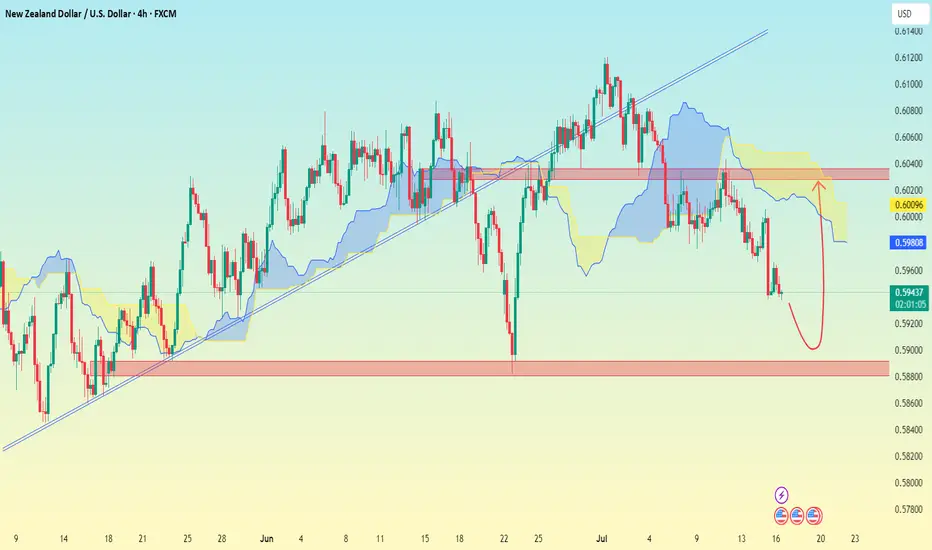
NZD/USD (4H time frame)..NZD/USD (4H time frame), here's the analysis:
---
📉 Chart Analysis Summary:
Price has broken below the trendline and is currently below the Ichimoku cloud, indicating bearish momentum.
A bearish move is likely continuing toward a strong support zone.
A rebound is drawn on my analysis suggesting a possible bounce after reaching a key demand zone.
---
🎯 Target Levels:
🔻 Bearish Move (Primary Setup):
Sell from: Current zone around 0.59400
Target 1: 0.59000
Target 2 (Main Support Zone): 0.58600
Stop Loss: Above the red horizontal resistance — around 0.60000
---
🔁 Possible Bounce Scenario (Secondary Setup):
If price hits the 0.58600 zone and shows reversal signs:
Buy from: 0.58600 – 0.58800
Target: 0.59800 – 0.60000
---
⚠ Key Zones:
🔴 Resistance: 0.60000 – 0.60200
🟢 Support: 0.58600 – 0.58800
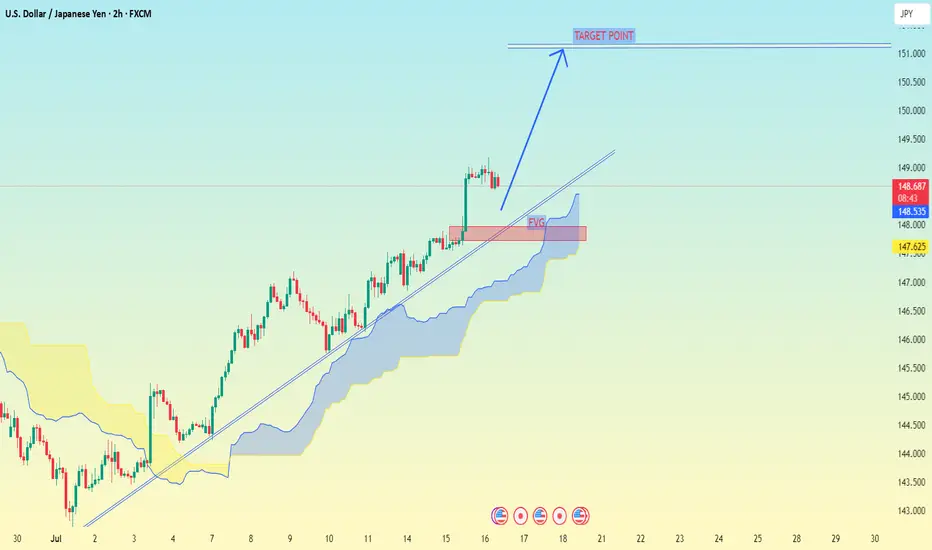
USD/JPY (2H time frame).USD/JPY (2H time frame), here is a breakdown:
📊 Technical Analysis Summary:
The chart shows an uptrend with price respecting a trendline.
Price is currently above the Ichimoku cloud, indicating bullish momentum.
A pullback zone (marked in red) is shown, likely suggesting a buying opportunity.
The chart indicates a projected move to the "Target Point" marked on the chart.
🎯 Target Level:
Target Point = 151.000
📌 Key Zones:
Support Zone / Pullback Entry: Around 147.80 to 148.20
Current Price: ~148.66
Resistance / Final Target: 151.000
✅ Trade Idea:
Buy on pullback near 148.00
Target: 151.000
Stop Loss: Below cloud or trendline, around 147.00
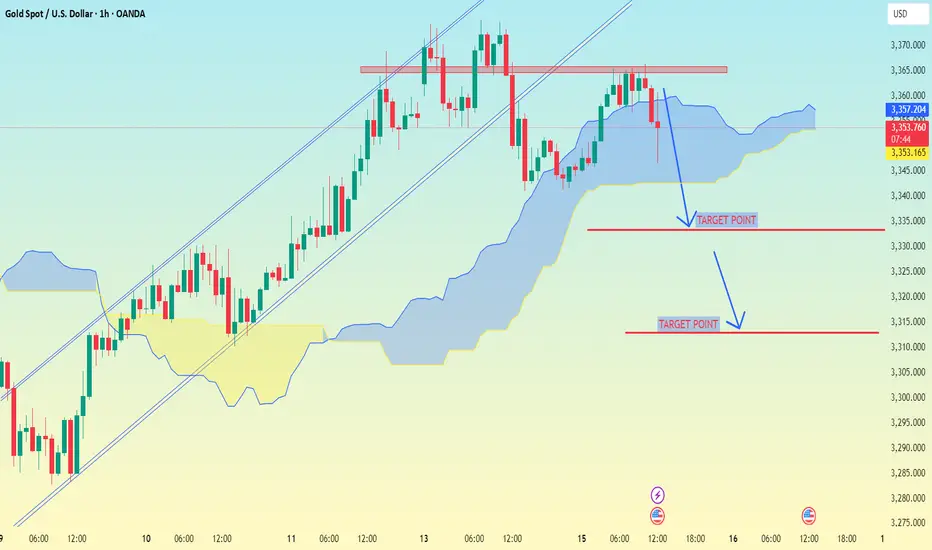
XAU/USD (Gold vs USD) on the 1-hour timeframe..XAU/USD (Gold vs USD) on the 1-hour timeframe, the setup clearly shows a bearish breakdown from an ascending channel, supported by Ichimoku Cloud analysis.
---
📉 Target Points (as marked on your chart):
1. First Target Point: Around $2,335
2. Second Target Point: Around $2,312
---
🔍 Analysis Breakdown:
Price has broken below the Ichimoku cloud – a bearish signal.
The ascending channel is broken to the downside.
Support zones and target levels are clearly marked:
The first target aligns with a previous support level.
The second target is a deeper support area, likely the base of the previous strong rally.
---
📌 Summary:
🥇 First Target: $2,335
🥈 Second Target: $2,312
📉 Bias: Bearish (continuation likely if momentum holds and no strong reversal signs appear)
Let me know if you want suggested stop-loss, entry confirmation ideas, or risk management tips.