Bitcoin to 128kThere is a strong support between 113k to 115k for Bitcoin, as you see that is the 61% of the Fibonacci, and it is just the start for the rally.
Crypto

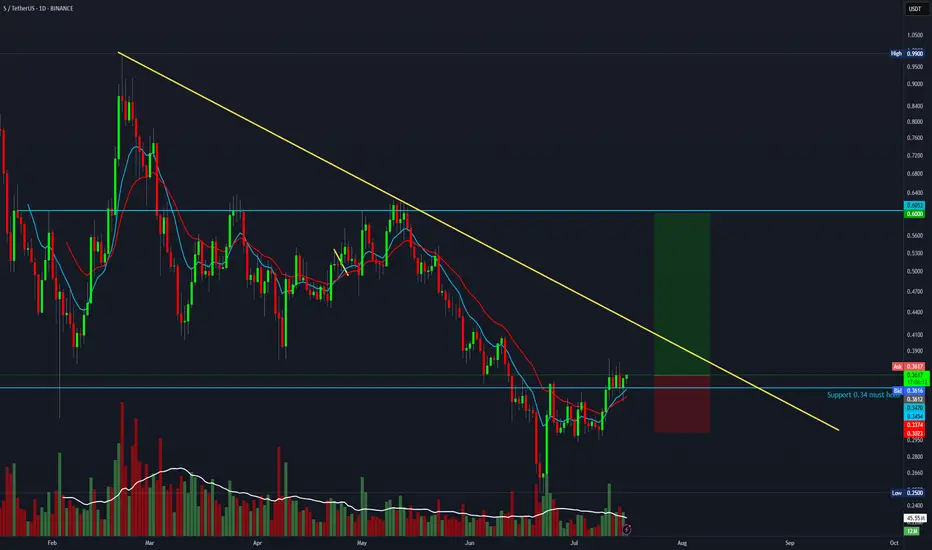
Trade setup with a 4:1 R:R for S (formerly FTM)BTC is likely about to continue its move toward 135K — if you're a bull, this is a solid setup with a 4:1 R:R.
Entry: 0.36
Stop Loss: 0.30
Target: 0.60
OFFICIAL TRUMP Trading Within Opportunity Buy Zone—About To ExitThis is the last chance to get OFFICIAL TRUMP (TRUMPUSDT) within the opportunity buy zone, the best possible entry prices before a major bullish wave.
Good morning my fellow Cryptocurrency trader, this market has endless opportunities to offer. There is always a second chance; it is never too late.
This "Opportunity Buy Zone" has been available only once briefly before the current period. The first three weeks of April. The second entry into the opportunity buy zone within a higher low happened in June and has been active for 41 days. Time is running out.
Since 11-March, when the current zone was activated through present day, we have more than four months. That's four months of consolidation, sideways... The market can remain neutral only for so long, and it isn't bearish anymore.
The downtrend ended with the 7-April low, the big red falling wedge. After this date the market started a recovery and then we have a retrace—the small falling wedge—and within this retrace market conditions remain bullish based on a higher low.
The main low and market bottom happened 7-April 2025 and the higher low 22-June 2025. This means we are already on the bullish train.
The higher low will lead to a higher high which simply means higher prices. Let's skip the technical analysis and move to the good part.
Maximum growth
How do you see the market right now? How do you see TRUMPUSDT?
It is not going to be the same forever actually, we are expecting big change.
All those days going sideways, down, boring, the market retrace; when it changes it will be so much different. Imagine, visualize, 100%+ in a single day. Then repeat this process over and over. Still some swings and corrections, but that is how you get to 1,000%+ or even 2,000% growth in 30 days.
The meat of the bullish move can happen within 1-2 months. It can also take 4-6 months. What happens is that the start date is not the date when prices start to rise fast but the date the market hit bottom. This means that we are already three months in (100 days) into this bullish wave. Why? Because the low happened 7-April. When you get a strong bullish breakout and the market peaks after two months, total duration of the bullish cycle wouldn't be two months but five months.
We are already on the other side. Now that the next low is in, TRUMPUSDT will be moving to produce a higher high.
Patience is key. The best is yet to come.
Hold strong; rest easy... You will be happy with the results.
Namaste.

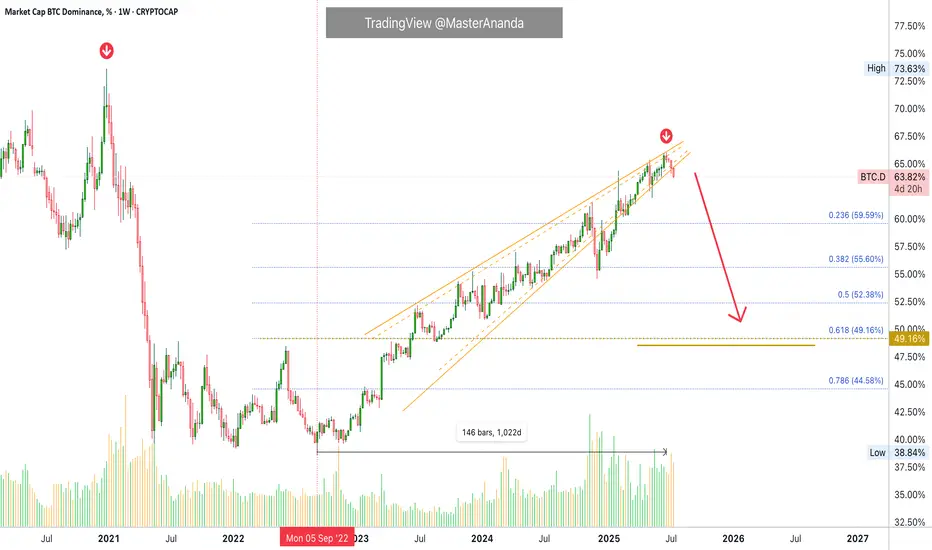
Bitcoin Dominance Long-Term · 1,000 Days Long Uptrend BreaksBitcoin Dominance Index (BTC.D) has been on an uptrend since September 2022, an uptrend more than 1,000 days long.
This uptrend produced a rising wedge pattern and this pattern is as bearish as it gets. During the entire time, from September 2022 until June 2025, BTC.D never ever produced more than 3 consecutive weeks red. Now, in July 2025, we are witnessing the fourth consecutive red week, a major bearish signal. The start of a new downtrend.
The last time BTC.D went bearish was December 2020. The index, as Bitcoin grew to new all-time highs, produced a drop from a high of 74% to a low of 39%. Reflecting strong demand for the altcoins and a very strong rising altcoins market. We are about to witness something similar, better or the same.
As Bitcoin Dominance moves down, the entire altcoins market will move up. Bitcoin will grow together with the altcoins. Everything—Crypto—will grow.
Namaste.
Bullish Altcoins · BTC.D Highest Bearish Volume Since Feb 2021The altcoins market is about to have its strongest and biggest bullish cycle since 2021, or possible ever. We are entering the strongest altcoins season in the history of the Cryptocurrency market.
Good morning my fellow Cryptocurrency trader, I hope you are having a wonderful day.
Bitcoin will continue growing, that's old news but let's start by getting this out of the way.
The altcoins are already waking up from major lows and all-time lows and what follows is something hard to comprehend. The hottest bull market ever for the altcoins. Bitcoin is already far ahead.
On the 14th of July BTC.D (Bitcoin Dominance Index) produced the highest volume bar in more than three years, since February 2021. This happened after a double-top and only after a drop was already confirmed. In this way this signal carries extra-strength. The 14th of July session ended up closing red.
We all know that Bitcoin Dominance Index goes down only when the altcoins move up. The fact that we have the highest volume in years on a daily basis signals the start of the altcoins market major bull-run. Sustained growth for months and months and months.
Get ready and be prepared. The confirmation is already in place.
The altcoins market is heating up. Crypto is going up.
The wait is over.
Namaste.

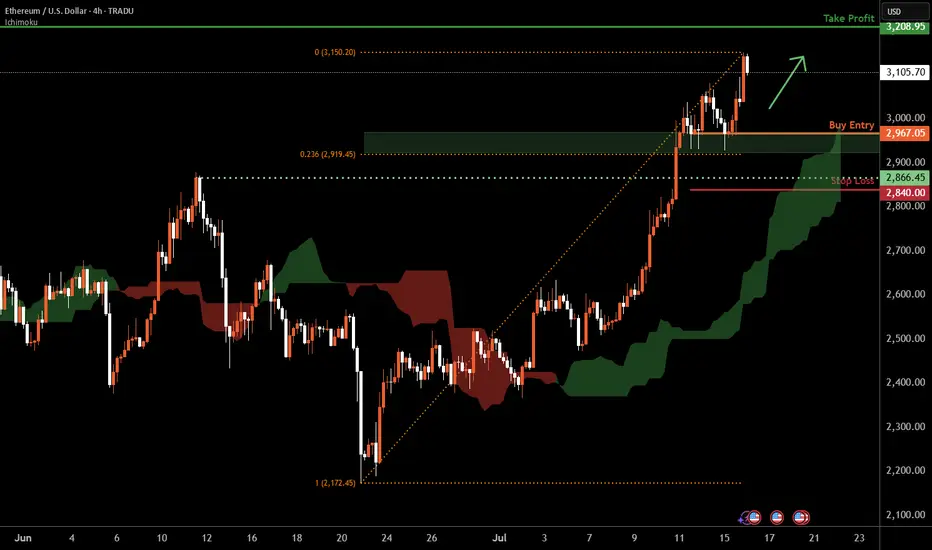
Ethereum H4 | Falling toward a multi-swing-low supportEthereum (ETH/USD) is falling towards a multi-swing-low support and could potentially bounce off this level to climb higher.
Buy entry is at 2,967.05 which is a multi-swing-low support that aligns closely with the 23.6% Fibonacci retracement.
Stop loss is at 2,840.00 which is a level that lies underneath a pullback support.
Take profit is at 3,208.95 which is an overlap resistance.
High Risk Investment Warning
Trading Forex/CFDs on margin carries a high level of risk and may not be suitable for all investors. Leverage can work against you.
Stratos Markets Limited (tradu.com ):
CFDs are complex instruments and come with a high risk of losing money rapidly due to leverage. 63% of retail investor accounts lose money when trading CFDs with this provider. You should consider whether you understand how CFDs work and whether you can afford to take the high risk of losing your money.
Stratos Europe Ltd (tradu.com ):
CFDs are complex instruments and come with a high risk of losing money rapidly due to leverage. 63% of retail investor accounts lose money when trading CFDs with this provider. You should consider whether you understand how CFDs work and whether you can afford to take the high risk of losing your money.
Stratos Global LLC (tradu.com ):
Losses can exceed deposits.
Please be advised that the information presented on TradingView is provided to Tradu (‘Company’, ‘we’) by a third-party provider (‘TFA Global Pte Ltd’). Please be reminded that you are solely responsible for the trading decisions on your account. There is a very high degree of risk involved in trading. Any information and/or content is intended entirely for research, educational and informational purposes only and does not constitute investment or consultation advice or investment strategy. The information is not tailored to the investment needs of any specific person and therefore does not involve a consideration of any of the investment objectives, financial situation or needs of any viewer that may receive it. Kindly also note that past performance is not a reliable indicator of future results. Actual results may differ materially from those anticipated in forward-looking or past performance statements. We assume no liability as to the accuracy or completeness of any of the information and/or content provided herein and the Company cannot be held responsible for any omission, mistake nor for any loss or damage including without limitation to any loss of profit which may arise from reliance on any information supplied by TFA Global Pte Ltd.
The speaker(s) is neither an employee, agent nor representative of Tradu and is therefore acting independently. The opinions given are their own, constitute general market commentary, and do not constitute the opinion or advice of Tradu or any form of personal or investment advice. Tradu neither endorses nor guarantees offerings of third-party speakers, nor is Tradu responsible for the content, veracity or opinions of third-party speakers, presenters or participants.
Chiliz Hitz Bottom · Opportunity Buy Zone (PP: 3,535%)Chiliz is trading at a true bottom right now after producing the lowest price in more than three years. The lowest since February 2021. No need to worry though, an early recovery is already happening and we are sure the bottom is in.
The past three weeks have been green while CHZUSDT managed to close above EMA8. This means that the trend is changing or is about to change and we know it will change because we are right in front of the 2025 altcoins bull market. Chiliz will not stay behind, it will also grow. We don't know how strong but there is plenty of room for rising prices. You will be surprised by what the market does.
What the market does is to condition you in some way. First, you become conditioned to seeing higher prices, unlimited potential and that's the start of the bear market, long-term a downturn. But this isn't the end.
When you are conditioned to seeing the market go down, more down; down, down, down, forever more, then it changes suddenly, as if by surprise and prices start to grow. The growth feels strange because it is something not seen in a while and we wonder, will it last? I don't know.
That's the first answer if you don't have access to years of data and this amazing chart.
Seeing the chart long-term coupled with marketwide action and what Bitcoin does, yes, the market growth will last a long time because an uptrend means higher highs and higher lows.
Right now we are looking at the best possible entry prices, an opportunity buy-zone. Buying now can result in incredible gains in the coming months.
Thanks a lot for your continued support.
Namaste.

zkSynch · 988% in the Coming Months · 2025 Bull MarketHere is another pair that is safely trading above EMA55. Notice that after this level was initially conquered 10-July what followed was a retest. Two red candles pushed prices lower and the level held as support. With this, EMA55 is now confirmed and zkSync can easily grow. Mid-term.
When the trading goes above EMA89 we say the long-term bias is active, and only when the close happens above the next EMA (or MA) we can say the long-term bias is confirmed. Just some technicalities but please, follow me.
We can theorize about the bottom low, the correction & retrace or, we can go straight to just what you want to know. Let me guess... How far up can ZKUSDT (zkSynch) go? Right? Of course!
The new all-time high targets, conservative targets, sit at $0.41 (598%) and $0.65 (988%). There is an easy target before reaching a new ath at $0.18 for 208%. You can use this one if you like to trade more based on the short-term but if you want higher profits you need to aim higher. You have to wait.
The wait is not long because bullish action is already on. It is already happening and will continue to happen; growth will intensify; momentum will grow. Market hype, prices shine, aiming high, ride the ride of your life to a new all-time high.
The timing is right you can't go wrong. There is nothing better than buying today and tomorrow seeing your portfolio 100% up, that's only the start. Expect 20-30X grow by the time the bull market is set and done.
2 months only? I don't think so. Crypto is set to grow long-term.
Plan now, prepare now and reap the reward. Persistence, perseverance and consistency pay. Work hard and smart. Do you what you want. You are blessed and you deserve the best.
Namaste.

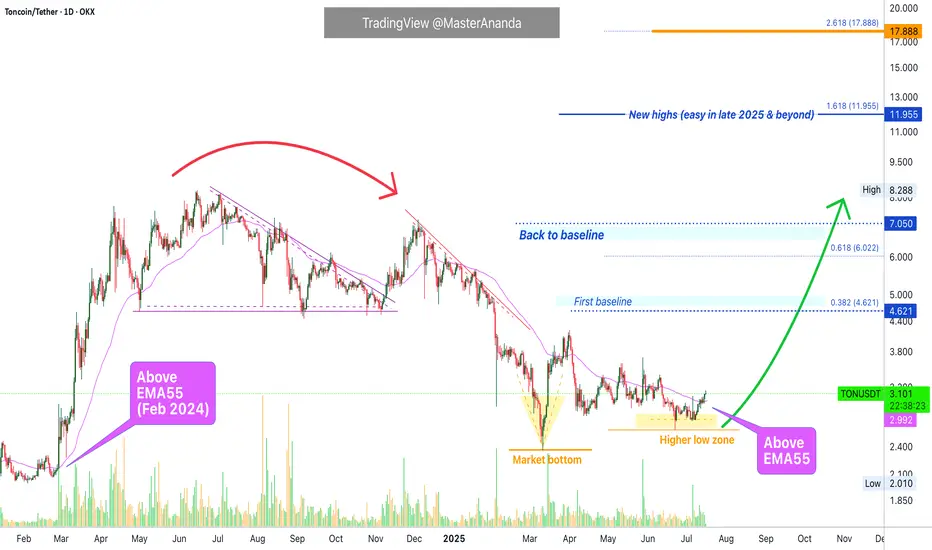
Toncoin Update v2.0 · How To Trade For Maximum ProfitsI am keeping the same chart drawings for simplicity. We continue to move forward on Toncoin and this is one of the trio we track and trade: Notcoin, Toncoin & Dogs.
Daily TONUSDT is now trading above EMA55. When this happened back in February 2024 Toncoin produced its biggest advance ever. The same is likely to repeat multiplied by ten.
(I just updated the targets for your convenience. $12 & $18 have been added to the chart.)
» July 2024 TONUSDT moves daily above EMA55.
» EMA89 is now sitting at $3.10. This resistance level is also about to be conquered. This simply means that the bullish bias is fully confirmed.
» MA200 is still a bit further away but once TONUSDT moves above this level, currently at $3.59, we can expect long-term growth. That is, six months or more. Can be 8, 9, 12, 14, 16, etc. Just beyond six.
"Toncoin will move straight up," this is just a way of saying things. There will always be some days red, some days green, some red some green but the trend, tendency and bias is bullish.
When you see prices rising and you start to enjoying higher profits do not be scared by sudden drops. These are shakeouts and only meant to scare you. Hold strong.
Toncoin can turn red 2 days, 3 days, even 6 days or 9 days and still remain 100% bullish and as soon as the retrace ends you will get additional growth.
It is all fine and great in the Crypto market.
Thanks a lot for your continued support.
Namaste.
Arbitrage Opportunity!I believe I’ve identified an arbitrage opportunity involving the DEFI cryptocurrency: it trades at $0.003200 on Bybit, compared to only $0.002390 on MEXC.
I recall encountering a similar situation with Shiba Inu, when the price gap between Binance and Coinbase was as high as 8X. Feel free to play the chart below to see the outcome:
I also remember the 2016–2017 period, when such arbitrage opportunities existed even with Bitcoin, due to price discrepancies between Asian exchanges and those available to European traders.

CRV ANALYSIS🔮 #CRV Analysis 💰💰
🌟🚀 As we can see that #CRV is trading in a symmetrical triangle and given a perfect breakout. But there is an instant resistance. If #CRV breaks the resistance 1 then we will see a good bullish move in few days . 🚀🚀
🔖 Current Price: $0.7280
⏳ Target Price: $1.0800
#CRV #Cryptocurrency #DYOR

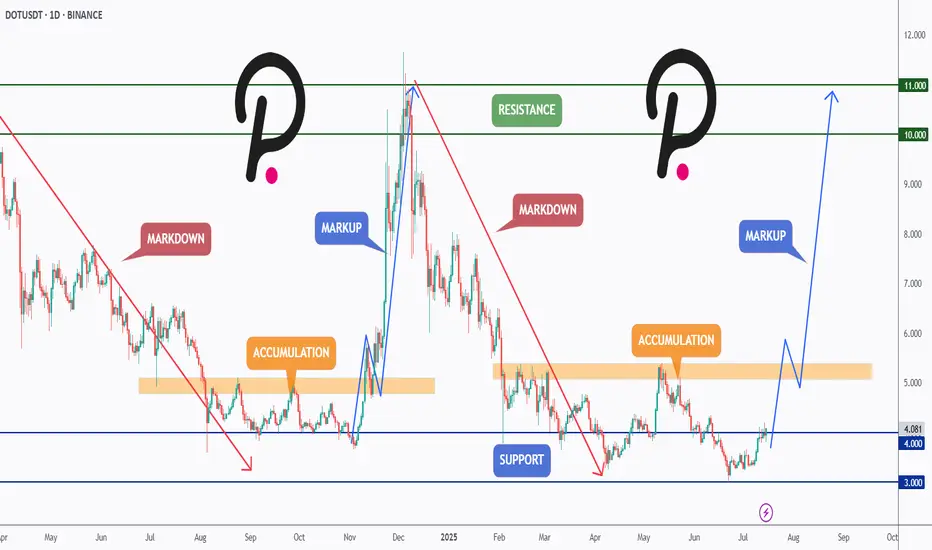
DOT Reloading for Takeoff ?CRYPTOCAP:DOT has been following a textbook Wyckoff cycle — moving from markdown into accumulation, followed by a sharp markup, then another markdown, and once again settling into a fresh accumulation zone.
After retesting the major support at $4 and holding above it, DOT is showing early signs of bullish momentum. If this structure continues, we could be preparing for another markup phase with potential targets at the $6, $10, and even $11 resistance zones.
This setup mirrors the previous cycle — will history repeat itself?
📍 Key Levels:
Support: $4.00 & $3.00
Resistance: $6.00, $10.00, and $11.00
Let me know your thoughts in the comments 👇
📚 Always follow your trading plan regarding entry, risk management, and trade management.
Good luck!
All Strategies Are Good; If Managed Properly!
~Richard Nasr
ETHEREUM WILL KEEP GROWING|LONG|
✅ETHEREUM is going up
Now and the coin made a bullish
Breakout of the key horizontal
Level of 3000$ and the breakout
Is confirmed so we are bullish
Biased and we will be expecting
A further bullish move up
LONG🚀
✅Like and subscribe to never miss a new idea!✅
Disclosure: I am part of Trade Nation's Influencer program and receive a monthly fee for using their TradingView charts in my analysis.

Why XRP Holders Are About to Get Super Rich!I believe XRP is heading into a mass adoption cycle—something even bigger than what Bitcoin saw in 2021. We’re looking at a truly sustainable growth pattern fueled by a longer accumulation phase and crypto being adopted and invested in by major institutions.
This means we could see XRP skyrocket to $22 as my lowest target— and potentially even well over $100 per coin . This coin is truly ready for massive things. Be prepared!
Let me know what you think: Will XRP crash? Or is it heading for mass adoption? Share your thoughts in the comments below.
As always, stay profitable,
– Dalin Anderson

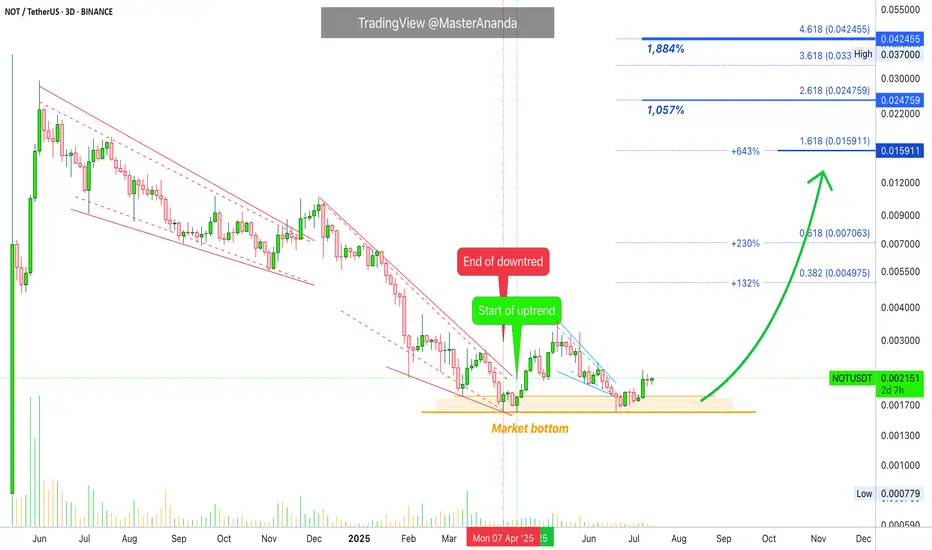
Notcoin 1884% BullishWave · Conservative Target · Will Go HigherThe first very easy target for Notcoin in the coming days will give you 230%, which is amazing because we only saw something similar in May 2024 and rather than just the start it was the end.
Then higher Notcoin will move, 100% certainty, to give you 640% profits or more. This is still easy and short-term, within 30 days or a month. Can extend a bit but there is more.
Long-term for us is within 6 months and this is the time-horizon for all targets on this chart to hit. Very easy indeed. We have 1,057% and 1,884%. Nothing extraordinary, in fact, these are just conservative projections. Notcoin is likely to move much higher in the coming months.
We looked at this pair and recommend 7X to maximize profits, it still isn't too late. If you do decide to approach this market with leverage after reading this, remember to consider the potential risks. Leveraged trading is for experts only and can result in total loss. I cannot be held responsible for your actions. If you lose money and I am responsible, then I am responsible also for any and all wins. But, we are all adults.
This is not financial advice. Just my opinion based on more than a decade of experience with charts, trading, Crypto and Bitcoin. This is not financial advice but you can bet your house that Crypto is going up. Time is running out, Notcoin will be really strong in this bull market. Do what you have to do to take advantage of this information. You will be happy with the results.
Thank you for reading.
Namaste.
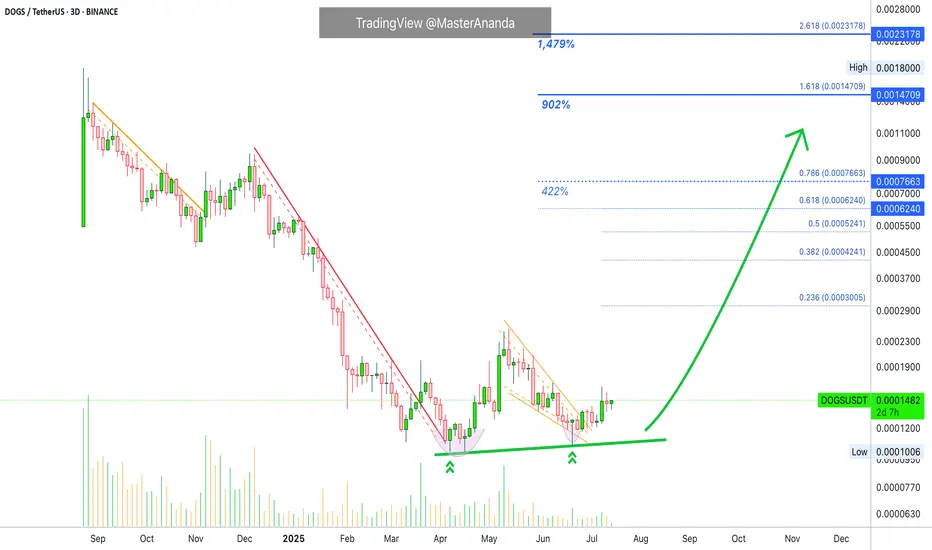
Dogs Update · 1,479% Easy Profits Potential TargetThe first target will be an easy target of 422%. We already talked about creating a position with leverage on this trade. This position is now live and secure, safe and effective, highly profitable with 8X.
Now we are looking at it again because there is still time to have a good entry before a major run. Time is running out though, we have only a few days left. After just a few days, prices will be 100% to 200% up, and then we will see more, more and more. Sustained long-term growth. Additional growth. Higher prices, higher highs, higher heights, forever more.
The bottom and reversal pattern here started in March and the bottom range was activated in February, which means the market is now 162 days sideways at bottom prices. This much consolidation at a market low will result in a massive wave of growth. This consolidation is already over, we just need to see the effect on the market, price and chart.
In a matter of days, one single candle with 3 digits green will change everything and this will happen to hundreds of pairs at the same time. Low prices will be gone but it will be the start of the market euphoria, major excitement and bullish growth.
This is a friendly reminder just to let you know that it isn't too late, but we are running out of time. You will do great. I promise. You have what it takes. It is simple when you know what to expect. Expect growth. Knowing this, you already won.
Namaste.
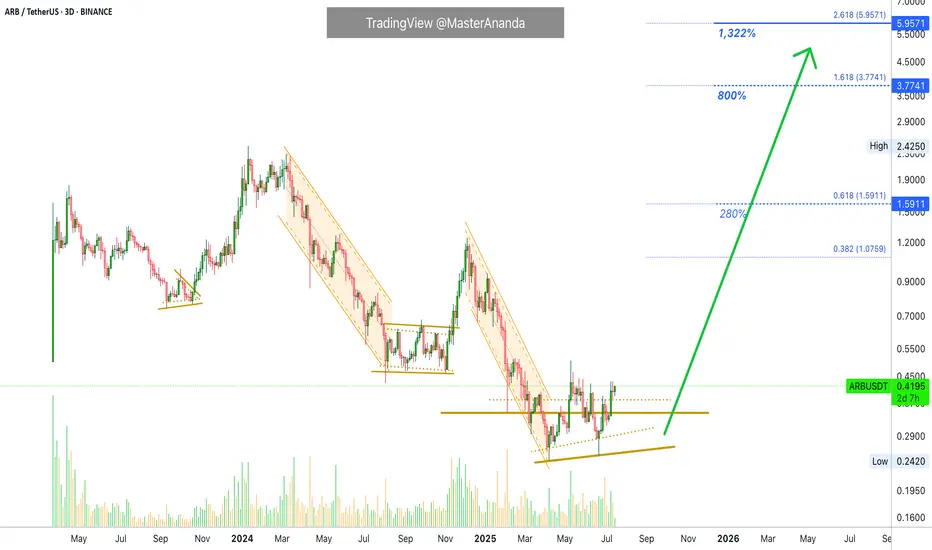
Arbitrum 1,322% Profits Potential · Easy · Crypto is Going Up!This will be intense, truly intense. Arbitrum will perform one of the strongest bullish waves in the entire market. Just one red session and we are back up, back green and ready to move. It will be huge.
This is a big project and yet, we have a standard, easy target, around 1,322%. Such huge potential for growth and there is no doubt now, 100% certainty; you can bet your house on it. We are going up.
When the market goes down, it is unforgiving, it gives no break. It goes down and down and down long-term.
When the market goes up, it is unforgiving, it gives no break. It goes up and up and up, many times higher and much more stronger than any previous bearish wave.
So the market is biased in favor of going up. Just as new all-time lows can be hit on a crash, new all-time highs will be hit during a major bullish impulse. Mark my words.
We are not talking about just "another bullish wave." Not just an "advance." We are talking about the strongest, biggest, longest, exciting and highly profitable bullish phase the Cryptocurrency market has yet to offer. We are talking about exceptional exponential growth. We are talking about a bull market like nothing you've seen before.
Get ready because Crypto is going up.
Namaste.
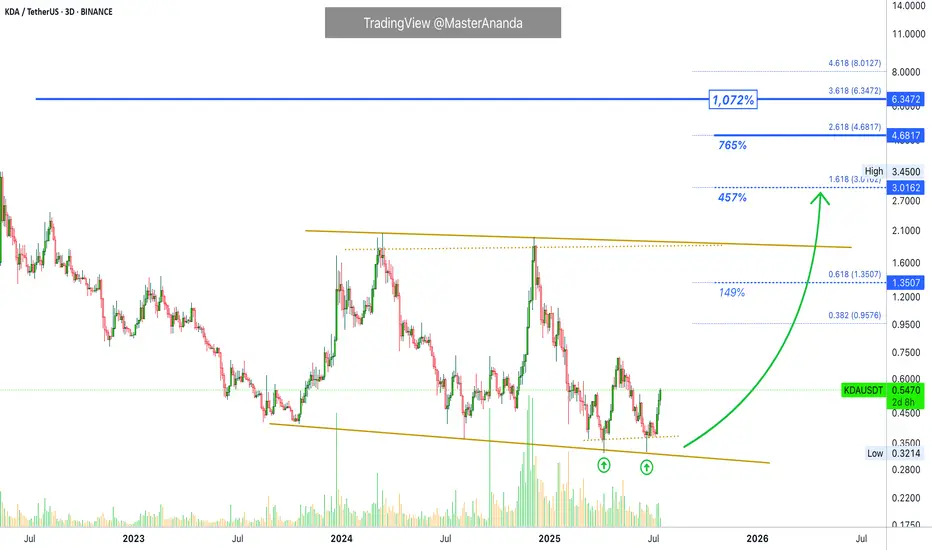
Kadena · 457% First Followed by Additional GrowthWhat should we be calling the first impulse? It is already here.
Good afternoon my fellow Cryptocurrency trader, the altcoins bull market is now.
It is already here. We are now seeing marketwide bullish action. There is only one variant present, one possible outcome only; increased bullish momentum. From now on, you will see daily bullish momentum grow.
Kadena is ready to move higher. The current move will produce a minimum of 450%, and this won't be all this project has to offer, this will signal the end of the first portion of the bullish wave. There will be additional growth after a stop after this first target is hit.
Since 9-July we have only full green candles. There will be more, more and more. Trust and you will be rewarded. Hold now, buy (yesterday), sell in several weeks or in a matter of months. You can sell—when prices are high—just to buy back lower when the correction comes. You can sell and move to a new trading pair because there will be hundreds of options blowing up.
This is just a friendly reminder. The time is now. 100% certainty.
We are moving ahead. Profits are yours to make.
Namaste.
Thena: Hold Until The End (1,337% Profits Potential)Which one will you take? Endless opportunities the Cryptocurrency market has to offer; which one will you take?
Doesn't need to be just one can be many. You can choose many pairs to trade.
Countless opportunities are available now and these will be generating huge profits in the coming days.
The first burst forward will produce 100%, in 1-3 days. And this will be followed by sustained long-term growth. It will grow so much and for so long, that you will become bored. It won't be exciting anymore... Until the correction of course.
Thena here has more than 1,000% potential for growth. Right now this pair, THEUSDT, is sitting on a higher low or double-bottom, in this case it is the same.
This is the same pattern produced by Ravencoin, remember?
That project that grew more than 150% in a single day. "Altcoins Market Bull Market Confirmed, Ravencoin." And it is true, watch everything grow.
This same pattern is present on so many altcoins, not all of them but many and we know exactly what will happen next because what one does, the rest follows.
THEUSDT is about to go bullish, can take a few weeks or less, a few days.
When the bullish wave starts it will go for months, months of sustained growth. You simply hold until the end.
Thank you for reading.
Namaste.

HolderStat┆BTCUSD above $120BINANCE:BTCUSDT has surged past $129,000 following a breakout from long-term consolidation. The chart shows a clean continuation structure with the next resistance between $135,000–$137,000. Momentum remains on the side of bulls.

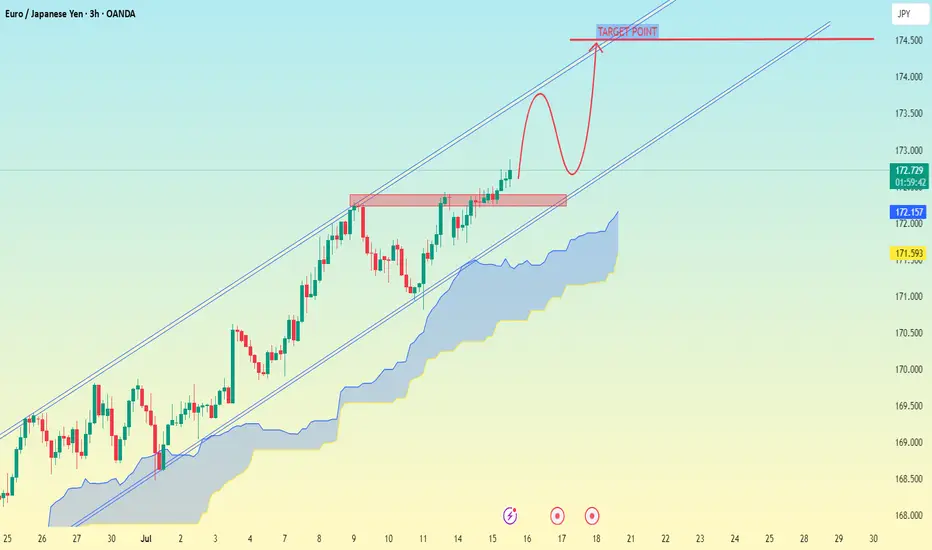
EUR/JPY (Euro vs Japanese Yen) on the 3-hour timeframeEUR/JPY (Euro vs Japanese Yen) on the 3-hour timeframe, the technical setup clearly suggests a bullish continuation inside an ascending channel, with a breakout above a consolidation zone.
---
🎯 Target Point (as marked on your chart):
Main Target Point: 174.500
---
🔍 Analysis Summary:
The price has broken above a resistance zone (around 172.700–172.900).
The chart shows a possible pullback and continuation setup (bullish flag/rounded retest).
The Ichimoku Cloud shows support below, suggesting bullish bias is intact.
The ascending channel remains unbroken and supports higher highs.
---
📌 Summary:
✅ Current Price Area: ~172.70
🥅 Target: 174.50
🔄 Potential Retest Zone: ~172.00–172.30 (marked in red box)
Would you like help with entry strategy, stop-loss placement, or trade management based on this setup?
HolderStat┆ETHUSD prepare for a breakthroughBINANCE:ETHUSDT is trending upward with strong conviction after triangle breakouts and clearing the $2,900 level. Structure points toward a move into the $3,300–$3,400 region. The trend is reinforced by repeated bullish retests and channel momentum.

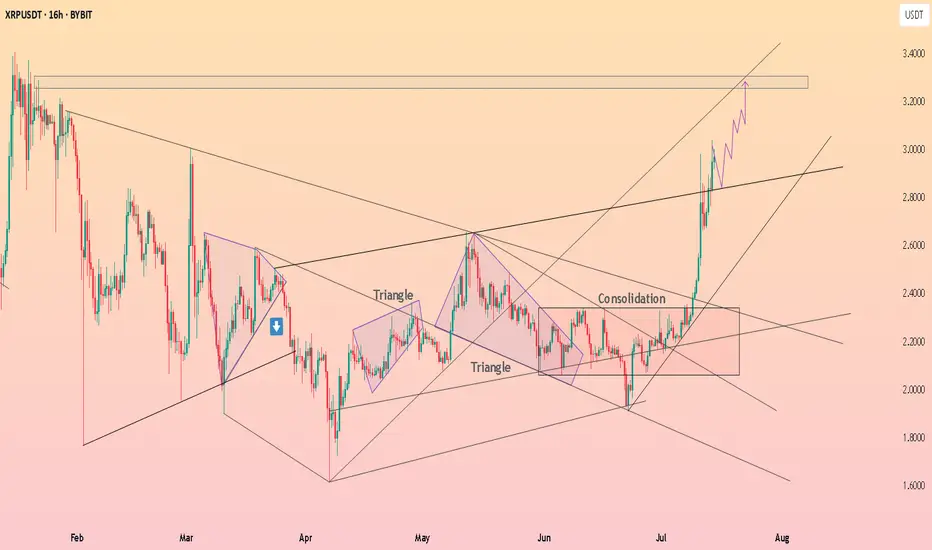
HolderStat┆XRPUSD explosive growthBYBIT:XRPUSDT rallied out of consolidation and triangle formations, driving price quickly toward the $3.20–$3.40 range. The trend remains bullish with structure pointing toward continued upside as long as support holds above $2.80.