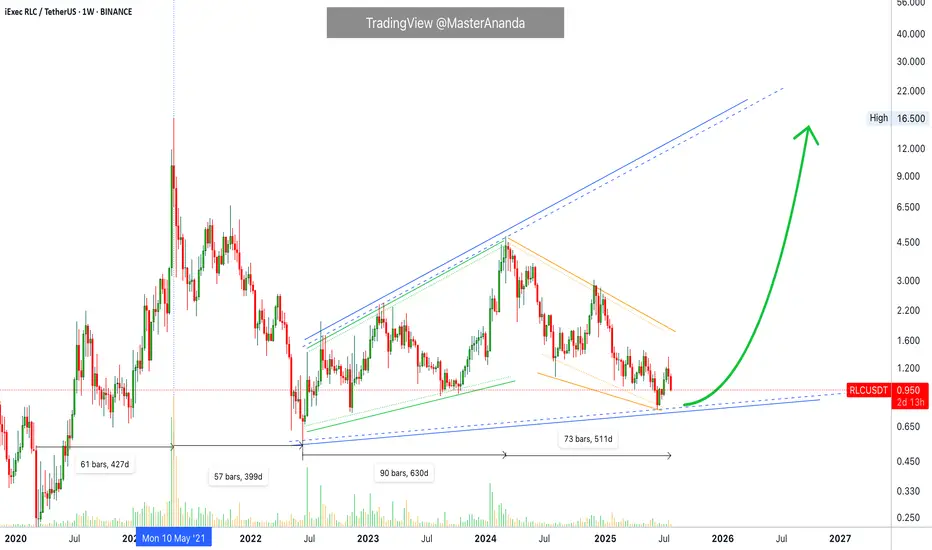
iExec RLC · Trading at Bottom with a Bullish BiasiExec RLC (RLCUSDT) is still trading at bottom prices but the overall market conditions are good. Good for the future because the market moves in waves alternating always between rising and falling.
RLCUSDT went bearish between May 2021 and June 2022, 399 days. Then it went bullish from June 2022 to March 2024, 630 days. Then it went bearish again between March 2024 and present day, August 2025. More than 510 days.
While RLCUSDT has been bearish more than a year, the action is still happening as a long-term higher low. That is, prices today and at the lowest—16-June 2025—are still higher compared to the low in June 2022.
Of course before being bearish in 2022 the market was bullish between March 2020 and May 2021, 427 days. Here we can clearly see the fluctuations between bear and bull, uptrends and downtrends.
The last uptrend came in 2021 and we are due a new one. Crypto grows every four years and market conditions are perfect for the next run. The market has been mixed, sideways and neutral for years on end, the long-term higher low is a single of strength. After the current retrace is over, you can prepare for a major bullish wave.
Namaste.
Crypto
dYdX Bottom Consolidation Continues, Bullish NextHere you are looking at the formation of a bottom. The formation is a process not a single day event. It can take months for a bottom to fully form.
The way you know this to be true is because there is no downtrend. There are no new lows.
DYDX has been sideways now for 179 days, 6 months. Since early February 2025. In just three months, between December 2024 and March 2025, there is a very strong decline; lower highs and lower lows. A bearish move, a down-wave, a downtrend.
Ever since February the downtrend is no more. Rather than new major lows we have shy lower lows and finally not even that, no new lows. You can see the pattern how the market turned from bearish to sideways. This is the transition period. From sideways it will turn bullish, bullish goes next.
This is the point in time when most people will lose patiently and fold at a loss. Sell at the bottom, near support. This is the most important time to be patient, to accumulate, to even buy more and hold because we are looking at bottom prices. When prices are trading at the bottom and you are a bull, you can't go wrong.
Buy and hold. Continue holding because the market will soon turn.
Namaste.

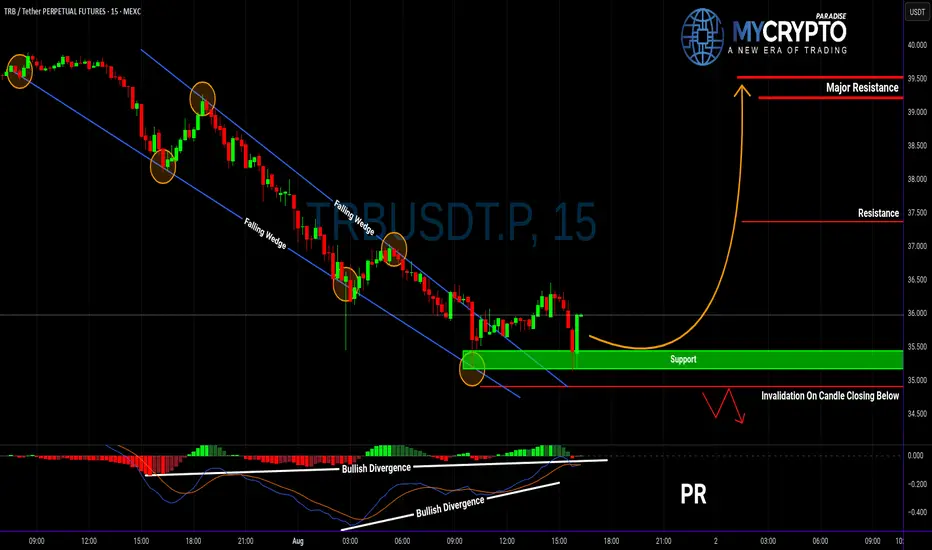
Is TRBUSDT About to Explode or Fake Out Everyone Again?Yello Paradisers! After weeks of quiet price action, is TRBUSDT finally gearing up for a real breakout—or is this just another trap before the next leg down? Let’s break it all down, because the next move could catch many traders on the wrong side.
💎TRBUSDT has recently broken out of a falling wedge pattern, accompanied by a clear bullish divergence—an encouraging sign that momentum may be shifting in favor of buyers. This type of setup historically carries a higher probability of a bullish move, especially if the breakout holds above key support levels. However, the entry strategy here is critical.
💎Ideally, we want to see a minor pullback. If that happens, it could offer a solid bounce opportunity from well-defined support zones, giving a favorable risk-to-reward setup. This is the scenario where patient traders will find the highest probability entries. On the other hand, aggressive traders might consider entering from current levels, but they must understand that doing so offers a less favorable risk-to-reward ratio. Jumping in too early without a clear confirmation could expose you to unnecessary risk, especially if the market reverses quickly.
💎More importantly, we have a clearly defined invalidation level. If TRBUSDT breaks below that level and closes a candle beneath it, this would invalidate the current bullish setup completely. In such a case, the best course of action would be to step aside and wait for a new structure or more reliable price action to form. Forcing trades in uncertain territory is how capital is lost and confidence shaken.
Strive for consistency, not quick profits. Treat the market as a businessman, not as a gambler. Protecting your capital and waiting for high-probability opportunities is what separates professional traders from the rest. Patience here could be the difference between a calculated win and a costly mistake.
MyCryptoParadise
iFeel the success🌴
SOL/USDT | NFP Volatility Could Trigger Drop Toward $154!By analyzing the Solana chart on the daily timeframe, we can see that the price is currently trading around $169. If it fails to hold above the $168 level, a deeper drop could follow. With the upcoming NFP data release, increased volatility is expected across the markets. If Solana begins to decline, the potential correction targets are $163, $157, and $154. Watch the $145–$154 zone closely for a possible bullish reaction and buy opportunity.
Please support me with your likes and comments to motivate me to share more analysis with you and share your opinion about the possible trend of this chart with me !
Best Regards , Arman Shaban
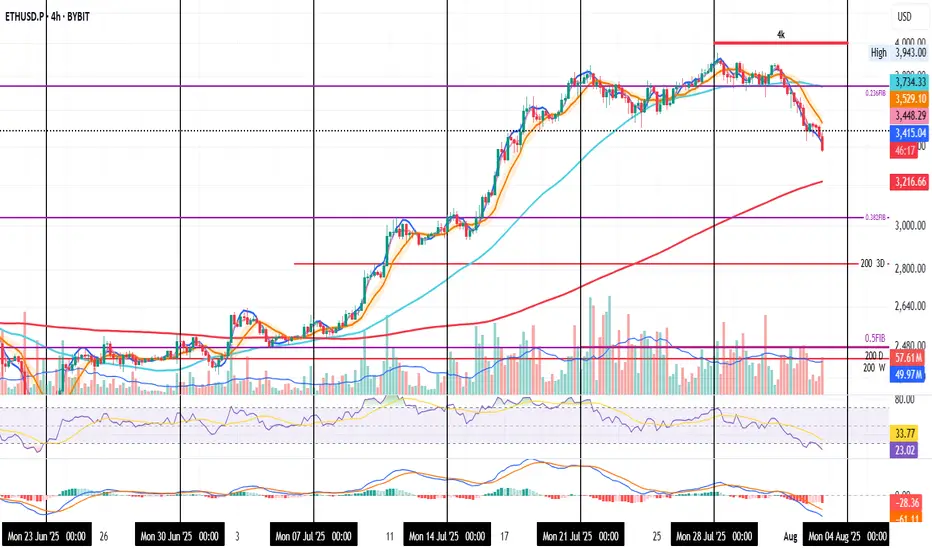
ETH/USDT | ETH Under Pressure – Watch $3500 Support!By analyzing the Ethereum chart on the weekly timeframe, we can see that after reaching the $3940 zone, ETH faced selling pressure and is now trading around $3540. If the price fails to hold the key $3500 support, a deeper decline is likely, with potential targets at $3040 first and possibly $2680 as the second bearish target.
Please support me with your likes and comments to motivate me to share more analysis with you and share your opinion about the possible trend of this chart with me !
Best Regards , Arman Shaban

ZRX to $1 ZRX is consolidation at the very bottom price, and with alt-season hopefully get a rally to $1

Bitcoin willIt hold if we stay above $115k ?? Fixing up last post I’ve deleted now as image was not good. Anyway simple RSI and Auto Fib Retrace with only general CRYPTOCAP:BTC market understanding backing this. This isn’t finacial advice at all. It’s pure speculation this post and anything related to it. I’m
Not a finacial advisor and I will not be held accountable for anyone’s actions that I didn’t do.

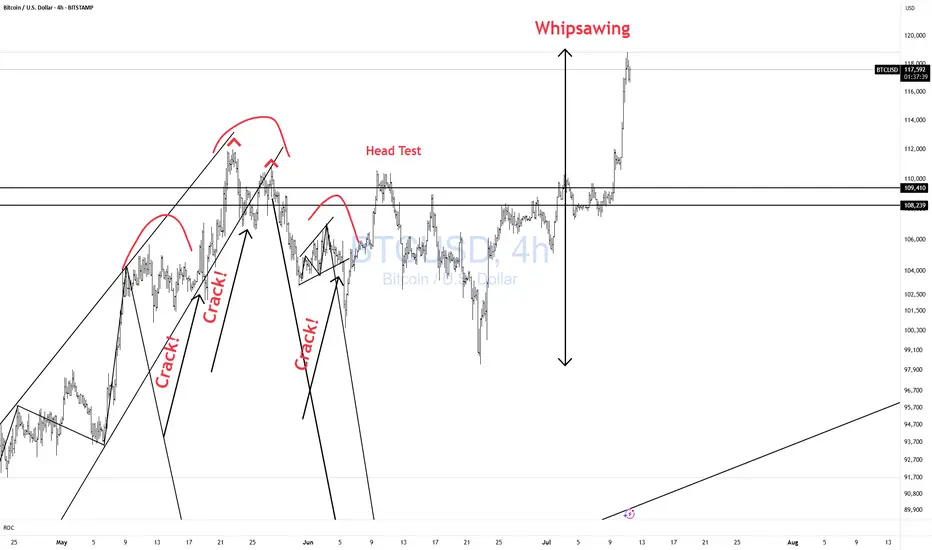
BTCUSD Whipsawing! CAUTION!Bulls CAUTION! Price is whipsawing all over the place.
Better to be out of the market wishing you were in than in wishing you were out!! Don't chase!!
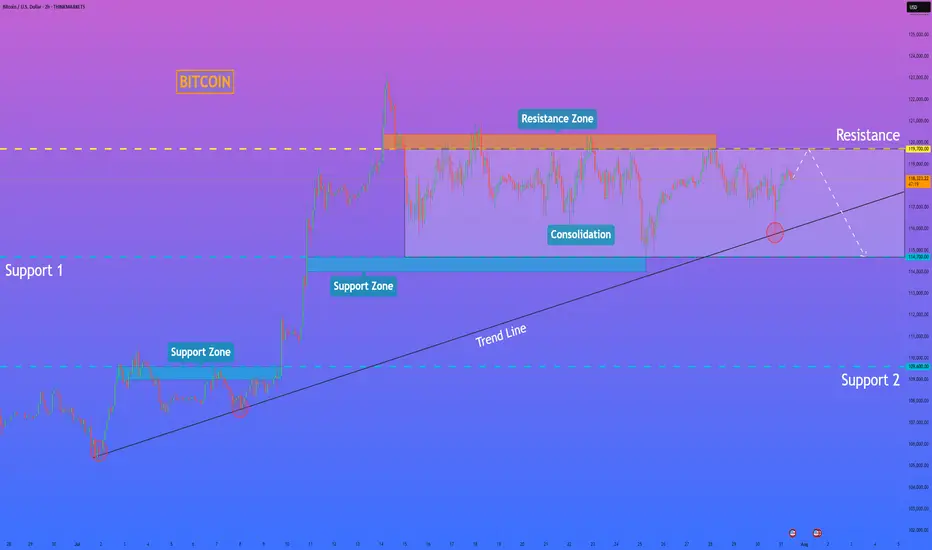
HelenP. I Bitcoin will rebound down from resistance levelHi folks today I'm prepared for you Bitcoin analytics. A technical review of the chart reveals a prolonged period of horizontal consolidation, during which the price has been trading within a well-defined range between support at 114700 and resistance near 119700. This phase of balance follows a significant prior uptrend, and a major ascending trend line is currently intersecting this range. My analysis for a short position is based on the expectation of a final 'test and fail' at the top of this consolidation. I believe the price will make one more attempt to rally towards the resistance zone around 119700. A strong rejection from this area, demonstrating sellers' control, would serve as the main confirmation for a bearish bias. Such a rejection would likely initiate a powerful downward move across the range, with sufficient momentum to break the critical ascending trend line. This would be a significant structural event, signaling a potential reversal of the larger trend. Therefore, the primary goal for this scenario is logically set at the 114700 support level, the bottom of the consolidation range. If you like my analytics you may support me with your like/comment ❤️
Disclaimer: As part of ThinkMarkets’ Influencer Program, I am sponsored to share and publish their charts in my analysis.
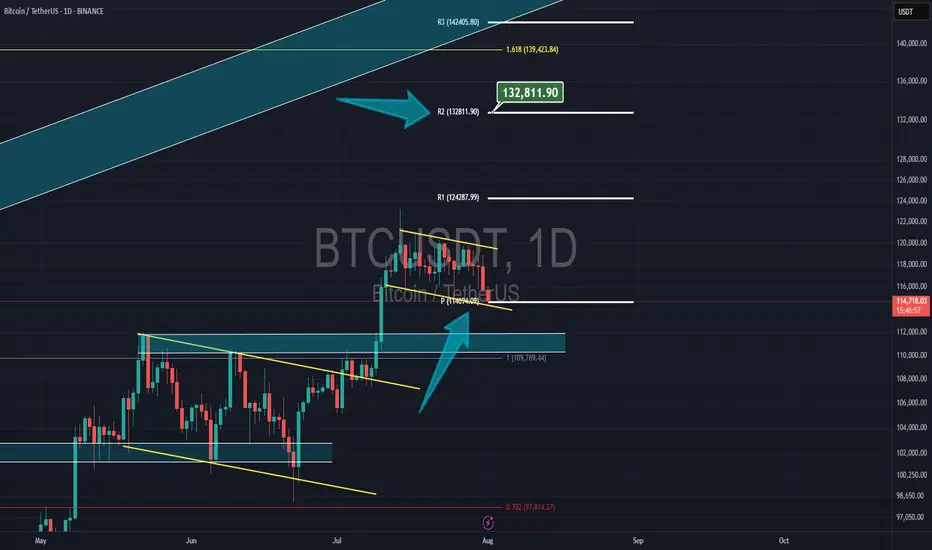
Bitcoin & NEW monthly PivotBitcoin had a correction yesterday but now its still above the new monthly pivot at $14,700 and my target is the 2nd resistance of the pivot at $132,800
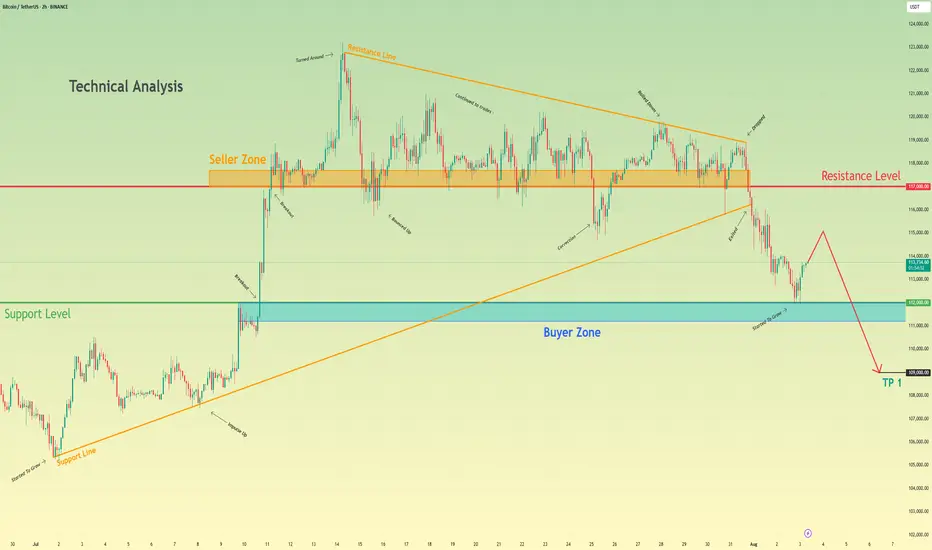
Bitcoin can continue to decline and break support levelHello traders, I want share with you my opinion about Bitcoin. Following an earlier upward trend, bitcoin entered a prolonged phase of consolidation, forming a large upward pennant where price action was tightly contested between the seller zone near 117000 and an ascending support line. This period of balance, however, has recently resolved to the downside with a significant change in market structure. A decisive breakdown has occurred, with the price breaking below the pennant's long-standing support line, signaling that sellers have ultimately gained control. Currently, after the initial drop, the asset is undergoing a minor upward correction, which appears to be a classic retest of the broken structure from below. The primary working hypothesis is a brief scenario that anticipates this corrective rally will fail upon encountering resistance from the broken trendline. A confirmed rejection from this area would validate the bearish breakdown and likely initiate the next major impulsive leg downwards. The first objective for this move is the buyer zone around the 112000 support level, but given the significance of the pattern breakdown, a continuation of the fall is expected. Therefore, the ultimate target price for this scenario is placed at the 109,000 level, representing a logical measured move target following the resolution of the large consolidation pattern. Please share this idea with your friends and click Boost 🚀
Disclaimer: As part of ThinkMarkets’ Influencer Program, I am sponsored to share and publish their charts in my analysis.
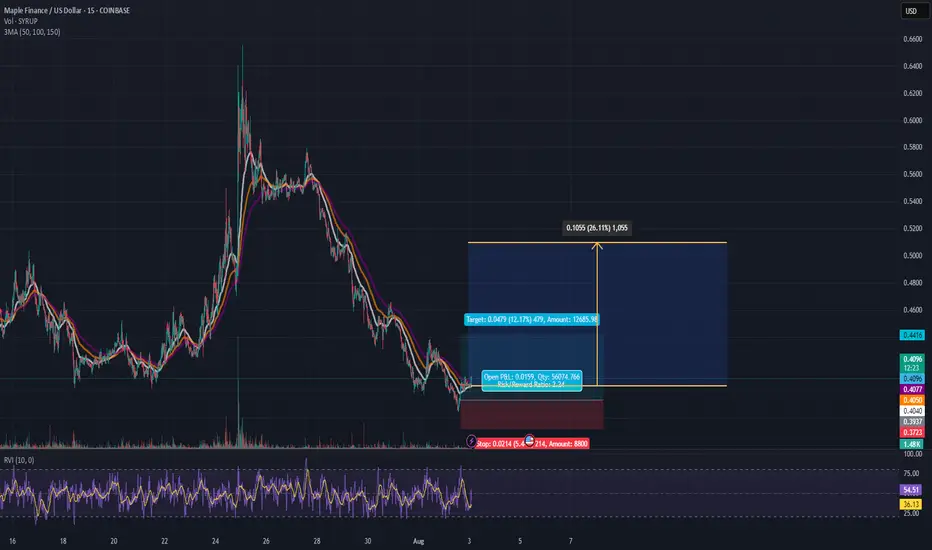
SYRUP Priming for a 12% Pop - Longterm ~20% PotentialHey Guys, My last posts were hidden (Again) ty TV, so I'm back at it and keeping it clean and to the point:
Maple Finance
SYRUPUSD
is forming a base at the $0.40 zone after a steep downtrend. Looks like the bleeding's slowing down and we're seeing signs of accumulation.
🍯 Entry: $0.402 - $0.4045
🛑 Stop: $0.3825 (5.4% risk)
🎯 Target 1: $0.4479 (+12.1%)
🚀 Target 2: $0.5100 (+20.6%)
📐 R/R Ratio: ~2.2
This is a structure-based long setup:
Flattening EMAs
Volume compression
Lower wick absorption (buyer presence showing up quietly)
💡 Target 2 ($0.5100) is not a short-term scalp – that's the stretch target IF this turns into full accumulation. Full exit at T1 is a solid take.
More setups on the way.
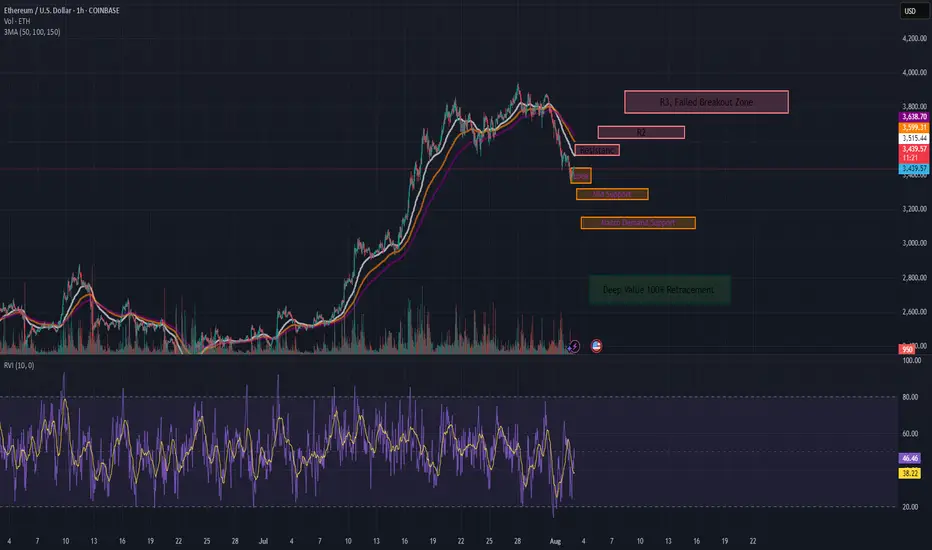
ETH Tactical Long: Laddered Bounce from Absorption ZoneCOINBASE:ETHUSD has been in a steady 1H downtrend, but key support at $3,440 is showing signs of absorption. Volume is thinning on sell-offs, and we're seeing early reversion signals.
This is my over the weekend analysis, not a final recommendation.
Setup Type: Mean Reversion / Absorption Bounce
- Trend: Still bearish on 1H (below 50/100/150 MAs), but slope compression hints at weakening
momentum
- RVI: Below 50, but curling up → early bounce bias
- Volume: Sellers fading into $3,440 = buyer absorption zone
📊 1hr Quant Entry Levels & Laddered Plan
Zone Type Action
$3,440–3,435 Primary Entry Base long entry zone 🔄
$3,420–3,410 Add-on Entry Optional bid stack 🧱
$3,320 Soft Invalidation Trend continuation if lost 🚫
$3,150 Deep Value Wick Low-prob, high-juice trap 💎
🎯 Targets:
T1: $3,515 → EMA cluster rejection zone
T2: $3,600–3,638 → Range midpoint
T3: $3,800 → Trend reversal if reclaimed
⚖️ Risk/Reward: 1:2.5+ (depends on fill ladder)
We are starting entries here, but be cautious if we break through our support levels and you don't have the appetite for the deep value range it may be wiser to wait for a confirming trend or post.
Swing opportunity on cluster support, technical & macro plan__________________________________________________________________________________
Technical Overview – Summary Points
__________________________________________________________________________________
Momentum : Tech sector bias supportive on higher timeframes (Risk On / Risk Off Indicator “Buy” on 1D/12H) despite MTFTI “Down” on intraday (15min to 6H).
Key Supports : Major cluster at 111,900–112,772 (W Pivot High, 12H/24H Pivot Low). Critical defense short/mid term.
Resistances : 114,723, then 115,900, then 119,800–122,318 (break to relaunch impulse).
Volumes : Moderate to normal across all timeframes: no panic or capitulation.
Multi-TF Behaviour : ISPD DIV neutral everywhere: neither fear nor euphoria; wait-and-see market. No climax nor emotional extremes: conducive to squeeze or extension after catalyst.
__________________________________________________________________________________
Strategic Summary
__________________________________________________________________________________
Global Bias : Neutral to cautious bullish if 111,900–112,772 holds (invalidate if <111,900).
Opportunities : Defensive swing long entries on support. Gradual targets: 114,723, 115,900, 119,800–122,318.
Risks : Daily/4H close below 111,900 = acceleration towards $110k/$105k (on-chain air-gap).
Macro Catalysts : Geopolitical tensions (Gaza/Ukraine/China), China crypto ban headlines, sector decoupling, Fed/BoE policy.
Action Plan : Strict stop management (<111,750), agile on volume/ISPD signals. Critical macro monitoring: any exogenous move can trigger directional volatility.
__________________________________________________________________________________
Multi-Timeframe Analysis
__________________________________________________________________________________
1D (Daily) : Key support 114,723.2. Tech sector indicator (Risk On / Risk Off Indicator) bullish. MTFTI Up. Normal volume, no panic. Lack of ISPD oversold signal.
12H : Support W Pivot High 111,900 – 12H Pivot Low 111,920. Uptrend, moderately higher volumes, ISPD neutral. Battling for support maintenance and bounce.
6H : Core pivot support 111,900–112,000. MTFTI Down. No volume excess or sentiment signal. End of momentum, increase vigilance.
4H : Weakness confirmed, supports 112,000–112,500, resistance 117,722 to 119,800. Last short-term rampart tested.
2H-1H : Bearish, attacks on 111,900–112,772 supports, immediate resistance at 114,723/115,900. Weak range market.
30min-15min : Neutral, lower range between supports (111,900–112,772) and resistances (113,950–114,723). Volatility on breakout events, no sector bias.
Risk On / Risk Off Indicator : Persistent “Buy” on higher timeframes (12H/1D), neutral/bearish intraday (4H and below).
ISPD DIV : No extremes detected: no exhaustion, panic or major oversold; “range” environment.
Volumes : Normal, no climax or anomaly. Market awaiting a catalyst.
__________________________________________________________________________________
Fundamental, Macro Events, Sentiment Overview
__________________________________________________________________________________
Macro : Newsflow on China crypto ban, multiple tensions (Gaza, Russia-Ukraine), Fed/BoE slowing. Globally cautious setting despite no direct institutional shock.
On-chain (Glassnode) : Major OTC sale (~80k BTC) absorbed, 97% supply in profit: “moderate euphoria” phase, not capitulation; on-chain supports $110–117k, resistance $125–141k, air-gap below $115k.
Twitter : No panic, “final wick” narrative then anticipated technical rebound. No institutional outflows. China ban read as cyclical FUD.
__________________________________________________________________________________
Summary & Action Plan
__________________________________________________________________________________
Support 111,900–112,772 = key multi-TF cluster; area for defensive swing opportunity.
MTFTI is “Down” on lower TF, but Risk On / Risk Off Indicator bullish on daily/12H.
No capitulation, normal volume, market waiting for catalyst.
Swing bullish invalidated below 111,900—stop required, R/R 1:2 minimum.
Fast reclaim above 114,723 plus strong upside volume: short squeeze & potential extension to 119,800–122,318.
Macro monitoring essential (China ban, monetary policy, geopolitics).
__________________________________________________________________________________
Operational Summary : Favor defensive swing long plans on multi-TF cluster support (111,900–112,772), strict stop <111,750, progressive TPs to 114,723/115,900/119,800. Stay opportunistic: bias cautiously bullish but risk management is paramount in a cautious global environment and with no strong extremes detected.
__________________________________________________________________________________

SYRUP Priming for a 12% Pop - Longterm ~20% Potential
Hey Guys, My last posts were hidden, so I'm back at it and keeping it clean and to the point:
Maple Finance
COINBASE:SYRUPUSD is forming a base at the $0.40 zone after a steep downtrend. Looks like the bleeding's slowing down and we're seeing signs of accumulation.
🍯 Entry: $0.402 - $0.4045
🛑 Stop: $0.3825 (5.4% risk)
🎯 Target 1: $0.4479 (+12.1%)
🚀 Target 2: $0.5100 (+20.6%)
📐 R/R Ratio: ~2.2
This is a structure-based long setup:
Flattening EMAs
Volume compression
Lower wick absorption (buyer presence showing up quietly)
💡 Target 2 ($0.5100) is not a short-term scalp – that's the stretch target IF this turns into full accumulation. Full exit at T1 is a solid take.
Check my Bio for more info!
More setups on the way.

ETH 4H | Eyes on Support |ETH on the 4H
Bears are having their moment — and that’s fine.
Price is heading lower, with the 200MA around $3200 as the next support. If that breaks, the 0.382 Fib near $3000 is the last line before things get ugly.
My plan? Watch RSI for signs of bullish divergence.
Until then, hold tight.
Always take profits and manage risk.
Interaction is welcome.
BTC USD 180K BIG HOW?Trends and price targets is how, but realistically, it looks like 134k in the short term.
Drop is wicked if it were to occur, takes price to literally 12k, which you want to go all in if that occurs.
55k is another drop zone.
Otherwise, it looks fairly bullish.
buy zone marked in green,
sell in red.
watch the trends
and price targets are pretty accurate usually.
good luck!!
Custom charts by request.

Bearish Retest Setup After BreakdownPrice broke down from the recent bounce and lost the 0.098–0.101 zone, which lined up with the 23.6–38.2 fibs. That area is now likely to act as resistance. Momentum is still bearish. MACD histogram is red and expanding, and no signs of reversal yet. On the daily timeframe, MACD has just started to cross bearish, which adds weight to the downside bias.
If price retests that 0.098–0.101 area and shows weakness (like rejection wicks or small-bodied candles), it’s a clean short opportunity. First target would be the recent low around 0.092, and if that breaks, the next key level is 0.077.
Any push above 0.102 would invalidate the setup for me.

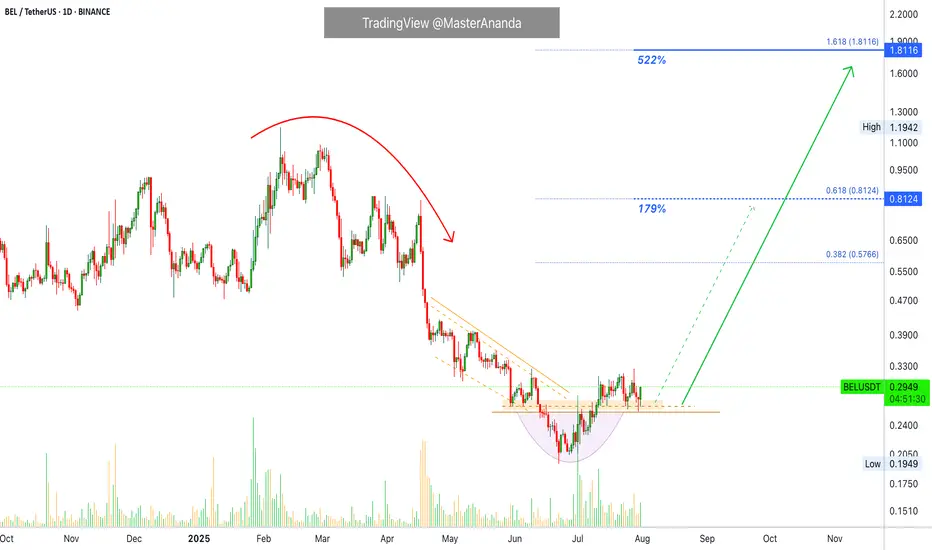
Bella Protocol 522% Easy Profits PotentialWe are going to be looking at many charts together every single day. We will go through all the altcoins basically. I am starting with some of those from the last period that didn't move. The charts look good but they filed to break their May high. These pairs are now ready to move before the rest of the market.
Here we have BELUSDT. A nice rounded bottom to end the downtrend. A small bullish recovery supported by high volume.
We have a perfect set of reversal signals and today a full green candle. This candle confirms those signals and opens up the chance of a strong advance. If the action starts now, you can be looking at the start of a major 2-3 months long move.
There will be some stops along the way but the action should be bullish nonetheless, higher highs and higher lows.
Strategy
In this setup we simply buy spot, no stop-loss. After buying we wait for as long as it is needed for prices to rise. Normally within 2-3 weeks, can be just a few days, but sometimes the wait can extend to 1-2 months. It varies. We are always prepared and ready to wait six full months, so if anything happens before this time horizon, even better but be ready to wait.
Even if you were to sell your current pair to buy a new one, the new one also requires waiting. We tend to sell wanting to find something that is moving but the moment we sell, we are faced with the same problem; even if the pair you chose is moving you have to wait for the bullish wave to develop. Even if prices rise 5% daily it would still take 20 days for a 100% price increase. 40 days for 200%. Etc. Patience is key.
So, simply, buy and hold. The market will take care of the rest.
Namaste.
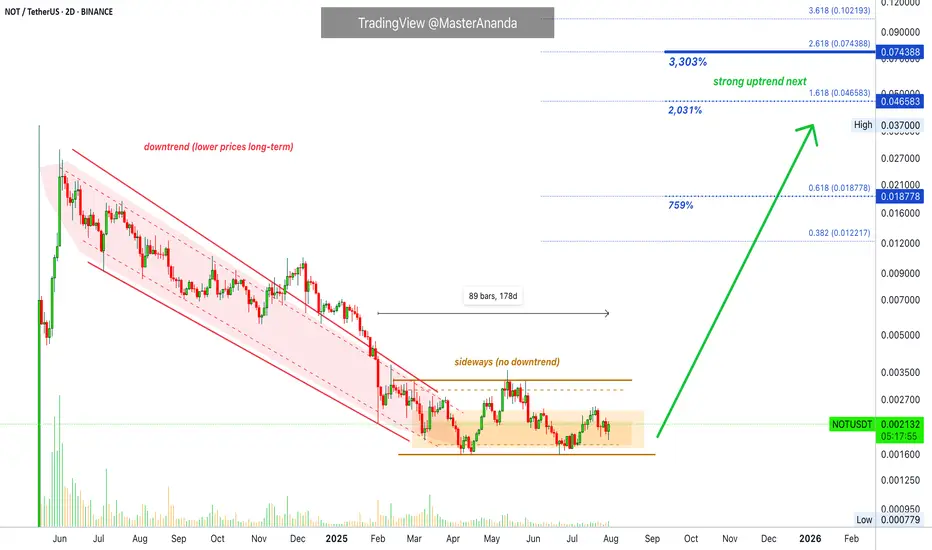
Notcoin · Last Call, Last Chance · Friendly ReminderWe looked at Notcoin recently and this is the last time you will see a publication at these low prices. In the next Notcoin update the price will be at least 100% higher and growing, we will be in the middle of a full blown bullish wave.
Right now Notcoin is still trading at the lower end of a downtrend. The downtrend ended and the market went sideways. Sideways is what we have now. The accumulation phase and zone where whales, smart trader and experts buy the most. The obvious reason being because it is always better to buy when prices are low.
4-8X. We are going with 6X for this one but the choice is yours.
Notcoin can grow anywhere between 1,000% and 3,000% in the coming months. I will aim for the higher targets just because I know this bull market will be very strong based on the charts and the early action we are getting. We are still at bottom prices marketwide and yet some pairs are already trading at new all-time highs. It means that this bull market will be big, bigger than usual and bigger than anything you can expect or imagine.
The strategy is to buy and hold. Spot. If you are leverage, then you need to decide on your risk, at this point, 2-3X is safe. Anything higher and you are opening yourself to a risky situation. Higher would imply higher profits potential, but would you risk everything for just a potential? Better play it safe while aiming big. If the pair can grow 30X in the coming months, leverage might not be the best choice.
Some people do both. What is your trading style? What are your trading goals?
Spot or leverage, low or high risk, we are going up. We had plenty of time to buy, plenty of warnings and plenty of opportunities. The market will wait no more. Prepare for the start of a mega bull run.
Thanks a lot for your continued support.
Namaste.
Toncoin Goes Bullish · 4X Leverage · Bottom Prices · OpportunityToncoin is breaking the sideways consolidation pattern. Today we have the highest price since late May, already two months ago, and rising volume. When you see how flat the action at the bottom is, you can tell how strong the bullish breakout that follows will me.
This is a friendly reminder because Toncoin will be huge in this altcoins market bullish cycle. I want you want you to be in, I want you to collect big projects, 1,000%+. That is why I am reminding you now. This trade setup can be approached both with leverage and spot, both options will do great.
After years of bearish action and months of consolidation, Toncoin is ready and the recovery is happening slowly but surely. Prices are rising slowly, no new lows. Prices are moving sideways but knowing the bottom is in the only logical conclusion is a break up. It is on the chart. It is inevitable, it is confirmed; profits and success.
Timing is really essential when trading. If you can get the right entry timing, a great price, trading becomes easy long-term. Once the bullish move shows up, you will be happy sitting in a strong position that only grows. That is because you bought the bottom. We are still looking at bottom prices, the last chance at the "opportunity buy zone."
We are doing 4X but we have positions with higher leverage from where prices were lower. You need to decide your own risk tolerance. If in doubt, zero leverage please. Only when you are 100% certain and you accept the full risk. The full risk is the liquidation of your position, all money gone. Are you ready to lose everything? If you are, better start trading spot. The chances of losing are very low. If prices drop, you get to pick a small paper loss and nothing more. Your number of altcoins stay the same. When the market starts to move, your money grows and the paper loss turns into a gain. You can't lose if you don't sell when prices are down. Buy when prices are low. Hold strong through the bullish wave. The time to buy is now. Buy and hold. You will be happy with the results.
Namaste.

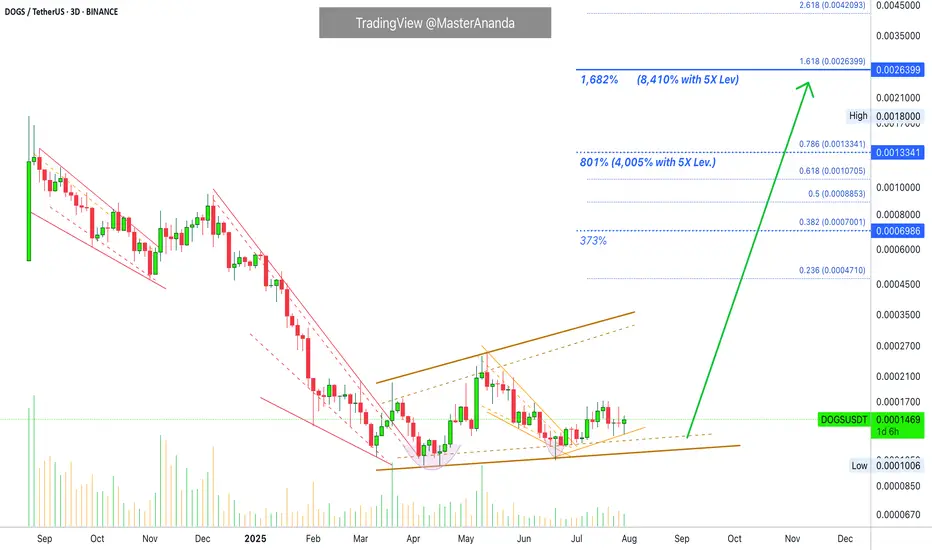
Dogs 5X Leveraged Trade-Setup (8,410% Profits Potential)Dogs continues to consolidation at bottom prices producing higher lows. With each passing day/session and candle, DOGSUSDT gets closer and closer to a strong bullish breakout. If you remember recently this pair produced for us more than 800% profits with 7X, the entire move was about 150% strong, between April and May. The move that will develop now will be many times stronger. With a leveraged position we can easily aim for 300-500% profits. So 5X lev. can easily do 1,500 to 2,500%. But this is only the start, the move that is developing now is a major advance, bull market type of situation, and this can result in more than 1,000% growth for Dogs and many other altcoins. This can mean really high profits with leverage.
Leverage increases the risk of default and makes the game that much more complex, so you should avoid it if you want peace of mind. If you don't mind the extra risk and stress, you can go for the higher profits. Timing right now is great.
Once or twice per year only we get this major positive entry, high probability entry. It doesn't happen often. Only once in a while the market forms a clear bottom, a support zone, and from this bottom a new bullish impulse is launched. Only once every several years, the time is now.
This is a strong chart setup. Dogs has been sideways now for a full six months. Six months sideways is the perfect time duration for a 1,000% bullish jump. Give or take 5X, we are looking at 5,000% potential for growth.
Patience is key. The market will bless us with endless opportunities like this. I will show you another one right away.
Thank you for reading.
Namaste.
ADA Setup – Eyeing Entry After 70%+ RallyCardano (ADA) has surged over 70% in recent weeks. A healthy pullback is underway, and we’re watching the key support zone for a potential long entry targeting the next leg higher.
📌 Trade Setup:
• Entry Zone: $0.65 – $0.67
• Take Profit Targets:
o 🥇 $0.98 – $1.15
o 🥈 $1.50 – $1.60
• Stop Loss: Just below $0.62
