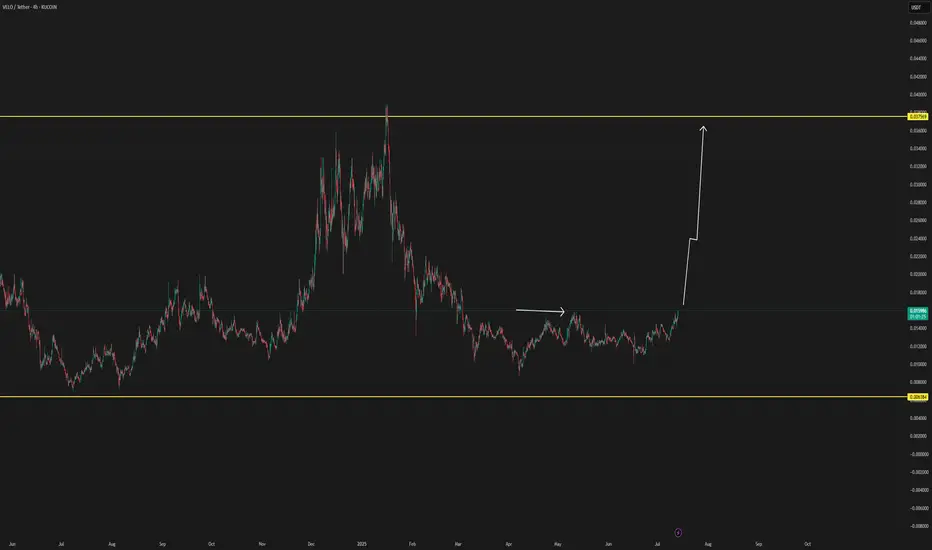
BREAK 2.0 upcoming for VELO/USDTVELO/USDT has high chance to break in the coming hours, more updates later when there is more confirmations below this update
Crypto
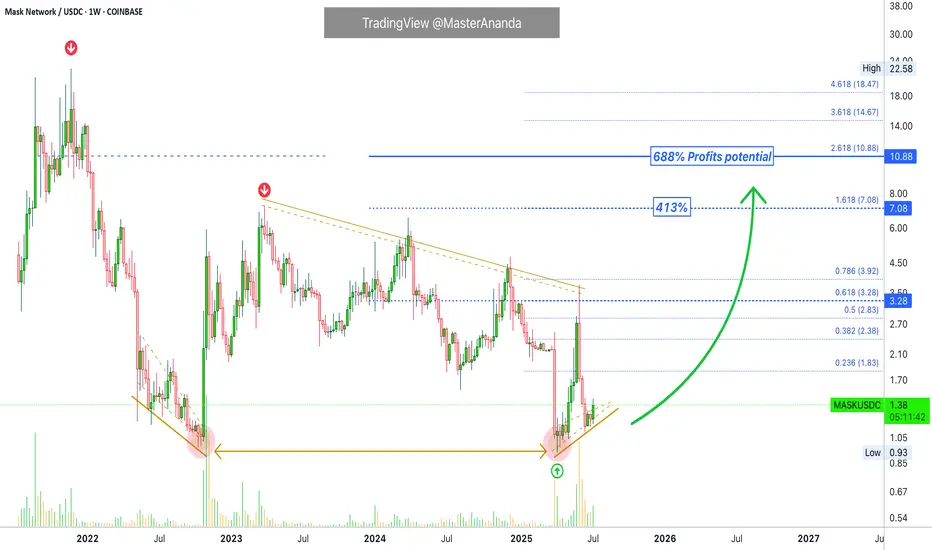
Mask Network Easy 688% Profits Potential Target ($10.88)The 2022 bear market for Mask Network ended October 2022. After a series of lower lows the project produced a bullish breakout until March 2023. It was the recovery wave with a total of 650% growth.
MASKUSDT went bearish again from March 2023 but instead of a bear market wave it produced a long drawn out distribution pattern.
The next major low happened 7-April 2025. More than two years producing lower highs and dropping, and I consider this low to be the end of the bearish period. MASKUSDT will now resume growing as part of a new bullish cycle and uptrend.
The 7-April low was followed by higher lows. Compare this to pre-October 2022 when the market was producing lower lows instead. Higher lows then a strong bullish breakout in May. Total growth for the initial recovery reached 300%. This is where the market is now. There was a retrace and now we are seeing signs of a bullish continuation after a higher low.
Mask Network is good as prices are still relatively low. Seeing the big candles in the past, another huge big-candle will show up.
Looking at the chart, I am mapping a 688% easy target within the next 3-6 months. Coming from the 7-April low, hitting this same target would produce a total of 1,070%. I believe the market is very healthy and even higher is possible in late 2025 and beyond.
This is a good chart if you are a buyer and looking for pairs that can grow strong in the near future. If you are a bull, this is an easy buy and hold.
Namaste.
PENGU still has room!?If you find this information inspiring/helpful, please consider a boost and follow! Any questions or comments, please leave a comment!
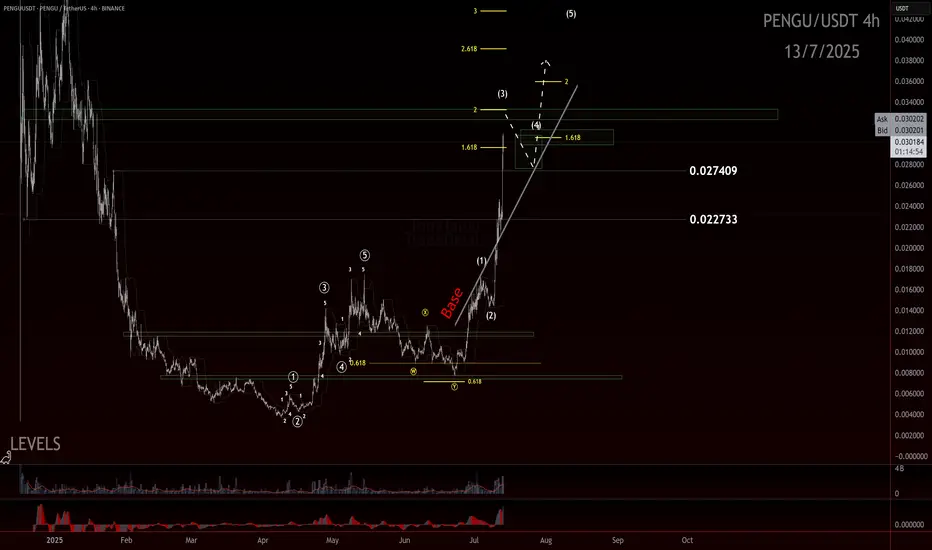
The move off the low looked like a clean, completed impulse—sharp, decisive, and well-structured. After that, we got a double zigzag retracement. It ran a bit deeper than the textbook version, but still landed right in the normal range you’d expect for a healthy correction. From there, we saw another smaller-degree impulse form off the .007 pivot, suggesting bullish momentum was building again.
Since the last update, PENGU has come a long way—more than doubling in price and now hovering around a most likely target for a wave 3. What’s notable is how it got there: not just by breaking above the 0.017 resistance, but by blowing through multiple base channels on solid momentum and healthy volume.
We didn’t get the ideal depth for a retrace for a wave 2 before that breakout, but that doesn’t disqualify the larger count. In fact, from an Elliott Wave perspective, I still believe we haven’t seen a proper wave 4 to balance out the earlier wave (2). So I’m holding off on calling a top to this wave 3 just yet.
Here’s what we’re watching closely now:
The secondary impulse off .007 continues to build structure
Ideally, the next pullback holds above the 0.027 or .022 region, signaling respect for previous support and AOIs
That pullback needs to unfold correctively, not impulsively, to confirm bullish continuation
The next trade setup I’m eyeing is that wave 4 into wave 5 move. I’ll be stalking this ticker closely as structure unfolds.
Trade safe.
Trade clarity.
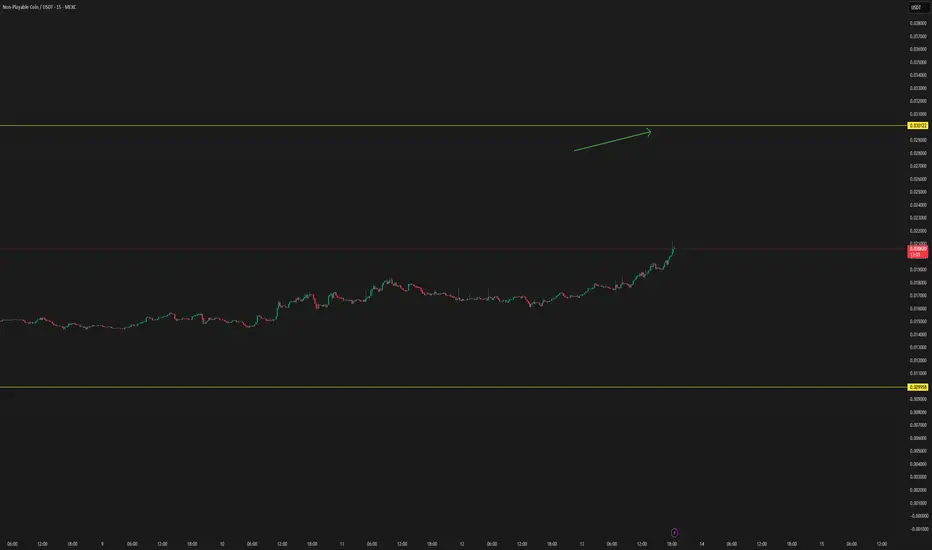
NPC/USDT NEW VOLUME WAVENew volume wave seems to start on this coin, which can get confirmed in the coming hours.
If there is new updates depending on data or volume, the chart will be updated here.
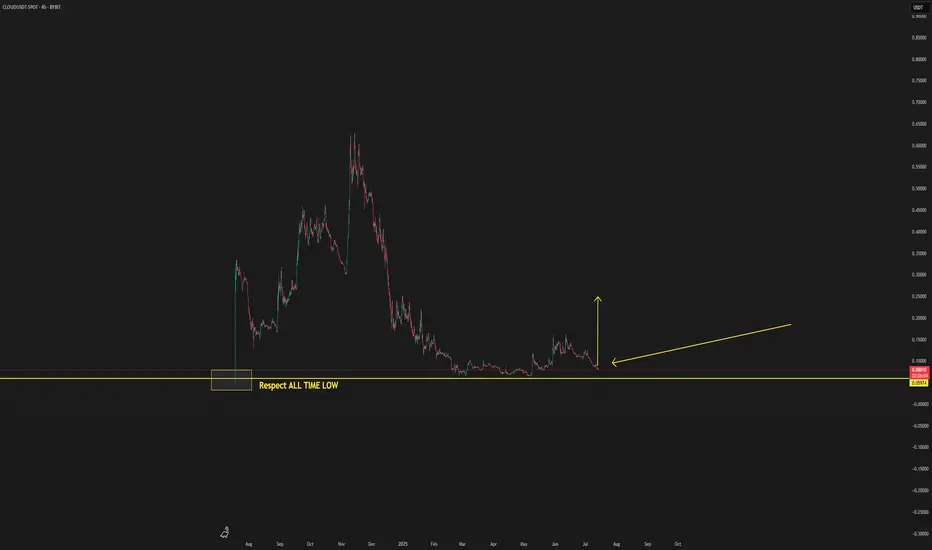
CLOUD THIS CAN BE THE BOTTOM STARTThis is a new coin to watch in the coming period, as it is showing signs of potentially forming a new bottom.
By respecting the previous all-time low, there’s a possibility that a new upward trend could begin from this level. Some indicators are also pointing toward this scenario.
If the coin provides further confirmations, updates will be shared below.
ETHEREUM - ETH Weekly Recap & Projection 13.07.2025Current Structure
Ethereum is showing a clear bullish bias.
Last week’s price action broke above a significant weekly swing level with solid candle closures — suggesting continuation.
Short-Term Scenarios
We could see two potential outcomes:
• A consolidation range forming at current levels
• A short-term retracement influenced by Bitcoin’s movement
Due to ETH’s high correlation with BTC, traders should review Bitcoin’s chart to understand ETH’s likely path.
Trading Plan
Wait for Bitcoin to complete a retracement
Monitor ETH for LTF (lower timeframe) confirmation and bounce
Seek long setups below the CME Gap (pink line)
Step 2 will serve as the trigger to initiate any positions on ETH.
Macro Risk-On Catalyst – Powell Resignation?
There are growing rumors regarding Federal Reserve Chairman Jerome Powell potentially resigning.
If confirmed, this could result in a strong rally across risk assets, including ETH — likely pushing prices higher without traditional pullbacks.
Summary
• ETH broke major weekly structure
• Watch BTC for clues — correlation remains high
• Plan favors long entries after BTC retrace + ETH LTF confirmation
• Powell resignation rumors could accelerate bullish trend

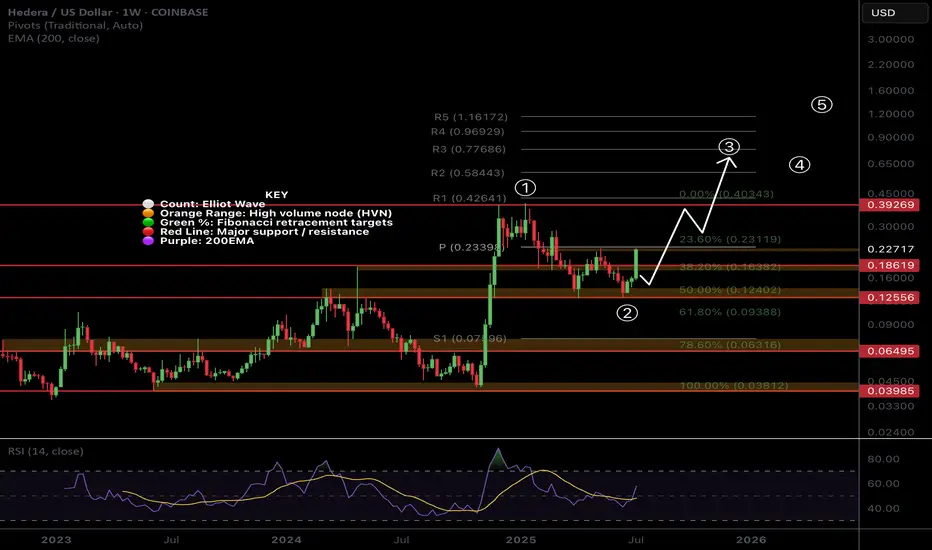
Hedera: How To Catch The Altcoin That Will Move NextWhich one is going to move next? That's the question and here is the answer: Look for those with a confirmed bullish setup.
There are hundreds and hundreds of trading pairs. We go by the saying, "everything will grow." But not everything grows the same day nor at the same time. So which ones are the ones more likely to move next?
Here is a simple example: HBARUSDT.
Hedera is trading daily above EMA55, EMA89 and EMA233. While it has already five days green, this one is more likely to move next vs others that are trading below those moving averages. That is what I mean by a confirmed bullish setup.
You can also use MA200 and other indicators such as the RSI and MACD. For example, if the action is happening above a strong Fib. level, this can also be of value. If the RSI is very strong compared to other pairs, this is also good. The more strong bullish signals combined the higher your chances of finding the right one.
My suggestion?
Do not try to catch the next big move. It is better to develop a plan, find the pairs that fit your criteria then buy and hold. Chasing pairs can turn into blind gambling game. It is better to trade on a plan focused on the long-term.
Thank you for reading.
Namaste.

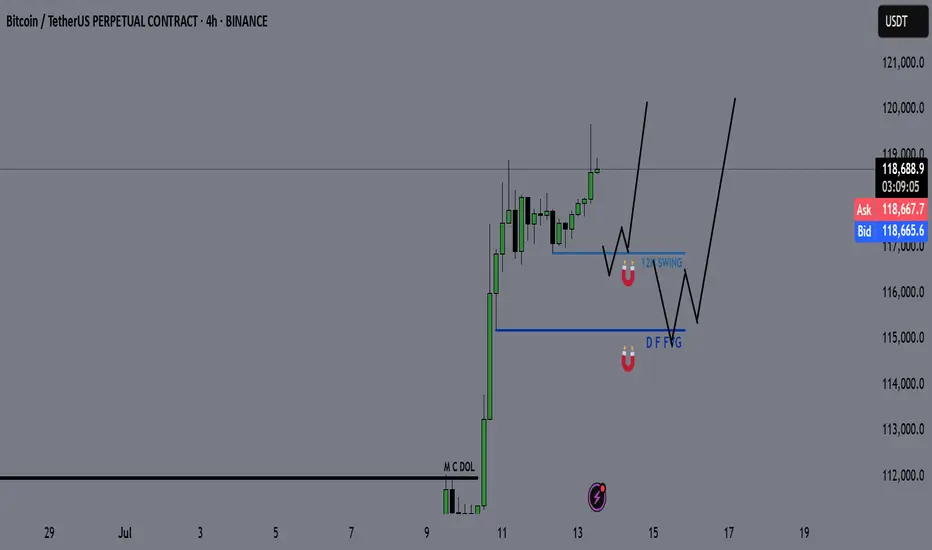
Bitcoin - BTC | Weekly Market Recap & Outlook 13.07.2025What Happened Last Week?
Bitcoin broke out of the recent downtrend structure and established a bullish leg with clear momentum.
The breakout was supported by volume and price structure, suggesting a trend reversal rather than a temporary deviation.
Weekly Bias and Strategy
The current outlook is bullish.
A retracement or sideways consolidation between the $120,000 and $114,000 zone is possible.
This zone may act as accumulation before further upside.
Key Points of Interest (POIs):
12H Swing Liquidity (turquoise line)
Daily FVG (blue line)
These levels will be monitored for long setups with confirmation on lower timeframes.
Macro Consideration – Fed Chairman Jerome Powell
Recent market speculation has increased regarding Jerome Powell potentially stepping down as Chair of the Federal Reserve.
If such a resignation is confirmed, it may act as a significant bullish catalyst for Bitcoin and other risk assets, possibly accelerating upside without allowing for any meaningful pullback.
Summary
• Bullish breakout confirmed
• Long bias maintained unless major invalidation occurs
• Watching retracement levels for entries
• Macro catalyst (Powell resignation) may trigger strong continuation without retrace
Bonk In A Good Situation, Breaking Resistance & HigherThe market bottom happened 7-April, it was a double-bottom compared to 11-March 2025. The end of a downtrend signals the start of an uptrend, and BONKUSDT started rising next. Resistance was found mid-May, on the twelve. This led to a correction and the correction ended 22-June as a higher low.
Now, between the first low in March and present day we have more than four months. The entire downtrend on the chart lasted 111 days, less than four months. This means that the bullish bias is already bigger in duration compared to the previous bearish wave, and, prices are set to continue higher because BONKUSDT just produced a higher high compared to May. Resistance has been compromised and this is good because it means we can soon experience additional growth.
The path is clear for rising prices. As resistance gets challenged in becomes weaker, as resistance weakens more buy-orders continue to pile up. The more buyers the better the market and then comes a new major high. The advance that is developing now will continue for months and months and months.
Are you ready for huge profits? I hope you are. Crypto is going up!
Namaste.

AIN/USDT : IS THIS THE COIN THAT WILL DO IT?? MOON SHOTAfter analyzing this coin, we’ve identified signals suggesting a potential breakout in the near future. As a result, we will continue monitoring it closely for confirmation.
Once confirmation is established, further updates will be provided below.
follow up the $0,30, expecting as first target

Sui Update · Clearly Moving Towards $7.62, $11.3 & $15The SUIUSDT chart looks great and just today we are witnessing a bullish continuation. Resistance was found 11-July but the market didn't produce any significant retrace. This is obviously because we are ultra-bullish and ultra-bullish can only mean sustained growth.
After the 11-July resistance, one day neutral and now resistance is being challenged again. Based on how Bitcoin is doing, a new all-time high; based on how the market is doing, great; we can expect higher prices in the coming weeks and months.
There will always be swings. Retraces and corrections but the bigger picture is a strong bullish dynamic for months. Think of 4-8 months of prices rising non-stop. That is what you are about to experience. Keeping in mind that the start date is 7-April and not today. So 6-8 months starting early April, growth long-term.
We will have a new all-time high for on this pair. There is huge potential for growth. The target on the chart is an easy one based on the short-term (within 1 month/30 days). After $7.62 we have $11.27 followed by $15. As you can see, it is still early within this bullish wave.
Thanks a lot for your altcoin choice, a great pick.
Your support is appreciated.
Namaste.

(2-hour timeframe for WTI Crude Oil (USOIL).(2-hour timeframe for WTI Crude Oil (USOIL)), here’s the technical analysis and target zones:
🟦 Key Observations:
Price is trading in an ascending channel.
I'm using the Ichimoku Cloud for trend confirmation.
There are two clear target zones marked with arrows.
---
🎯 Target Levels (as shown on chart):
1. First Target Zone: ~$74.50
This is the intermediate resistance level.
Price is expected to break above ~$69, then head toward this zone.
2. Final Target Zone: ~$76.50–77.00
This is the major resistance area, possibly the upper end of a swing move.
Could be reached if momentum remains strong and no major reversal occurs.
---
📌 Current Price:
$68.66 (Sell) / $68.76 (Buy) — as of the screenshot.
📈 Suggested Strategy (based on the chart setup):
Entry: On breakout above ~$69.00 with volume confirmation.
First TP: ~$74.50
Second TP: ~$76.50–77.00
Stop-Loss: Below the lower channel support (~$66 or tighter, depending on your risk tolerance).

Ethereum (ETH/USD) on the 2-hour timeframe.Ethereum (ETH/USD) on the 2-hour timeframe, here's the analysis and target level:
---
🟦 Chart Observations:
ETH is in a rising channel.
Price is respecting Ichimoku Cloud support.
A bullish breakout pattern is forming (consolidation above the cloud).
My clearly marked "TARGET 3300" at the top.
---
🎯 Target Level:
Primary Target: $3,300
This is the next major resistance and aligns with the top of the projected ascending channel.
Confirmed by your chart annotation.
---
📍 Current Price:
$2,964.3 (Sell) / $2,964.5 (Buy) — as shown in the screenshot.
---
📈 Strategy Suggestion:
Entry: On break above local consolidation / wedge (~$2,980–3,000).
Target: $3,300
Stop-Loss: Below Ichimoku cloud or lower channel (~$2,850 or tighter).
Support Levels to watch:
$2,815 (highlighted on the chart)
$2,700 (lower channel zone)
---
Would you like me to prepare a full trade plan or backtest this setup?

Weekly Close Watch: Bitcoin’s Key Level Could Shift the ChartsGood morning, Guys
There's only 1 day and 13 hours left until the weekly Bitcoin candle closes.
It's crucial that this candle closes above the 112,331 level with strong volume. Anyone experienced in economics and technical analysis knows just how significant this is.
If we get that close above the level, I’ll share a powerful analysis with a clear target.
I want to sincerely thank everyone who’s been supporting my analyses with likes—your support is
my biggest source of motivation when it comes to sharing content.
Much love to you all—we’re more than just a community, we’re a family. 💛

BTC.D Slipping ! ALTSEASON Loading ? This is BTC.D on the daily chart.
It has shown a strong relationship with the 50MA (blue/cyan line), often using it as support. While there were a couple of daily closes below it in the past, they lasted only 1 or 2 candles.
Now we’ve seen 4 consecutive daily closes below the 50MA (including today), which increases the likelihood of a deeper move to search for support.
The next key support zone (green rectangle) is defined by the 200MA (red line) and the 62.25% level (black line) — both of which acted as support before.
If BTC.D drops into that zone, ETH and altcoins could experience a strong bounce.
Always take profits and manage risk.
Interaction is welcome.

ADA LONG TRADE ADA has broken out of its long-term wedge pattern and looks poised for a move higher. With such a strong risk-to-reward setup, the trade makes sense even without a large position—especially important given the uncertainty around current tariff discussions.

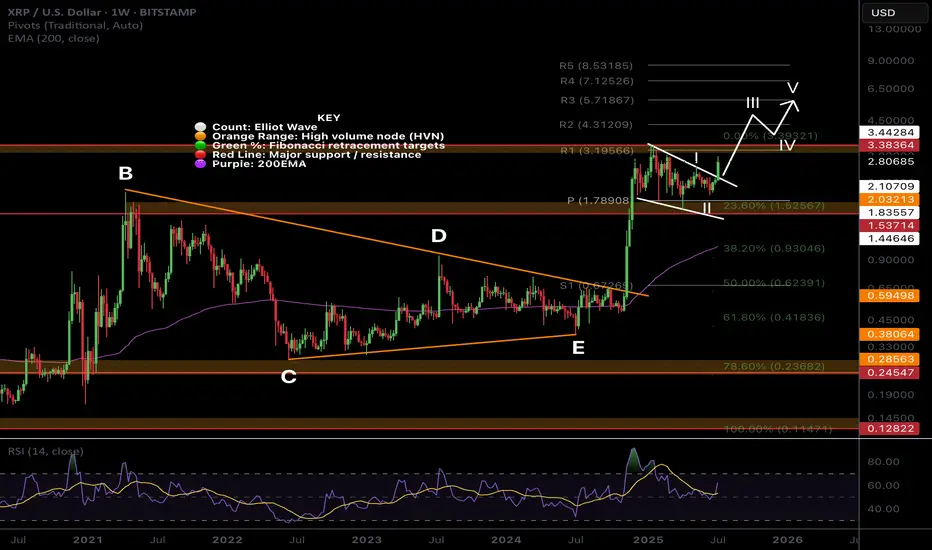
$XRP Macro Tiangle Final Thrust ContinuationCRYPTOCAP:XRP completed a macro triangle pattern last year. Triangles proceed a terminal motif wave which already completed a wave 3.
Wave (3) of (5) is underway with a terminal target around $5.7 after price broke out of the pennant / wedge pattern.
Weekly RSI confirmed bullish divergence.
Safe trading
ETH/BTC: Golden Cross Reloaded?This is ETH/BTC on the daily chart.
A major event is about to unfold: the golden cross, where the 50MA crosses above the 200MA.
The last time this happened was in early 2020, around the same price zone, right after a bounce off the 2019 low double bottom and a rejection from the 0.5 Fib level, which sits halfway between the 2019 low and the 0.786 Fib.
In 2025, we’re seeing a strikingly similar pattern:
– Price bounced off the 2019 low
– Got rejected again from the 0.5 level
– And now appears to be gathering strength to flip that level and the 200MA to confirm the Golden Cross
Always take profits and manage risk.
Interaction is welcome.

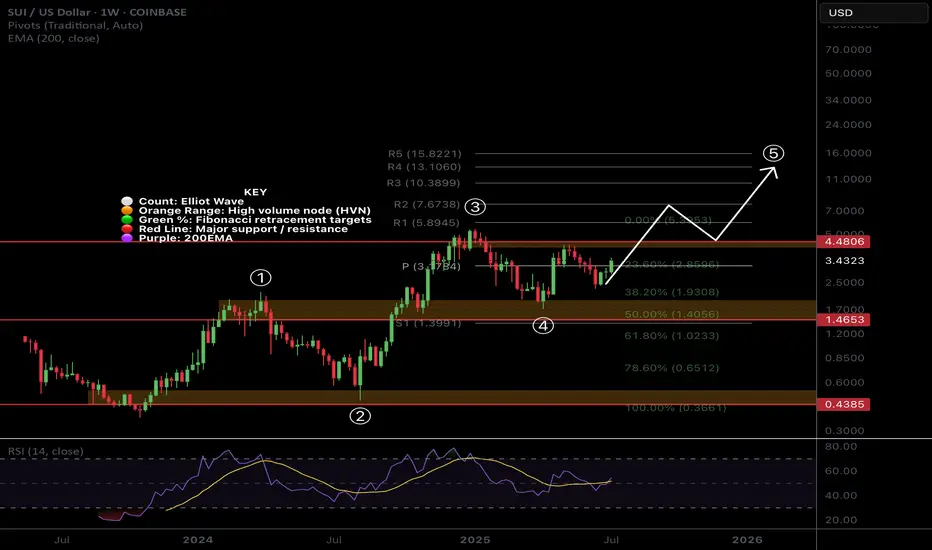
$SUI Wave 3 to Continue with a Strong Weekly CloseCRYPTOCAP:SUI printed a great weekly candle that will be closing today above the weekly pivot point with RSI trying to flip bullishly.
Price found support at 0.5 Fibonacci retracement and High Volume Node.
Wave 4 penetrated wave 1 which we potentially have a ending or leading diagonal Elliot Wave count limiting the potential upside with my current terminal target being around $10-13. Wave 4 could also actually be another wave 2 which would give us ridiculous targets but this is my preferred count for now.
Safe trading
$HBAR Shooting Up in Wave 3CRYPTOCAP:HBAR is flying off the High Volume Node and 0.5 Fibonacci retracement with Elliot wave 3 characteristics keeping the count alive.
Price is testing the weekly pivot point which should act as resistance for the time being but a break straight through will demonstrate a very bullish trend. Traders should be cautious about entering here.
RSI confirmed a weekly bullish divergence
Safe Trading
XLMBTC To Enter Its Biggest Bull Market Ever · 4,855% In 2017Stellar. No bull market vs Bitcoin in 2021. You know what this means? We are due an ultra-strong bull market for XLMBTC in 2025 (and beyond).
The 2017 bull market lasted 308 days. Total growth reached 4,855% within this period. The bear market that followed was brutal. From January 2018 until November 2024. A total of 2,499 days of bearish action.
A bottom was hit 4-November 2024 and the proceeding week we saw a major advance. This was a 400% bullish wave. Now this wave is over with a correction and the correction ended in a classic higher low. This week we have a new bullish breakout and this is the continuation of the uptrend, the first time XLMBTC goes bullish since 2017. It seems this pair will continue bullish even after Bitcoin peaks. Who knows, maybe even years going up.
The chart is solid and supports additional growth. We are due a strong rise, the biggest ever for this pair.
Thank you for reading.
Namaste.

VeChain Low Prices Accumulation Opportunity Reaching Its EndVeChain. We have higher lows since June 2023 and yet, VETUSDT is still trading at bottom prices. Don't get me wrong, this is great. This only means that the pair is strong and yet there is still time to buy within a rising accumulation zone.
I am using the linear chart so we can get the full picture. After June 2022, the candles become very small. This is the consolidation period. Even when the market starts to produce higher lows and higher highs after June 2023 this is still bottom prices action. What do I mean? Just compare the size of the 2021 bull market bullish wave with the past 3 years. That is what I mean.
What will happen now is the 2025 bull market bullish wave. A wave similar in size to what we saw in 2021 but with the end result being much higher prices, very likely a new all-time high.
First the action is very slow, almost neutral as you are seeing now. The small jump from April-May, less than 80%. Then watch... Out of nowhere, Boom!, 200-300% just to start. The 200-300% bullish breakout is never the end, this would be just the start of the major 2025 bull market wave. Then it goes on and on and on... Sustained long-term growth. The end result can be 15X, 20X, 30X or more. Too early to say, but prices won't remain low for too long. This is your last chance to accumulate VeChain before a major bullish run.
Namaste.

Toncion Update: Never Again Below $3.00 · New All-Time High NextToncoin already closed five consecutive days green as it prepares for a major advance. The last time this happened was in early April and this produced a nice jump. The difference now is that in April the market was coming out of a downtrend and the low was a major low. In June the market was in a retrace and the low is a higher low. Much difference. The next advance is very close, already here, and will produce the highest prices in more than a year, since June 2024 and of course, it will go beyond for sure, a new all-time high.
This is the last time you will see Toncoin trading at low prices before the major 2025 bull market cycle and wave. There is no limit to the upside, it is possible that in just a few days from now Toncoin will move away from $3 and never trade at this price again. That is, you will never be able to buy TON for $3.00, the price will be much higher. Do you remember Litecoin when it traded at 3 cents? What about Bitcoin at $3,000? What about Ethereum at $100? Well, Toncoin is no different. It will grow so much and so strong that we will be happy that we decided to be 100% Crypto. Risk vs reward. We accept the risk and for this reason we can enjoy an amazing reward.
Namaste.
