XRP Breakdown Ahead? Don’t Get Caught LongYello, Paradisers! Are you about to fall into a classic trap on XRP? The signs are stacking up, and if you're not careful, this move could catch a lot of traders on the wrong side of the market.
💎XRPUSDT is showing clear signs of weakness. A bearish CHoCH (Change of Character) has formed, and an inverse Cup & Handle pattern is currently playing out. On top of that, price action has decisively broken below the key support trendline. These signals together significantly increase the probability of a deeper bearish move in the coming days.
💎From the current price level, XRP is offering a 1:1 risk-to-reward setup. While this may attract more aggressive or short-term traders, the safer and more strategic approach is to wait for a proper pullback before entering. That would allow for a more favorable risk-to-reward and confirmation of the trend direction, reducing the likelihood of being caught in short-term noise.
💎It’s also crucial to watch the invalidation level. If XRP manages to break back above that zone and close a candle above it, this would invalidate the current bearish idea entirely. In such a case, it's better to stay patient and wait for clearer price action before making any decisions.
🎖Strive for consistency, not quick profits. Treat the market as a businessman, not as a gambler.
MyCryptoParadise
iFeel the success🌴
Crypto

Cosmos (ATOM) $70 New All-Time High, Market Dynamics & MoreCurrent price for ATOMUSDT matches the low from September 2020. The same range was also active in July of the same year and between December 2019 and February 2020.
From a low point in March 2020 Cosmos (ATOMUSDT) grew 4,122% to peak in September 2021. Giving us a 560 days long bull market.
The double-top in January 2022 extended the bull market to a total of 679 days. Those that didn't sell in September 2021, after a correction, had an additional month to sell at the highest possible.
Back in those days we had a rising bottom after the all-time low. This time around we have a stable (flat) bottom.
The lowest price for Cosmos happened March 2025. A one year long bull market would give us a top around March 2026. If we get 560 days like last time this would give us a top around September 2026. Compare this to September 2021, same month. Things will be pretty interesting that's for sure.
We cannot generalize anymore and each pair/project needs to be considered individually.
For example, Ethereum hit bottom June 2022, here Cosmos hit bottom March 2025, huge difference. Many projects bottomed also mid-2022 but others bottomed around August 2023, others August 2024 and many others just recently, 7-April 2025 and some even last month.
We are entering uncharted territory.
The big projects and the ones with ETFs will have their own charts. Corrections will be minimal and we cannot expect the same highly volatile and crazy dynamics as when Crypto was underground, it is public now and it has all the attention in the world. The altcoins can't crash down too strong when everybody is waiting to buy when prices go low.
The flat bottom in 2024-2025 for Cosmos can tell of two things: 1) There is the possibility of one final flush, lasting only a few hours or days and this would mark the start of the next bullish phase. Or, 2) the next cycle can start uneventfully. Normally there is always a strong shakeout before the change in trend.
A pair can grow for years, as some projects are already doing based on higher lows while others can be doing things differently.
I am just trying to get the point across that each project needs to be considered individually, this is very important for the future because everything is changing now but the effect will be felt only after many months. Even the bear market will spread out; not like before. The bull market is very likely to be extended because the projects move in groups and since the market is so big now it will take time for each group to jump.
Start late, ends late.
This chart allows for a new all-time high. $70 is the standard projection and I should say also the minimum. But this one is tricky because of the chart structure. It can also end with no new all-time high so all will depend on the demand. How strong is the project, the team behind it, how active are the participants, etc.
There will be enough capital for everything to shine but only those with a plan and the right tools will attract our attention. It is a huge game, competition is very strong. Those that neglect their projects are likely to stay behind. Those that are active with a positive mindset and plan, should come to the front.
You know how it is... Regardless of any individual project, Crypto is going up.
Namaste.

BNBBTC (Binance Coin vs Bitcoin) New All-Time High & 2026 BullI've been looking at Binance Coin vs Bitcoin and this chart has some pretty interesting dynamics, quite unique I should say. This can be a great opportunity for what is about to happen.
In the last bull market BNBBTC produced massive growth, the most interesting part is the fact that it continued to grow even during the bear market. Not that it lacked during the bull market and then grew during the bear market, but it grew strongly in early 2021 and continued to grow through 2022 while everything was going down. BNBBTC peaked only in November 2022 when Bitcoin hit bottom.
If we get some similar dynamics in this cycle, we can imagine BNBBTC starting to grow now, together with the rest of the market. When the bull market ends, all-time high, Bitcoin is going to 1M+ etc., then BNBBTC continues growing as the bear market unravels. This is because people tend to use BNB to store value and also because trading, market activity and engagement shoots up after the bullish cycle is over. Everybody, their mothers and cousins become professional traders and gamble everything away. This process can take an entire year... When all the money that was earned through the bull market is lost, then we get the bear market bottom and the cycle repeats.
At this point many people will be selling and giving up, but that would only be the start. November 2022 vs November 2026. Ok... That is too far away, let's focus on this present day.
Binance Coin vs Bitcoin, BNBBTC, produced a major low December 2023 and a higher low February 2025. December 2023 marked the end of the bear market for this pair. February 2025 confirms the bearish wave is over; the downtrend is no more.
We have a transition period, consolidation for more than a year. From the bottom we grow.
I am expecting a new all-time high on this pair and this is an easy guess. The only danger Binance was facing came from the previous administration, before Trump. Now that the Cryptocurrency hating crowd is gone, we can aim to the top and beyond. There is no limit to how far up anything Crypto can go. Truly... This is only the start...
It is still early
Notice how some pairs are really high and very advanced on their bullish cycle. Notice how other pairs are still trading at bottom prices. Pairs like this one can be approached easily, with low risk with 5X focused on the long-term. Very low risk with a high potential for reward... Never chase a rising wave. It is better to look for one that is yet to start.
Imagine if you were surfing. Would you be able to join a wave that is already pretty advanced? It can end your life. But if you glide patiently on your board looking around to catch a newly developing wave... It would be an awesome ride and your enjoyment is secure, guaranteed and safe. Catch the early wave.
There are endless opportunities in this market.
Your continued support is appreciated.
Crypto is the future of finance.
Crypto is the evolution of the Internet.
.....
Oh and by the way, the same dynamic I mentioned here between 2021 and 2022, also happened in 2018-2019. This means that there is high probability that BNBBTC will continue growing beyond the 2025 bull market. It is likely to grow during the bear market as well.
There are always several pairs that are used as a hedge. Finding those ahead of time can make a huge difference on how strong your portfolio remains during the bear market. I will be recommending selling though but not 100%. We will be selling around 60-70% and the rest we keep invested regardless of what happens. We are Crypto, we love Crypto and we support he market.
Namaste.

BTCUSD ||4h. ( Elliott Wave + SMC Analysis”)
“BTCUSD is Setting Up for a Powerful Wave 5 Rally! 🚀 | Elliott Wave + SMC Analysis”
---
📊 Optimized :
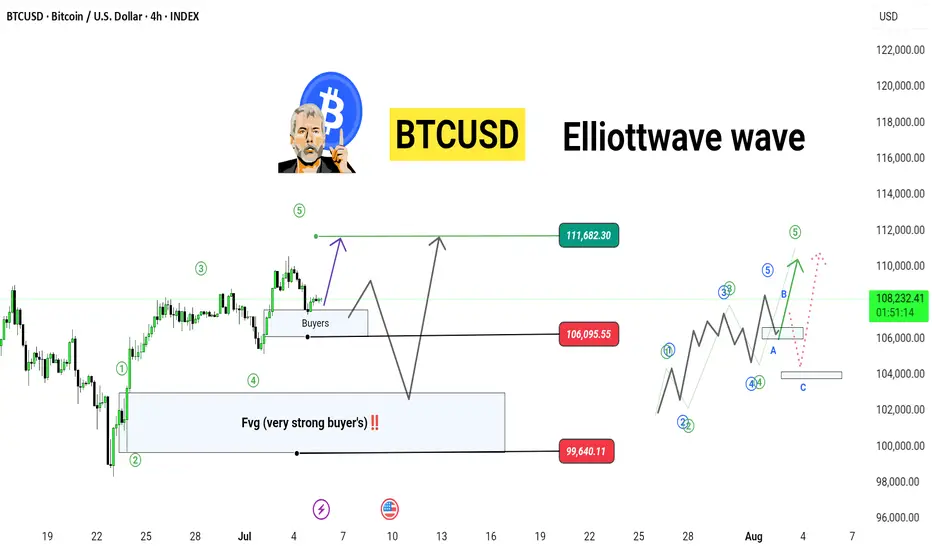
> 📈 Bitcoin (BTCUSD) 4H Elliott Wave Forecast
BTC is currently forming a classic Elliott Wave 5 setup after completing a clean 1-2-3-4 sequence, supported by strong Smart Money Concepts (SMC) zones!
We’re now at a critical decision point — will bulls push to 111,682 or will price revisit the Fair Value Gap (FVG) near 99,640 for re-accumulation?
This chart outlines two potential bullish paths after retracement and the complete ABC correction possibility.
---
🧠 Key Technical Confluences:
✅ Wave 1 to 5 structure forming cleanly
💸 Strong Buyer Zone (FVG) at $99,640
🔁 Correction zone marked for Wave A-B-C retracement
🟢 Premium breakout target: 111,682
🔴 Support zones: 106,095 and 99,640
---
🚀 My Outlook:
If BTC holds above 106K, we may see a sharp continuation to 111K+ as part of Wave 5.
But if smart money needs deeper liquidity, we’ll likely revisit the discount FVG before a major push up.
---
🔍 Tags
#BTCUSD #BitcoinAnalysis #ElliottWave #SmartMoney #FVG #Wave5 #BTCForecast #CryptoTrading
BITCOIN - Price can drop from resistance area to $103000Hi guys, this is my overview for BTCUSD, feel free to check it and write your feedback in comments👊
Some days ago, price entered a pennant pattern, where it at once made an upward impulse from support line.
Then the price reached $98700 level and soon broke it, after a small correction, and then continued to move up.
Later BTC rose to the resistance line of the pennant, but soon turned around and started to decline, breaking $110000 level.
Price little corrected and then tried to bounce back and failed, after which it fell to $98700 level and then started to grow.
In a short time, BTC rose to a $110000 resistance level and tried to break it again, but recently turned around and started to fall.
Now, I expect that BTC can grow to the resistance area and then drop to $103000 support line of the pennant.
If this post is useful to you, you can support me with like/boost and advice in comments❤️
Disclaimer: As part of ThinkMarkets’ Influencer Program, I am sponsored to share and publish their charts in my analysis.

Candlestick Patterns - How to read them like a ProOverview
Candlestick charts serve as a cornerstone in technical analysis, presenting price activity in a visually digestible format. By examining how prices move over a given timeframe, traders gain key insights into potential market direction, sentiment shifts, and trend strength.
Mastering candlestick interpretation is essential for identifying bullish or bearish sentiment, as well as for spotting possible trend reversals or continuations. Still, candlesticks alone don’t paint the full picture—using them without broader context increases the risk of false signals.
---
What You'll Learn
What are candlestick charts?
Common bearish candlestick patterns
Common bullish candlestick patterns
How to apply candlestick analysis in trading
---
What is a Candlestick Chart?
A candlestick provides a snapshot of an asset’s price behavior during a specific time interval, whether it's one minute, one hour, or one day. This format allows traders to quickly assess how the price has moved within that period.
Each candle reveals four price points:
* Open – the price at the beginning of the interval
* Close – the price at the end of the interval
* High – the highest price reached
* Low – the lowest price during that time
Anatomy of a Candlestick:
* Body: The thick section between the open and close. A green (or white) body means the close was higher than the open (bullish), while red (or black) means the opposite (bearish).
* Wicks (or Shadows): Thin lines extending from the body to indicate the high and low.
* Upper wick: Marks the highest traded price
* Lower wick: Marks the lowest traded price
---
Bearish Candlestick Patterns
Understanding bearish candlestick patterns helps traders identify moments when buying momentum might be running out—setting the stage for a potential downward shift.
Evening Star
A three-candle formation that signals a shift from buying pressure to selling dominance. It starts with a strong bullish candle, followed by a small-bodied candle of indecision, and concludes with a large bearish candle that cuts deep into the first. This pattern often appears at the end of an uptrend.
Bearish Engulfing
This setup includes a small bullish candle followed by a large bearish candle that completely swallows the previous one. It indicates that sellers have seized control, potentially marking the beginning of a downward trend.
Shooting Star
With a small real body near the low and a long upper wick, this pattern reflects strong early buying that is ultimately rejected by the close—suggesting fading bullish momentum.
Gravestone Doji
This candle opens, closes, and hits its low all around the same price, leaving a long upper wick. It suggests that bulls pushed higher during the session but were overpowered by bears by the close.
Three Crows
Three consecutive bearish candles, all approximately the same size. These indicate that a sell off is coming soon.
---
Bullish Candlestick Patterns
Bullish patterns can alert traders to possible reversals after a downtrend or strengthen conviction during an uptrend.
Morning Star
This three-candle formation marks a potential turning point from bearish to bullish. It begins with a strong bearish candle, followed by a smaller candle showing indecision, and ends with a large bullish candle breaking upward—signaling buying strength is returning.
Bullish Engulfing
This two-candle pattern begins with a bearish candle, then a larger bullish candle that completely envelops the previous body. It reflects a sharp transition in sentiment, suggesting renewed buying pressure.
Dragonfly Doji
A single candle where the open, close, and high are all very close, with a long lower wick. It shows sellers pushed prices lower but buyers stepped in and brought them back up—an early sign of possible reversal.
Hammer
A classic bullish reversal signal that features a small real body near the top and a long lower shadow. It indicates a battle where sellers initially dominated, but buyers managed to close near the open price.
Three soldiers
Three consecutive bullish candles, all approximately the same size. These indicate that a big buy is coming soon.
---
Trading with Candlestick Patterns
Candlestick patterns become more meaningful when they align with major chart areas—such as previous support or resistance, trendlines, or retracement zones. A bullish signal at a support level can hint that the downward pressure is fading, while a bearish pattern at resistance may warn of an upcoming decline.
To increase the reliability of your trades, combine candlestick patterns with other forms of technical analysis:
* Support & Resistance Zones: These are price levels where the market has historically reacted. Candlestick patterns forming near these zones have stronger potential implications.
* Fibonacci Levels : These help identify likely retracement areas. When a candlestick pattern forms near a key Fibonacci level like 61.8%, it adds strength to a potential reversal setup.
* Liquidity Areas: Clusters of orders (buy or sell) tend to create strong reactions. When patterns appear in these zones, they often precede more decisive moves.
* Technical Indicators : RSI, MACD, Moving Averages, and Stochastic RSI can provide confirmation. For instance, a bullish reversal pattern that appears when RSI is oversold strengthens the signal.
💡 Tip: Don’t rush into trades based on one candlestick alone. Always wait for the next candle or price confirmation (e.g., a break of a previous high/low) to validate your signal.
---
Thanks for Reading!
✨ If you found this helpful, show some love by liking or commenting!
🔔 Don’t forget to follow for more technical breakdowns and trading insights coming soon!

AMP Grew 1,634% in 2023; What About 2025? Follow My ReasoningBetween October 2023 and March 2024 AMPUSDT grew 1,634%. So you could say this move—the one that I am mapping—the next move, is a continuation of the previous cycle, right? Wrong.
It is not necessary. The long correction and consolidation period with a flat base nullifies the previous cycle. We are back to square one. We are at the baseline level. Anything that happens now can be considered new.
Instead of a continuation of a previous period, a new phase/cycle can develop. So growth potential is not limited to past actions or happenings, everything is possible based on current market conditions which are great and getting better with each passing day. Ok? I think we can agree so let's continue.
The last strong bullish wave gave us a taste of what is possible. It showed us that 17X is possible even when the market is in a transition period, the recovery year I dubbed it. That is, 2023. And it was the recovery year because the market recovered from its 2022 bear market bottom.
2025 bull market targets
My aim would be the one around 1,547%. I show higher targets because it can go higher. I show lower targets because different people approach the market in different ways. If you want to aim for the maximum and aim high, you have the high targets. Those that want to get paid short-term also have some targets on the chart. But I am always somewhere in-between the high and the low.
I normally like 1.618 and 2.618. It all depends on which peak I use to plot the Fibonacci extension tool. If we are looking at projections based on the last wave, then the 1.618 is pretty standard and easy to hit, so we can aim even higher.
If we are looking at the last bull market, then going beyond 1.618 might be too optimistic.
I keep saying that it can go higher but truly, it is always the same. The biggest difference is due to inflammation, everything grows in a controlled way because it is not a crazy market, it is very well organized, everything is calculated so that the market can continue to grow and evolve long-term.
There is something for the serious, for the slow, for the fast, for the greedy, for the humble, for the grateful, for the ungrateful, for the egoist and for the spiritualist. There is a little bit of everything for everybody. That's Cryptocurrency for you. It is censorship proof.
They continue to attack us, to censor us and to block us on all fronts, but they have not found a way to block our Bitcoins... Uhhh. It is working just as intended. Peer to peer electronic cash, no middleman, no intermediary. The future of finance. Money for the age of the Internet.
Thanks a lot for your support.
Namaste.

Ethereum $5,791 followed by $8,500 Late 2025Ethereum is due a major, major bullish wave. No new highs since March 2024. Double-top December 2024.
The bear market ended June 2022. April 2025 marks a long-term higher low.
So the peak remains flat, March 2024 vs December 2024. While the bottom is rising, June 2022 vs April 2025.
You could say the top is a lower high of course, November 2021 vs 2024. This is also valid. Even with a lower high top a bullish wave is due leading to a minimum of around $3,800 or $4,000; back to baseline.
Now, if we really want to talk about minimum because we really don't care about worst case scenario, the fundamentals are improving and everything is getting better, consider $5,791. This would be the minimum. With the Ethereum ETFs and the 2025 bull market, we then open up $8,500 and so on. Growth potential is unlimited and we will have to use our imagination. These numbers are good though and definitely a strong level where action will happen. You will see some resistance, some something going on when Ethereum reaches these numbers.
Ethereum is due a major, major bullish wave. It is not a question of "if," it is a question of "when." When will it happen? "If it happens?" No! When, will it happen?
It will happen in 2025. You can be certain about it... Just watch!
....
Ethereum (ETHUSDT) has been consolidating two months above support. Support being $2,425. One week it broke below this level just to recover the next week. More than 8 weeks sideways wicking lower and higher.
The 7-April low, candle and rounded bottom, as well as long-term higher low makes this date a clear bottom. From the bottom we grow. Once the bottom is hit, the trend changes. The trend has been bearish since March 2024. A long time in Crypto term. We are in the bull market year, 2025. What is not happening now, is what will happen next.
The market was bearish for a long time and that's ok. The good news are the waves within cycles... We just came out of a strong correction; we have a small recovery and consolidation. The initial breakout is being consolidated before additional growth.
Lots of thinking, lots of reasoning, lots of studying... Everything you need to know is already present on the chart. Ethereum will grow. Mark by words. It is already happening.
Thank you for reading.
Namaste.

Bitcoin Recovers Above 105,000, Extremely Bullish +AltcoinsBitcoin produced only two days red, a bear-trap, and is now trading daily back above $107,000, an extremely bullish development.
Good morning my fellow Cryptocurrency trader, I hope you are having wonderful day.
The altcoins market bull market is confirmed and what Bitcoin is currently doing gives further strength to the bullish case and bias. It will be only a matter of days before the entire altcoins market turns strongly bullish with major momentum.
The range is still valid though, $100,000 - $110,000. But this time around the upper-boundary is likely to break and the last ATH tested, a new all-time high is even possible and also highly probable which is what will propelled the altcoins to hit multi-year highs and some even new all-time highs. Many pairs will move ahead.
With each passing day, the Cryptocurrency market will continue to heat up. We can expect growth long-term.
The 2025 bullish cycle started with the 7-April market low. The start of the third wave started 22-June and should go for 2-3 months. Then we will have a correction, the fourth wave followed by one final jump, the fifth wave.
We can expect growth now and all through late 2025. The entire period will be bullish. Only when the marketwide correction comes there will be a pause but many pairs will grow even at this point.
Choose wisely. Low risk vs high potential for reward.
Aim high. Focus on the long-term.
Thanks a lot for your continued support.
Namaste.

Avalanche 2025 All-Time High, Accumulation & Bullish ZonesI am using $495 as the next bullish cycle top. The 2025/26 bull market all-time high. It can be more but it can also be less. We can only guess at this point because the Cryptocurrency market is just so young that everything becomes possible. We err by being conservative.
Avalanche is trading within a long-term accumulation zone. The best possible prices, literally.
The purple-rounded bottoms on the chart denotes an excess.
This year, 2025, the accumulation zone was activated in February. The action then moved within this orange-zone in March and this is where everything is happening now.
If you wanted to put tens of millions of dollars into this project at the best possible prices pre-2025 bull market wave, then you would need to do it based on the long-term. Back in July-August-November 2024 and February, March, April, June and so on 2025.
If you were to buy too big too fast it would push prices up. So whales wait months in order to accumulate. After years of accumulation at low prices, they send the signal and the market can move. Once the market starts moving, the consolidation/accumulation period is over, there is no going back.
The "neutral zone" here is light blue. This is already bullish but not ultra-bullish because there is no continuation inside this zone. Only when Avalanche (AVAX) moves and stays above it we can get a new bull market cycle. Since it only happens every four years, like clockwork, there is no need to guess.
Pre-2021 we buy as much as we can and sell when prices are high up. Post 2021 bearish, SHORT, SHORT, SHORT. After 2022 comes the transition period, the long-term accumulation and consolidation phase. In 2025 is the next bull market, this is where we are at now.
So now we can buy as much as we can but only with the intention to sell when prices are up.
An investor does not sell, only buys forever more. But still, if you are an investor, you shouldn't buy when prices are high. The time is now to accumulate on everything.
A trader sells every few weeks, every few months. Each wave. Buy support (low) and sell resistance (high). Buy low (red) and sell high (green).
You need to know clearly if you are trading or investing. Getting things confused can result in loses. Getting this topic confused simply means lack of planning.
We are entering a major bullish cycle and wave. This is not the time to be a trader if you've never traded before. This is the time to invest, accumulate; buy and hold. Sell only when prices are astronomically high.
When the bullish cycle is over and if you find a pair trading at support, you can buy to sell again within weeks or months. But not now. Now, after you buy, you hold. Makes sense?
We are in this together.
I love you!
Your continued support is appreciated, truly.
Namaste.

Ethereum Classic Long-Term Consolidation & The 2025 Bull MarketIt feels like we've been looking at the same chart for three years. Remember June 2022? A "small" 260% price bounce and we all did pretty good. Market conditions have not changed.
It's been three years and three years Ethereum Classic (ETC) continues to move, trade, sideways. A long-term consolidation phase.
The 2021 bull market was also preceded by a consolidation phase. This is marked on the chart.
The 2025 bull market is getting ready, we are still loading and I call for your patience once more but, you can know for certain that Cryptocurrency—the altcoins market—will meet all of your expectations and beyond.
The consolidation pattern has three major lows. June 2022, June 2023 and April 2025.
The last bull market produced total growth of 5,757% from bottom to top.
The current consolidation pattern has a technical triple-bottom. Higher lows each time but only by a few cents. We are only missing the bull market wave and bull run phase.
Think of something similar to what we saw between December 2020 and May 2021. Or, instead of a 6 months long bullish wave, we can get a 12-18 months long bullish cycle. Slow and steady growth.
It is likely to go fast because the consolidation phase has been so long. There is no need for long drawn-out bullish cycle, the market had plenty of time to test everyones patience and reset.
You know how Crypto goes, once it starts moving there is no going back. Nothing slow, fast and strong. That's my guess of course but I am open to seeing anything develop and I will update, adapt and change if something different happens.
One thing is certain, Ethereum Classic will grow.
We are getting closer with each passing day. The best is yet to come.
Namaste.

PundiX: Focus on the WinIf you had to choose between a pair that is dropping or set to drop vs one that is rising or set to rise, which one would you choose?
Looking at the chart, the red arrow shows a peak and subsequent drop; the green arrow shows a bottom. The bottom is followed by a rise.
PUNDIXUSDT is now trading within a higher low and producing a bullish breakout supported by rising volume. Trading volume today is many times the daily average in the past month.
These are simple signals; bullish confirmed, a new bullish wave with a nice 188% target short-term and beyond.
Happy 4th of July USA.
Thanks a lot for your continued support.
Namaste.

AAVE Breakdown Could Trigger Major DropYello Paradisers — did you spot the bearish setup forming on AAVEUSDT? If not, you might already be a step behind, but there’s still a high-risk-reward opportunity on the table — if you approach it with discipline.
💎Currently, AAVEUSDT is looking increasingly bearish. The asset has confirmed a bearish Change of Character (CHoCH), broken down from a rising wedge pattern, and is showing clear bearish divergence on the chart. These combined signals suggest that the probability of further downside is increasing.
💎From here, there are two main scenarios we’re monitoring. First, AAVE could attempt a pullback to fill the Fair Value Gap (FVG) above, which would offer a clean short-entry zone with strong risk-reward potential. Alternatively, price could reject directly from the nearby Bearish Order Block (OB), offering another chance for well-structured entries. Both setups depend on confirmation and timing, so patience is key.
💎However, if AAVE breaks and closes decisively above the current resistance zone, the bearish thesis becomes invalid. In that case, the best move is to wait on the sidelines and allow new, higher-quality price action to form before re-engaging.
💎This market demands patience and discipline. You don’t need to catch every move — just the right ones. Stay sharp, stay focused, and let the market come to you.
Strive for consistency, not quick profits. Treat the market as a businessman, not as a gambler.
MyCryptoParadise
iFeel the success🌴

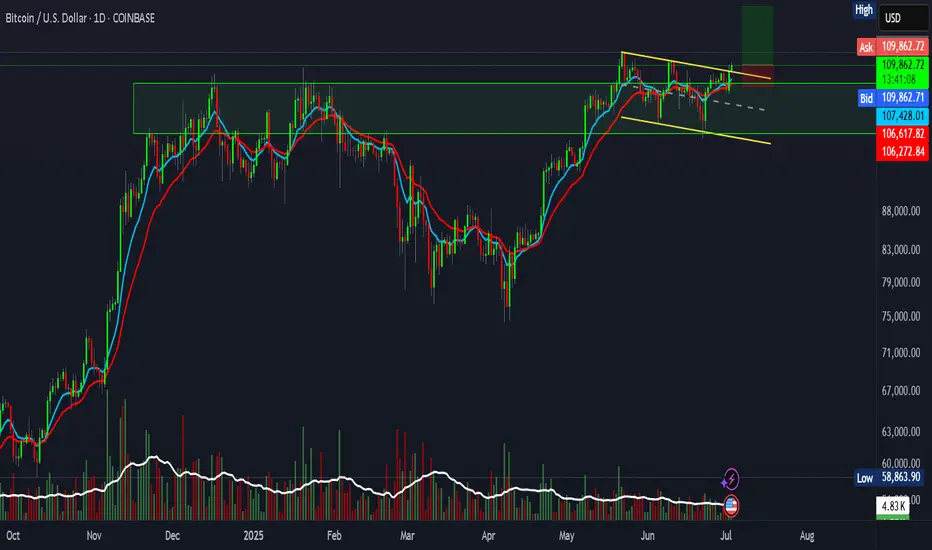
HolderStat┆BTCUSD retesting of the trend lineKUCOIN:BTCUSDT has pushed above 107,000 and reclaimed key levels after breaking from triangle and consolidation zones. Structure supports a move toward the 112,000 resistance zone (ATH). Higher lows and strong rallies continue to define the trend.

HolderStat┆ETHUSD correctedKUCOIN:ETHUSDT is moving inside a rising wedge after reclaiming support near $2,500. Recent breakout from consolidation supports a continuation push toward $2,720–$2,760. The current trendline structure and bullish price action suggest upside potential.

HolderStat┆XRPUSD forms an ascending structureBINANCE:XRPUSDT is forming a stair-step bullish pattern after breaking out of consolidation above 2.12. The current trajectory suggests continued movement toward 2.70, with multiple support bounces validating the structure. Price action remains favorable for bulls.

SOL/USDT : Strong Bullish Move Ahead?By analyzing the #Solana chart on the daily timeframe, we can see that the price is currently trading around $149.62. If the price holds above the key level of $146.28, we could expect the beginning of a strong bullish wave, potentially delivering over 25% short-term returns.
If this scenario plays out, the next bullish targets are $168.50, $187, $220, and $263.
(Personal research is strongly recommended for long-term investment decisions.)
Please support me with your likes and comments to motivate me to share more analysis with you and share your opinion about the possible trend of this chart with me !
Best Regards , Arman Shaban

HolderStat┆SOLUSD got out of the triangleBYBIT:SOLUSDT is trading in a well-structured upward channel with a history of consolidation zones acting as breakout springboards. The price recently bounced off trend support and now targets the resistance at 170. Structure remains bullish as higher lows continue to form.

HolderStat┆BNBUSD consolidated above the $650 levelKUCOIN:BNBUSDT is holding firm above 650 after breaking through a symmetrical triangle. The price structure is supporting a bullish continuation toward the upper resistance zone at 690–700. A clear uptrend is forming with tight consolidation along support, hinting at a breakout move.

ETH could be about to rip into a short-term rallyWhile the stock market has seen surprising upside in the past weeks (presumably due to pricing in rate cuts / a more positive liquidity picture / high expectations for Q2), crypto has lagged behind. I don't believe anything significantly above current prices - no matter in which market - is sustainable for now, but we can certainly milk it for whatever it's worth.
Notably, BTC has shown way more resilience and dominance in the current cycle so far. This makes sense in a high interest environment. However, within the bias of the markets pricing in expectations for rate cuts and as such more liquidity, we could also assume that demand for assets other than "safe havens" would now increase as well, leading us to the biased conclusion that we could see altcoins wildly outperforming BTC over the next weeks.
Indeed, if we look at the BTC chart, technicals such as VWAP stddevs show significantly less potential for upside if compared to ETH in the current moment in time. We therefore would focus on ETH at this point (as money flow seems to cycle BTC->ETH->Others).
PLEASE NOTE: SL and TP are not accurate. This is not a precise trading idea. Please use your own judgement in accordance with your trading style.

BTCUSD| Bitcoin’s Historic Parabolic Pattern🔥 Parabolic Pattern | Institutional COINBASE:BTCUSD Demand Mirrors Gold ETF Era 🔥
COINBASE:BTCUSD vs SP:SPX vs TVC:GOLD
The market is whispering something big — and it's not retail noise this time. For the third straight quarter, listed corporations have outpaced ETFs in Bitcoin purchases, a seismic shift that echoes one key moment in history: the launch of the Gold ETF. Companies like NASDAQ:MSTR contiune to buy and others are following. Will NASDAQ:AAPL NASDAQ:META and NASDAQ:GOOG be next ? Let me know in the comments who you think will be next to buy?
Back then, companies rushed to gold as a hedge against inflation and a store of value as fiat cracks widened. Fast forward to now — we're seeing the same institutional footprints in Bitcoin. The buy-the-dip narrative isn't just alive — it's being driven by corporate balance sheets.
Rumors are circulating that the U.S. government plans to buy 1 million BTC — a move that would shake the global financial system to its core. If true, this isn’t just bullish — it’s historic. The last time governments got this aggressive with a hard asset was during the Gold Reserve buildup. Bitcoin isn’t just digital gold anymore — it’s becoming sovereign-level collateral. 📈💥
💬 Drop your thoughts below. Is this the beginning of the next parabolic era?
In this episode, we break down the parabolic pattern forming on the chart, why it may signal the next explosive leg up, and how history is repeating with BTC playing the role of digital gold.
📊 Technical breakdown. On-chain behavior. Smart money moves.
Don’t blink. Parabolas end in fireworks.
I've been trading for 17 years
👍 If you found this useful, drop a like.
💬 Got questions or thoughts? Leave a comment below — I always respond and happy to help.
👍
Best Regards
MartyBoots

MACRO 3-Drive Pattern on Bitcoin | Major Reversal Ahead?Is Bitcoin completing a massive 3-drive structure on the macro chart?
Three clear pushes higher, each with fading momentum, are flashing a major reversal signal.
This could be the final phase before a long-term shift — are you ready for what’s next?
📚 3-Drive Structure Trading Strategy — Full Breakdown
The 3-Drive Pattern is a powerful reversal-based price structure used to spot major turning points in trending markets. It works by identifying three consecutive drives (or pushes) in one direction, typically ending with exhaustion and a high-probability reversal.
Each drive forms a new high or low, but with weakening momentum — especially visible using RSI, MACD, or volume divergence.
🔍 What is the 3-Drive Pattern?
3 consecutive higher highs (or lower lows)
Each drive followed by a shallow pullback
Momentum weakens on each push (divergence forms)
Fibonacci symmetry often present:
- Drive extensions: 127.2%–161.8%
- Pullbacks: usually 61.8%
📉 Bearish 3-Drive (Reversal from Uptrend):
Drive 1: Price makes a higher high with strong momentum
Drive 2: Another higher high, weaker strength
Drive 3: Final high with clear divergence
Reversal: Entry when price breaks below structure
🎯Entry Criteria:
Wait for all 3 drives to form
Confirm with divergence on Drive 3
Use a confirmation candle or structure break
Stop-loss: just beyond the 3rd drive’s high
🎯 Targets:
Conservative: Return to Drive 2 base
Aggressive: Full trend reversal (50%–100% Fib retracement)
🧠 Pro Tips:
Best on 4H, 1D, 3D or 1w timeframes
Confirm with RSI, MACD, or volume divergence
Combine with key S/R or supply-demand zones
💡 Summary:
The 3-Drive pattern is one of the most reliable reversal structures when combined with divergence and Fibonacci symmetry. It's especially powerful at market exhaustion zones and works best with confirmation-based entries.

BTC Setup: 2.7 R:R"Bitcoin Poised for New Uptrend After Bull Flag Breakout Retest"
Bitcoin appears ready to begin a new uptrend after successfully retesting the breakout from a bull flag pattern and completing consolidation above key support.
This setup offers a 2.7:1 risk-to-reward ratio, with the following trade parameters:
Entry: $109,965.79
Stop Loss: $106,300
Target: $120,000