Bitcoin held the $115k level ┆ HolderStatBINANCE:BTCUSDT is currently in a triangle formation just above key support near 112,000. The price recently dipped below short-term support, likely triggering stop-losses, but still holds inside a bullish structure. If momentum builds, a push toward 125,000+ is likely. The trend remains intact above 110,000.
Crypto
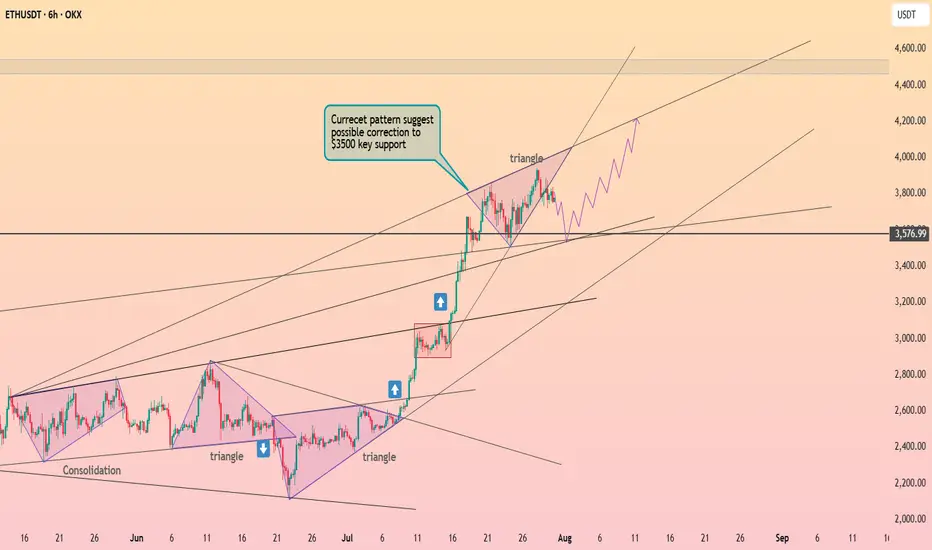
Ethereum is holding the $3700 level ┆ HolderStatOKX:ETHUSDT rallied from multiple triangle breakouts to test 4,400+ before pulling back. It’s now approaching key support at 3,576, which coincides with a major horizontal and trendline intersection. If this zone holds, the next leg up may target 4,600–4,800. Structure remains bullish above 3,500.
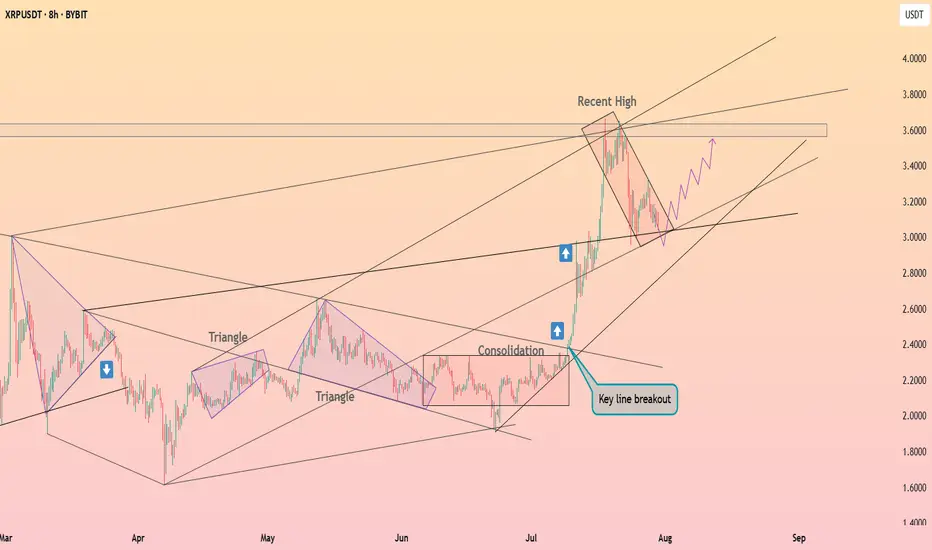
XRP is testing a support ┆ HolderStatBYBIT:XRPUSDT recently broke out of a long consolidation and triangle setup, rallying into the 3.60 region. It is now forming a falling channel — a common bullish continuation pattern. Price must hold the 3.10–3.20 support area for a renewed move toward 3.80–4.00. The broader structure remains bullish until invalidated.
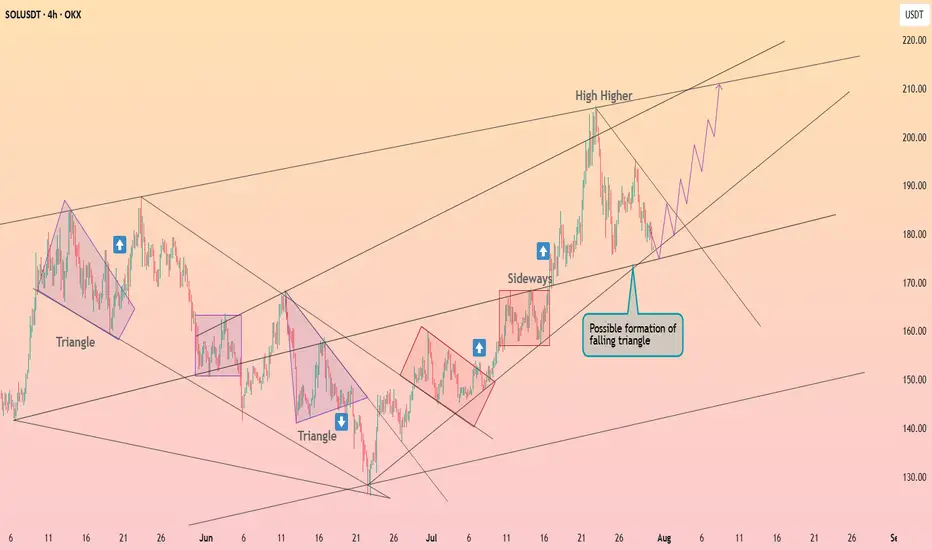
Solana is forming the falling triangle ┆ HolderStatOKX:SOLUSDT is compressing into a possible falling triangle, with support around 180–185 and upward projections pointing toward 210+. The chart has repeatedly shown triangle breakouts into strong rallies. As long as the lower trendline holds, the upside setup remains valid.
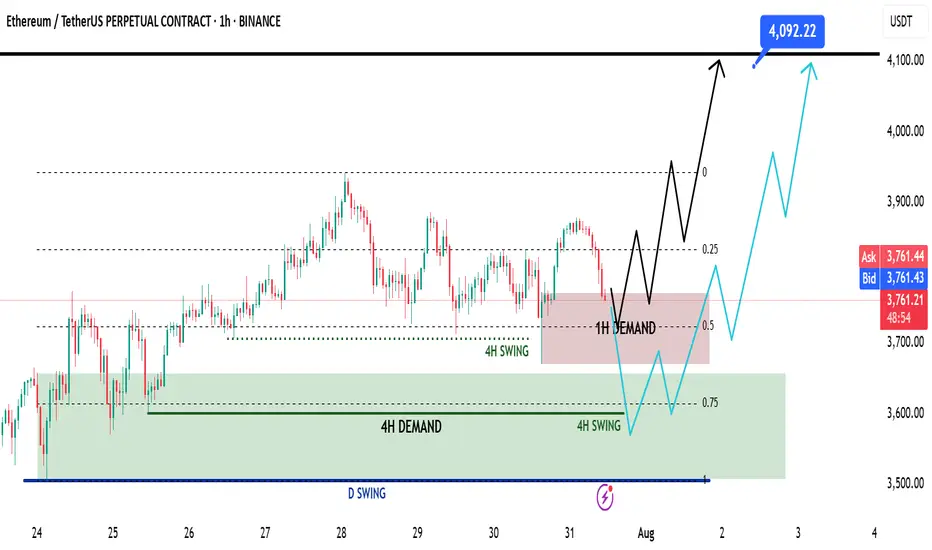
Ethereum Mid Week Update - Swing Long Idea📈 Market Context:
ETH remains in a healthy bullish structure. Despite the recent retracement, price action is still supported by strong demand zones on higher timeframes. No change in the overall sentiment from earlier this week.
🧾 Weekly Recap:
• Price rejected from the Fibonacci 0.5 EQ level — a discounted zone in my model.
• While doing so, it also ran 4H swing liquidity.
• After taking liquidity, ETH formed a 1H demand zone — a sign to look for lower timeframe confirmations for long setups.
📌 Technical Outlook:
→ Price has already tapped into the 1H demand zone.
→ From here, we have two possible scenarios:
Black scenario (ideal):
• Wait for 15M bullish break of structure (BOS).
• Enter after confirmation for long setups from 1H demand.
Blue scenario (deeper retrace):
• If no bounce from 1H demand, expect price to dip toward 0.75 Fib level (max discount).
• Watch for another liquidity run & 1H–4H demand formation.
🎯 Setup Trigger:
✅ 15M bullish BOS inside 1H or 4H demand zones
→ This would be the entry confirmation trigger for longs.
📋 Trade Management:
• Stoploss: Below the swing low of the 15M BOS
• Target: 4090$
💬 Like, follow, and drop a comment if this outlook helped — and stay tuned for more setups each week!
Cardano has successfully completed retesting ┆ HolderStatBINANCE:ADAUSDT is trading inside a symmetrical triangle near support at $0.445. Price continues to coil tightly with lower highs and higher lows, building pressure. A breakout above $0.465 would confirm bullish momentum toward the $0.49–0.50 zone. Key support remains intact and buyers are stepping in at every dip. A major move looks imminent.

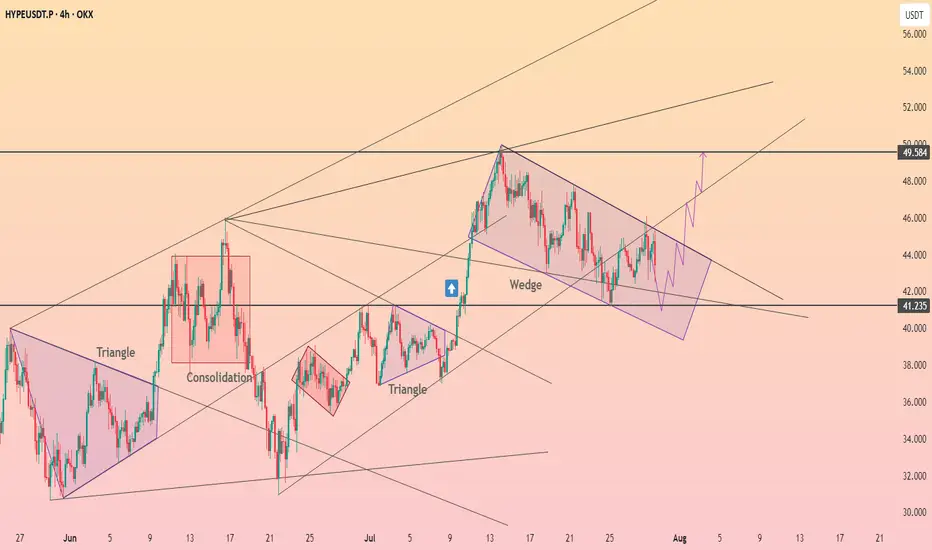
Hyperliquid reached the upper limit of the wedge ┆ HolderStat$BINANCE:HYPEUSDT is currently trading within a falling wedge after a sharp bullish move. Price is consolidating near key support around 41.2, showing signs of pressure building for a potential breakout. A clean break above the wedge resistance may open the path toward 49.5, aligning with the higher trend channel projection.
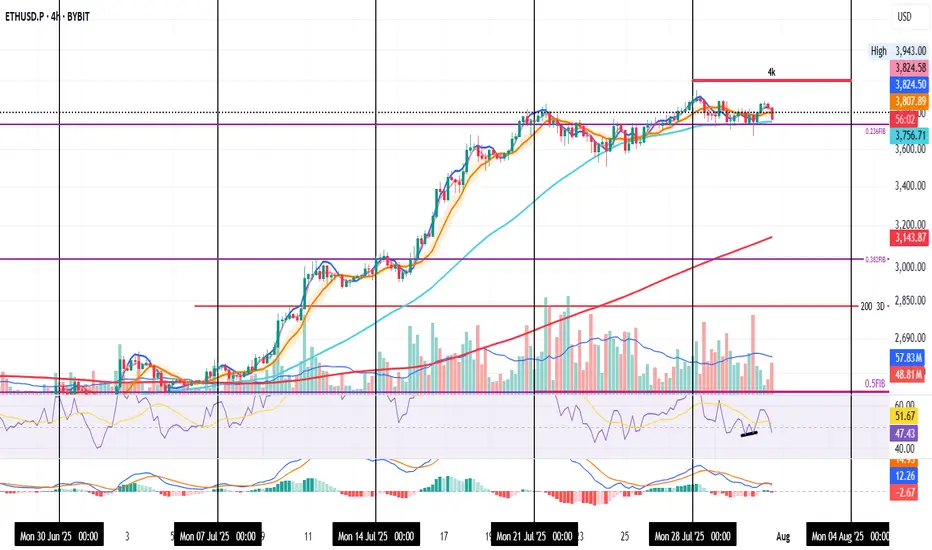
ETH Holding Steady in the Noise
ETH on the 4H
Price is pulling back again — mostly due to sticky inflation.
Even though YoY CPI came in at 2.8% (vs 2.7% expected), MoM data was on target, so the market may just be pricing in “higher for longer.”
Back to the chart — not much has changed.
ETH is still holding above both the 0.236 Fib and the 50MA.
The next real resistance is around $4,000.
Personally, I’d rather see price consolidate and gear up for a clean breakout than rush into it and get rejected.
Right now, it feels like ETH is waiting for direction.
It had a reason to drop — and didn’t.
It had a reason to fly — and paused.
Could be prepping for a boring chop before a sudden move.
I'm still bullish overall. Holding a long.
If it moves against me, I’ll scale out.
If it breaks higher, I’ll scale in.
Always take profits and manage risk.
Interaction is welcome.
Opening A Small Position In FARTCOIN HereGood Morning Trading Family,
I may be a little early here, but at $1.00, I can't resist. I am picking up a small position in FARTCOIN here. I have three targets above. Each will eventually be hit IMO, but for now, I will only be shooting for TARGET #1. I may sell half at that point and let the rest ride.
Now, here are the technical reasons for making my entry here without waiting for my indicator to signal.
First of all, there are three trendlines, all significant, all converging at this one particular point, making this a powerful area of confluence!
Secondly, we broke to the topside of that descending trendline but never really came back to kiss mamma goodbye. Today we are doing that! This is a patent technical move that indicates healthy price fluctuation and is exactly what I have been waiting for.
Third, the VRVP indicates a ton of volume in this area (mostly buyer), which will be tough to break below without significant FUD, which, of course, is always a possibility.
Finally, all of my lower indicators show this thing is starting to get oversold: RSI, MACD, Chalkin MF, HA.
If we do dip lower, I will simply increase my position unless I hit my SL first. My SL is around .78 with my projected first target at 1.66 for a nice 1:3 rrr.
Good luck, all!
✌️Stew

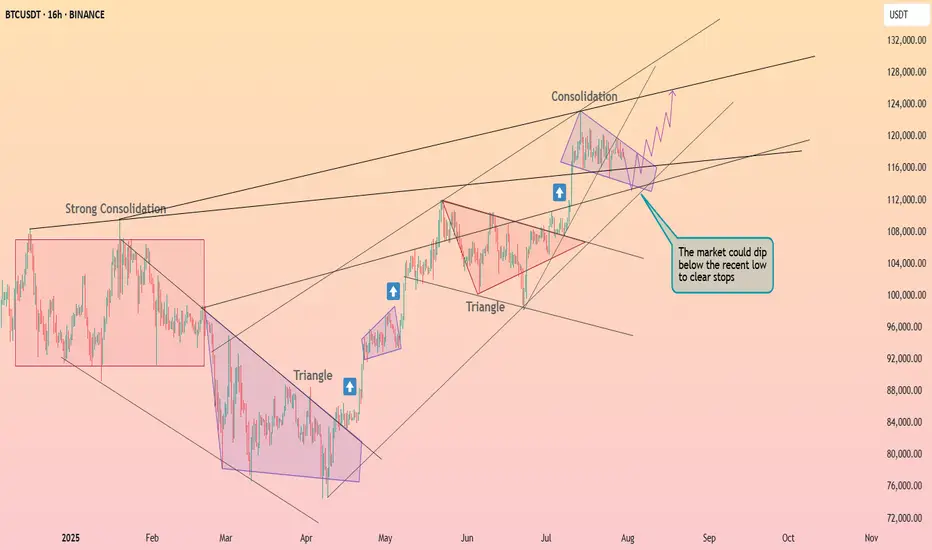
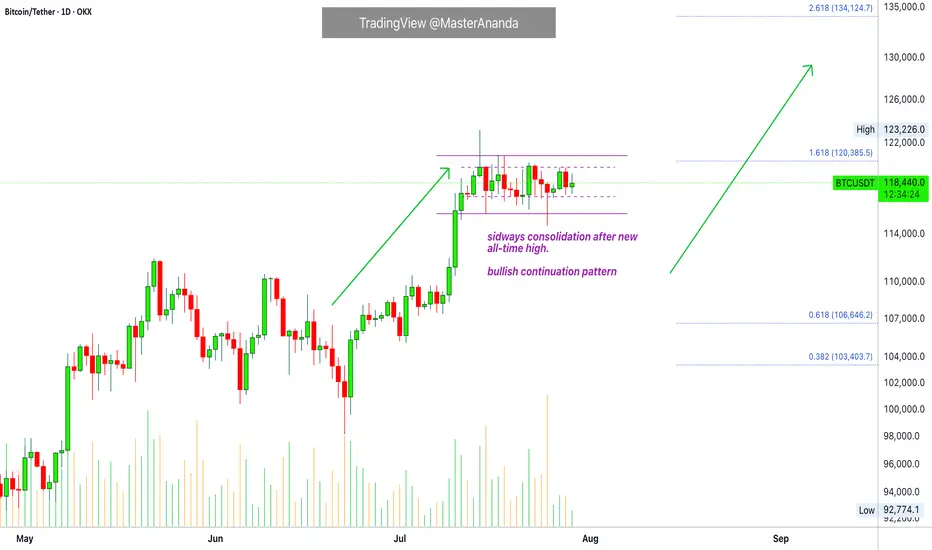
Bitcoin & The Altcoins —Name Your AltcoinBitcoin is sideways right now and is moving in a very tight and narrow range. All the action has been happening between $117,000 and $120,000 based on candle close since 11-July. This is bullish, think about it.
Bitcoin hits a new all-time high and next thing you know it turns sideways very close to resistance. The only drop was short-lived and everything sold was quickly bought. Why is Bitcoin consolidating so close to resistance? It is preparing to move ahead.
What happens when Bitcoin moves forward after so much recovery? Everything experiences a positive cycle. This is a very strong signal.
This chart allows for more whipsaw as you know nothing else is possible in a trading range. We predict the pattern to resolve bullish, but there can be swings to either side. A swing down just as it happened 25-July. A swing up just as it happened 14-July. This is always possible but the end result won't change. Bitcoin will continue sideways but when the sideways period is over, you will not see a move toward $110,000 or $100,000. The break of the trading range will confirm the advance toward $135,000 next month. Bitcoin is likely to continue in the same mode. While Bitcoin consolidates the new advance, the altcoins grow. In this way the entire market continues to recover and grow month after month after month.
Name Your Altcoin
Leave a comment with your favorite altcoin trading pair and I will do an analysis for you. I will reply in the comments section. Make sure to include any questions you might have beforehand.
If you see a comment with a pair you like, boost and reply so these can be done first.
Thanks a lot for your continued support.
Namaste.
TON/USDT | Surges 18% – Eyes on $3.63, Then $4.20 and $4.68!By analyzing the Toncoin chart on the 3-day timeframe, we can see that after a pullback to the $3 area, strong demand kicked in, and within just one week, the price surged over 18%, reaching above $3.5. Toncoin is currently trading around $3.53, and I expect it to hit the $3.63 target soon. The next bullish targets after that are $4.20 and $4.68.
Please support me with your likes and comments to motivate me to share more analysis with you and share your opinion about the possible trend of this chart with me !
Best Regards , Arman Shaban
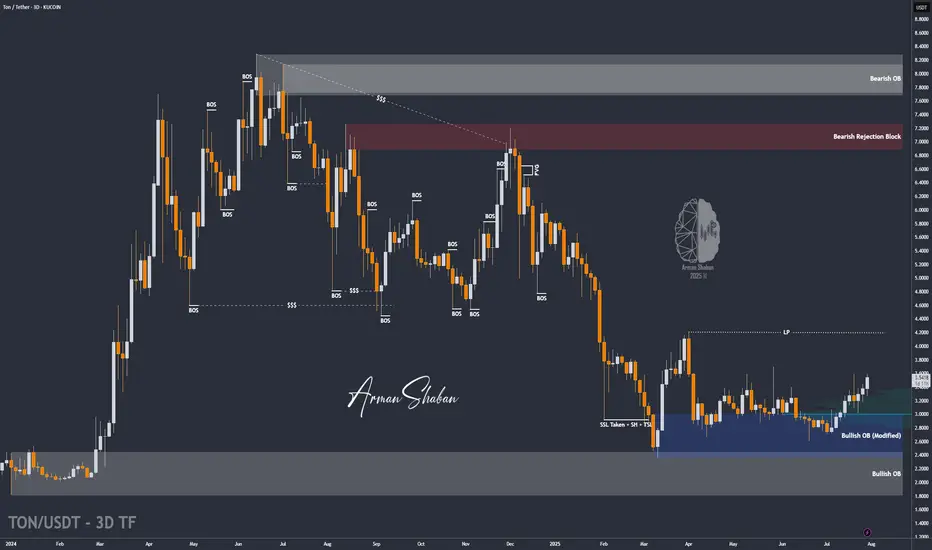
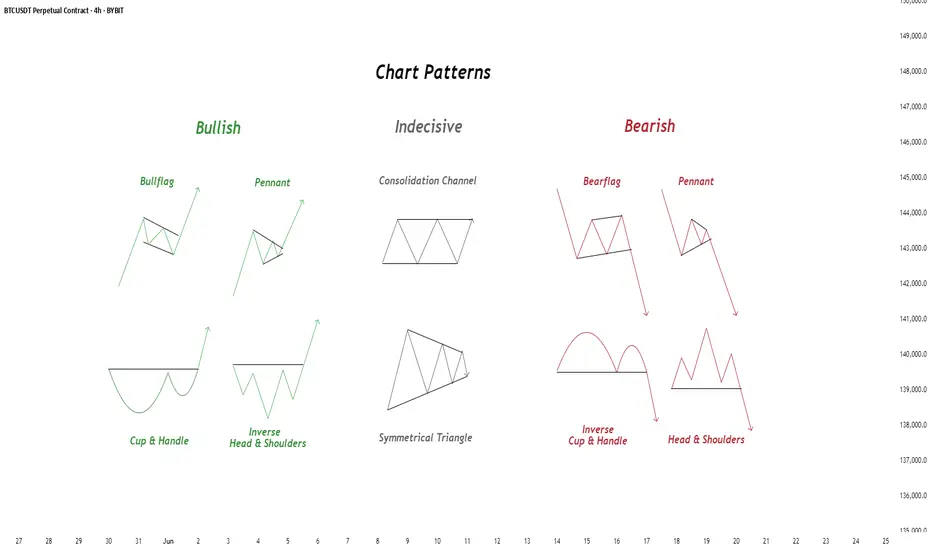
Chart Patterns - How to read them like a ProChart patterns are visual formations on price charts that help traders anticipate potential market movements.
These patterns fall into three main categories: bullish , bearish , and indecisive .
---
1. Bullish Chart Patterns
Bullish patterns often signal that price is likely to move upward.
1.1 Bull Flag
* What it looks like: A sharp upward move followed by a small downward-sloping rectangle (the flag).
* Meaning: After a strong rally, the price consolidates briefly before continuing higher.
* Key insight: A breakout above the flag typically signals a continuation of the trend.
1.2 Pennant (Bullish)
* What it looks like: A strong upward move followed by a small symmetrical triangle.
* Meaning: Similar to the bull flag, but the consolidation takes a triangular form.
* Key insight: Once price breaks above the pennant, the uptrend often resumes.
1.3 Cup & Handle
* What it looks like: A “U”-shaped curve (the cup) followed by a small downward drift (the handle).
* Meaning: This pattern suggests a period of accumulation before price breaks higher.
* Key insight: A breakout above the handle signals the beginning of a new bullish leg.
1.4 Inverse Head & Shoulders
* What it looks like: Three low points, with the middle low being the deepest.
* Meaning: This reversal pattern appears after a downtrend and signals a potential change to an uptrend.
* Key insight: A breakout above the “neckline” confirms the reversal.
---
2. Indecisive Chart Patterns
These patterns show market hesitation, where neither bulls nor bears are clearly in control.
2.1 Consolidation Channel
* What it looks like: Price moves within a horizontal channel.
* Meaning: Market is moving sideways with no strong trend.
* Key insight: A breakout in either direction often leads to a significant move.
2.2 Symmetrical Triangle
* What it looks like: Two converging trend lines forming a triangle.
* Meaning: This is a neutral pattern that can break out in either direction.
* Key insight: Traders wait for a breakout before taking a position.
---
3. Bearish Chart Patterns
Bearish patterns signal a high probability of downward price movement.
3.1 Bear Flag
* What it looks like: A sharp decline followed by a small upward-sloping rectangle.
* Meaning: After a strong drop, price consolidates before continuing lower.
* Key insight: A breakout below the flag suggests a continuation of the downtrend.
3.2 Pennant (Bearish)
* What it looks like: A sharp downward move followed by a small symmetrical triangle.
* Meaning: Similar to the bear flag, but the consolidation takes a triangular form.
* Key insight: A breakout downward typically resumes the bearish trend.
3.3 Inverse Cup & Handle
* What it looks like: An upside-down cup with a small upward drift forming the handle.
* Meaning: Indicates weakness after an uptrend, often followed by a drop.
* Key insight: A break below the handle usually signals a strong bearish move.
3.4 Head & Shoulders
* What it looks like: Three peaks, with the middle one being the highest.
* Meaning: A classic reversal pattern that indicates a potential shift from an uptrend to a downtrend.
* Key insight: A break below the “neckline” confirms the bearish reversal.
---
How to Use These Patterns
* Combine pattern recognition with support/resistance, volume, and indicators for stronger confirmation.
* Always wait for breakouts and avoid acting too early.
* Manage risk with stop-loss orders.
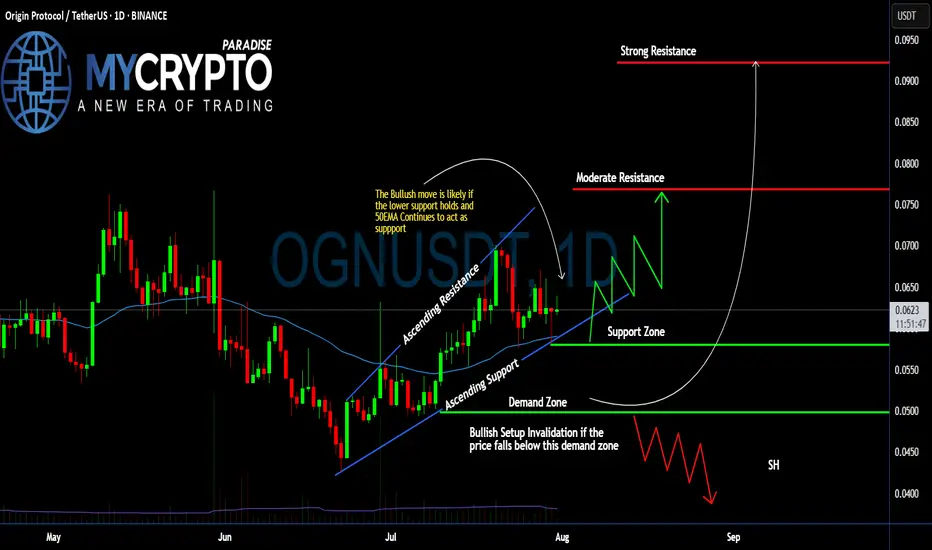
#OGN Ready For a Massive Bullish Move | Must Watch For BullsYello, Paradisers! Is #OriginProtocol about to explode to the upside, or is this a bull trap in disguise waiting to liquidate the impatient? Let’s break down what’s brewing on #OGNUSDT:
💎After forming a clean ascending channel, #OGN has been respecting both the ascending resistance and ascending support levels. Price is currently trading just above the 50 EMA, which has been acting as a dynamic support line since early July. This structure shows clear buyer interest around the $0.058–$0.062 zone—an area that aligns with volume cluster support.
💎The bullish scenario remains valid as long as #OGNUSD holds above the demand zone between $0.0499–$0.0580, and especially if it stays above the 50 EMA. As long as this structure is maintained, we could see a bounce toward the moderate resistance level at $0.076, where previous sellers stepped in and price stalled.
💎If buyers can break through that moderate resistance with strength and rising volume, the next key target lies at $0.092, which aligns with a strong resistance level and high-volume node on the visible range. This area is likely to trigger a reaction, so traders should remain agile.
💎However, if price breaks down below the demand zone, this would invalidate the current bullish setup and open the door for a potential move back toward the $0.045–$0.040 area. A broader shakeout would likely accompany this and could trap many late long entries.
Stay patient, Paradisers. Let the breakout confirm, and only then do we strike with conviction.
MyCryptoParadise
iFeel the success🌴
DOGE/USDT | Eyes Bounce from Key Support – Next Targets Ahead!By analyzing the Dogecoin chart on the daily timeframe, we can see that after reaching the $0.29 area, the price entered a correction and is now trading around $0.22. If DOGE dips into the key support zone between $0.19–$0.21, we could expect a strong bullish reaction. The next potential targets are $0.287, $0.32, $0.41, and $0.70.
Please support me with your likes and comments to motivate me to share more analysis with you and share your opinion about the possible trend of this chart with me !
Best Regards , Arman Shaban

PUMPUSDT: Bullish Breakout and Retest - A Potential 34% Upside?Hello, traders!
Today we're looking at the PUMP/USDT pair on the 4-hour timeframe, and a very clean technical setup is unfolding that points towards potential bullish continuation. Let's break down the key elements of this analysis.
The Analysis
The chart presents a classic breakout and retest scenario, which is often a strong indicator of a trend reversal or continuation.
Descending Trendline Breakout: The most significant feature is the decisive breakout from a major descending trendline that had been capping the price for a considerable period. Breaking this trendline is a primary signal that the previous bearish momentum is weakening and buyers are starting to take control.
Break of Horizontal Resistance (S/R Flip): Following the trendline break, the price also successfully pushed through a key horizontal resistance zone, identified on the chart between approximately $0.002966 and $0.003044. This level has now, as expected, turned into a new support base.
The Retest: We are currently witnessing a pullback to this newly established support zone. This "retest" is a critical phase. A strong bounce from this level would confirm the breakout's validity and suggest that the market has accepted this price floor, paving the way for the next leg up.
Volume Confirmation: Notice the volume bars at the bottom of the chart. There was a visible spike in volume during the initial breakout candles, which adds conviction to the move. It indicates that the breakout was backed by significant buying interest.
The Trade Idea
Based on this structure, a potential long opportunity presents itself.
Entry: A favorable entry point could be found within the current support zone ($0.002966 - $0.003044), especially upon seeing confirmation of a bounce (e.g., a bullish engulfing candle or a hammer on the 4H or 1H chart).
Target: The analysis points to a primary target at the next major resistance level, located around the $0.004000 psychological mark. As measured on the chart, this represents a potential upside of over 34%.
Invalidation: This bullish outlook would be invalidated if the price fails to hold the current support and decisively closes back below the $0.002966 level. Placing a stop-loss below this zone is a prudent risk management strategy.
Conclusion
In summary, PUMPUSDT is displaying a textbook bullish setup. The combination of a trendline breakout, an S/R flip, and a live retest offers a compelling case for potential upside. As always, manage your risk carefully and wait for your preferred confirmation signals before entering a trade.
Disclaimer: This is not financial advice. The analysis provided is for educational and informational purposes only. Trading cryptocurrencies involves a high level of risk. Please conduct your own research and risk assessment before making any investment decisions.

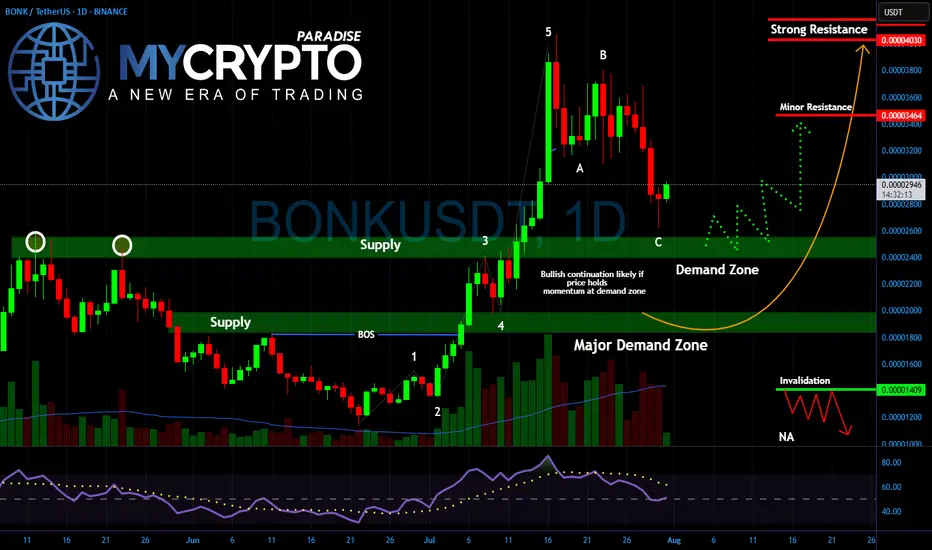
BONK About to Break Out or Break Down?Yello Paradisers! Are you ready for the next explosive move in #BONK? After nailing the last rally and spotting the impulsive 5-wave structure early, we’re now entering a critical phase — and what happens next could decide whether BONK flies or collapses.
💎The recent pullback has followed a clean A-B-C corrective structure, landing perfectly into the key demand zone between 0.00002600 and 0.00002200. This zone now acts as the battlefield between smart money buyers and weak-handed sellers. Price action is slowing down, volume is drying up, and RSI is resetting all classic signs of a potential bullish continuation. But if buyers fail to step in with conviction, the market could easily sweep lower to test the major demand zone closer to 0.00001800.
💎As long as price holds this area and confirms a reversal with follow-through momentum, we could see #BONK heading back toward 0.00003460 as the first stop, and possibly a retest of the 0.00004030 resistance. However, if price closes below 0.00001409, that would invalidate the bullish setup and confirm a deeper corrective phase.
Patience and strategy win the game, Paradisers! The market is designed to shake out weak hands before the real move happens.
MyCryptoParadise
iFeel the success🌴
BITCOIN & 134KAfter Bitcoin rallied on July 8 and consolidated for two weeks, this bull flag remains valid, targeting $134,000.

BINANCE COIN (BNBUSD): Bullish Continuation Ahead
BNB is going to resume growth after a retest of a recently broken structure.
A bullish breakout of a resistance line of a bullish flag provides a strong bullish confirmation.
I think that the price will go up to 844 level.
❤️Please, support my work with like, thank you!❤️

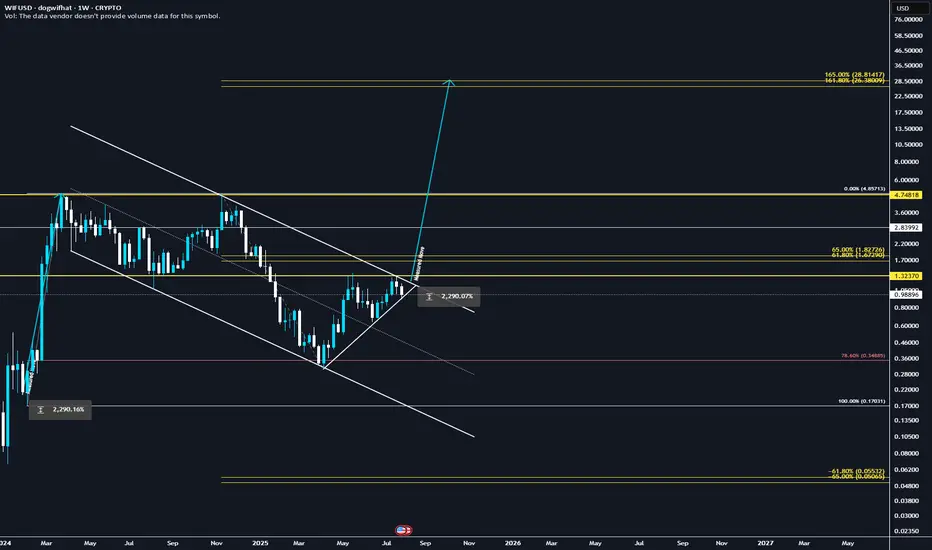
They're lying! WIF will explode to 28.8$ ✅ Golden Pocket Extension: $28.80 aligns with the 1.618–1.65 fib extension (golden pocket zone) from the last major impulse.
✅ Measured Move: Breakout from the prior downward consolidation projects to ~$28.80 when using the height of the range added to the breakout point.
✅ Confluence = High Probability: Both fib extension and measured move target the same zone, increasing confidence.
✅ Momentum + Meme Rotation: If broader meme coin rotation continues, WIF has narrative + volatility fuel.
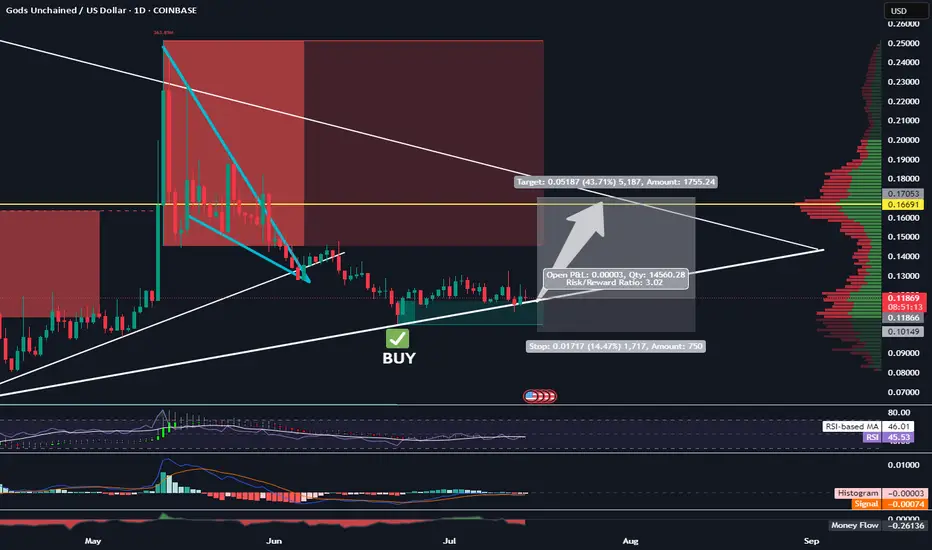
Long GODS - Target 17 Cents - 1:3 RRRTrading Fam,
As I continue to gain experience with my AI-created indicator, I am learning to remain patient and wait for the perfect setups. We have one here on GODS. You can see that we've returned to the bottom of a larger triangle and are using it as support. Additionally, we are within a favorable liquidity block where buyers tend to accelerate the volume. My indicator gave the BUY signal 2 weeks ago, and there has been plenty of sideways accumulation since the signal flashed. Probability suggest that GODS will pump soon.
I'll be targeting 17 cents with a SL at 10 for a 1:3 RRR.
Let's go!
Stew
BTCUSD – Descending Channel or Bullish Flag?BINANCE:BTCUSDT – Market Maker’s Game Inside a Descending Channel
Timeframe: 2H | MJTrading View
Market Structure Overview:
Bitcoin recently printed a new ATH at $122,000 after a parabolic run from the previous ATH at $111,937.
Since then, price has been consolidating inside a descending channel, which could act as a bullish flag in higher timeframes.
Liquidity pools are clearly formed:
Above $122K – resting stops of late shorts.
Below $115K–$114K – weak long stops and untapped demand near the Order Block (OB).
Key Levels & Liquidity Zones:
Upside:
$122K Liquidity Pool → If swept, could trigger momentum towards $124K–$125K.
Downside:
$116K OB → First defensive zone for bulls.
$112K Strong Support → Aligns with previous ATH breakout base.
Market Maker’s Dilemma:
If you were a market maker… which liquidity pool would you hunt first?
Price is coiling tighter within the channel, and both scenarios are possible:
Upside Sweep → Rapid breakout above $122K to clear shorts, then potential continuation.
Downside Sweep → Sharp drop into $116K–$112K liquidity, flushing longs before any recovery.
⚡ MJTrading Insight:
This is the classic market maker compression – first sweep likely determines direction.
Patience here is key; let the liquidity tell the story.
#BTCUSD #Bitcoin #Liquidity #SmartMoney #PriceAction #MJTrading #ChartDesigner #CryptoAnalysis
Psychology Always Matters:

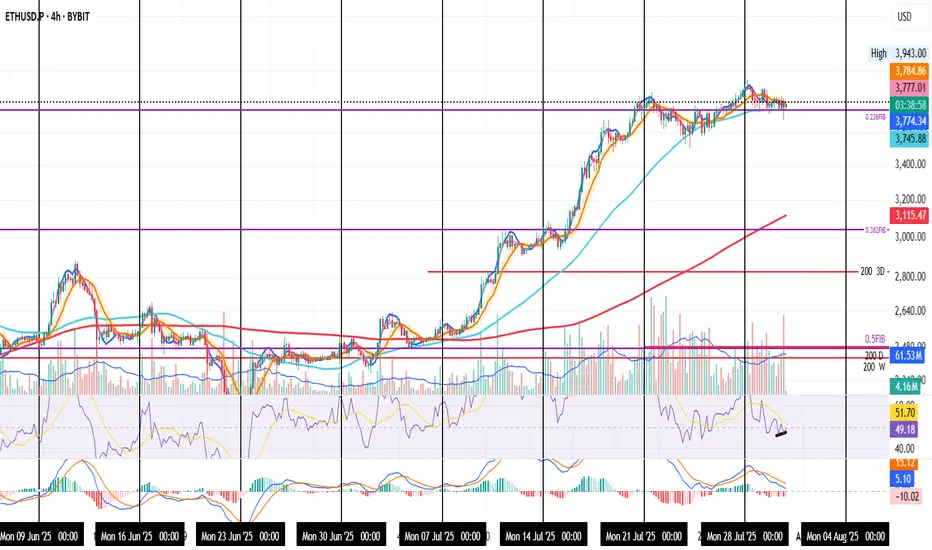
ETH: Buyers Show Their HandETH on the 4H
The Fed noise is gone, now it’s just pure market intent.
Price wicked below the 0.236 Fib, but buyers stepped in fast, showing strength at that level.
A small bullish divergence is forming on the RSI. If ETH holds above the Fib, that signal could gain momentum.
Always take profits and manage risk.
Interaction is welcome.
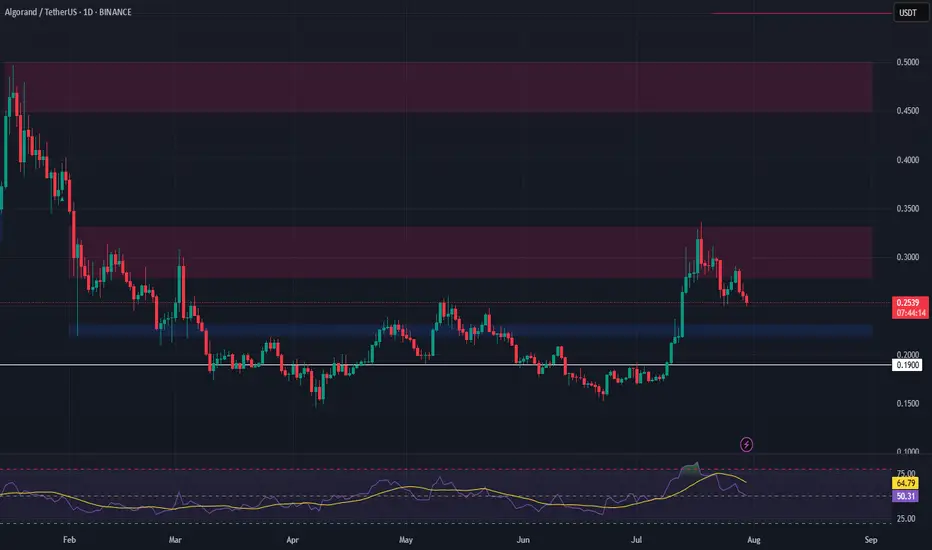
ALGO Swing Trade – Waiting for Pullback to Key SupportAfter a 100%+ surge, ALGO is now retracing and approaching a critical support zone. A dip into this area could offer a strong entry for the next leg higher.
📌 Trade Setup:
• Entry Zone: $0.22 – $0.23
• Take Profit Targets:
o 🥇 $0.28 – $0.33
o 🥈 $0.45 – $0.50
• Stop Loss: Just below $0.19