XMR Long Swing Setup – 50% Retrace with Structure ShiftXMR rallied from $200 to $400 and has now pulled back 50% of that move. With price reclaiming the 20-day SMA and a recent structure shift, there’s a solid setup forming with ~60% probability of continuation.
📌 Trade Setup:
• Entry Zone: $305 – $315
• Take Profit Targets:
o 🥇 $360
o 🥈 $400
• Stop Loss: Daily close below $300
Crypto

Bitcoin can turn around from seller zone and start to declineHello traders, I want share with you my opinion about Bitcoin. The price previously broke above the support line and made a strong bullish move from the buyer zone (99300–100500 points). After the breakout, the price started rising steadily and is now approaching the Seller Zone (108500–109500), which also coincides with the resistance line of the downward channel. This area has shown strong bearish pressure in the past. Every time the price entered this zone, it quickly reversed. It’s a key area where many traders seek short-term opportunities. Currently, price is just entering this zone again and showing early signs of weakening momentum. Given the channel's structure, past price behavior near this resistance level, and the presence of the seller zone, I expect BTCUSD to turn around soon. Once the price rejects this level, I anticipate a reversal and a move back into the channel, continuing the downward trajectory. My first target is set at 103000 points, near the center of the range and above the support level (100500). This area has been tested multiple times before and may act as a strong buffer again. Please share this idea with your friends and click Boost 🚀
Disclaimer: As part of ThinkMarkets’ Influencer Program, I am sponsored to share and publish their charts in my analysis.

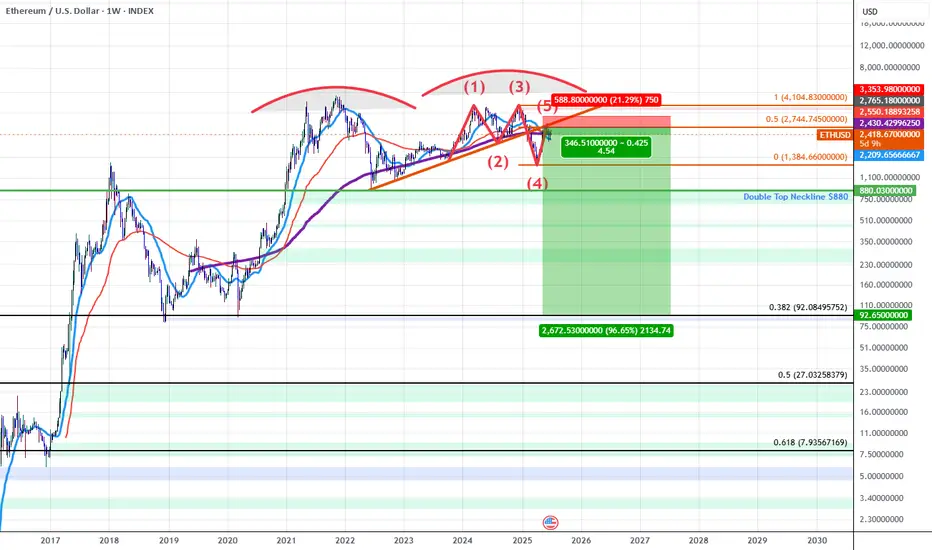
ETHUSD: Double Top into A Bearish 5-0 BreakdownETH for the last 5 years has been developing a Double Topping pattern which has put in a series of lower highs during the most recent 2nd run up. As we've confirmed these lower highs we've broken down below trendline and found resistance at the trendline which happens to have confluence with the PCZ of a Bearish 5-0 wave formation.
As we begin to find weakness and Bearish price action begins I suspect price will make it's way towards the neckline of the double top aligning with the $880 price level if ETH breaks below that level there will be no significant support until it reaches the all-time 0.382 retrace down at around $92.10.
In short it seems ETH is in the early stages of a macro breakdown which could result in value declines greater than 80%.
HolderStat┆BTCUSD forming the triangleBINANCE:BTCUSDT has reclaimed the $106,000 support and broken out of a triangle structure. The path now leads toward 111K, a major resistance zone. Similar setups have triggered strong rallies before, and bulls are defending levels aggressively.

HolderStat┆ETHUSD fixed above the supportBINANCE:ETHUSDT broke out from a triangle and is holding above the 2,447 zone. The current ascending structure targets 2,700 in the near term. Reclaiming short-term resistances confirms a bullish reversal from recent lows, similar to past triangle breakouts.

HolderStat┆XRPUSD before retest of the $2 levelBINANCE:XRPUSDT has rebounded from its 2.08 base and broken out of consolidation, aiming for the upper diagonal resistance near 2.40–2.60. With recurring bullish patterns and a history of strong follow-through after similar setups, momentum may build if 2.20 is cleared.

HolderStat┆SOLUSD aims for the $170 levelBINANCE:SOLUSDT has broken above triangle resistance, retesting the $146.60 level as new support. The breakout echoes earlier consolidation-based rallies, opening the path toward $170. As long as the structure remains intact, bulls could extend the climb over the next few sessions.

HolderStat┆ADAUSD formed rising bottomBINANCE:ADAUSDT has formed a symmetrical triangle after finding firm support around 0.54. Previous consolidation zones have led to significant breakouts, and the current structure is showing early signs of a similar rally. If bulls manage to reclaim 0.58, a climb toward 0.66 and 0.70 becomes likely, with upper trendline resistance acting as a magnet for price.

XAU/USD (Gold vs. US Dollar) 4h chart pattern XAU/USD (Gold vs. US Dollar) on the 4-hour timeframe displays a bullish cup and handle pattern forming, with a breakout above the handle resistance and Ichimoku cloud.
Technical Observations:
Cup and Handle pattern indicates bullish continuation.
Breakout has occurred above trendline and handle.
Price is trading near $3,350 (approx).
Two upside TARGETS are marked on the chart.
---
🎯 Projected Targets (Approximate):
Based on your chart:
1. First Target (TP1): Around $3,390 - $3,395
2. Second Target (TP2): Around $3,425 - $3,430
These targets align with the measured move of the cup height projected from the breakout level.
---
✅ Confirmation:
Price is above the trendline and trying to hold above the Ichimoku cloud.
Entry would be ideal on a pullback to the breakout zone (~31,335-$3,340) for lower risk.
Stop-loss can be considered below the handle low (~$3,310 or $3,305).
Let me know if you want Fibonacci-based targets or support/resistance levels as well.

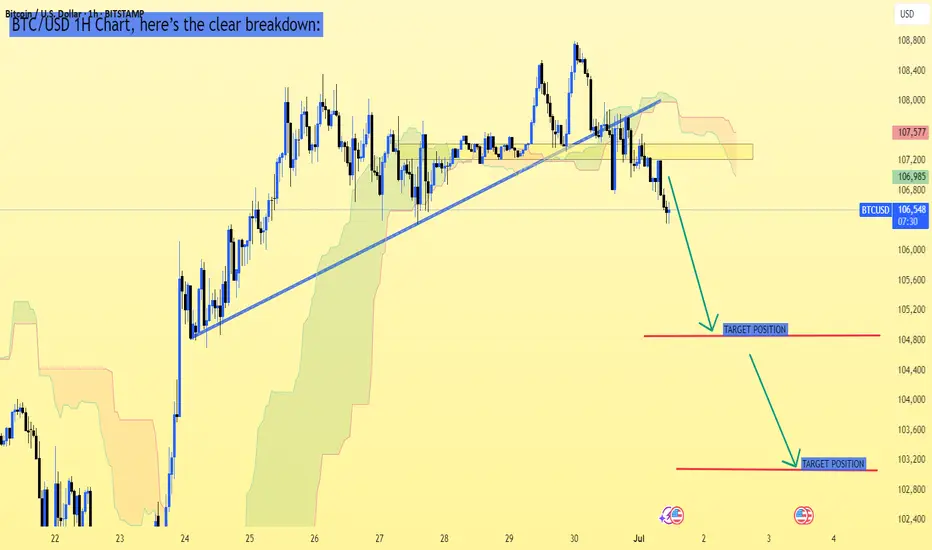
BTC/USD 1H Chart, here’s the clear breakdown:BTC/USD 1H Chart, here’s the clear breakdown:
---
Current Price:
Around 106,636 USD
---
Bearish Setup Observations:
Price has broken the ascending trendline support
Price is below Ichimoku Cloud — bearish confirmation
Retest of broken trendline area failed, suggesting more downside
---
Target Levels Based on Your Chart:
✅ First Target: Around 105,200 - 105,400 USD
✅ Second Target (Final Target): Around 103,200 - 103,500 USD
---
Conclusion:
Bearish momentum is strong; watch for price to test 105,200 zone
If that level breaks, likely move toward 103,200
Resistance area remains near 107,200 - 107,500 (good stop-loss zone for shorts)
---
Would you like a risk management suggestion for this setup? Let me know!
Silver (XAG/USD) on the 1-hour timeframe.Silver (XAG/USD) on the 1-hour timeframe, the chart shows a bullish breakout from a symmetrical triangle pattern. Here's the target breakdown:
📈 Silver Bullish Targets:
Current Price: Around 36.42
1st Target (TP1): Approximately 36.95 – 37.00
2nd Target (TP2): Approximately 37.40 – 37.50
These targets are based on the breakout from the triangle and previous resistance zones marked on your chart.
🛑 Suggested Support Zone (Breakout Retest Area):
Around 36.00 – 36.20 (acts as support now after the breakout)
If price holds above this zone, the bullish structure remains valid. Let me know if you'd like stop loss suggestions or lower timeframe analysis.

USD/JPY (4H timeframe) shows a clear break 0ut.USD/JPY (4H timeframe) shows a clear break below the ascending trendline and Ichimoku cloud support, suggesting a bearish continuation.
Key Bearish Targets (Based on the chart):
1. First Target Zone:
📉 140.88
This level aligns with previous structure support and is marked as the initial target on the chart.
2. Second Target Zone:
📉 138.85 – 139.00
This is a deeper support zone and is indicated as the next bearish leg if price momentum continues downward.
Summary:
Current Price: ~142.74
Trend: Bearish (Breakdown from trendline + Ichimoku bearish signals)
Target 1: 140.88
Target 2: 138.85
Let me know if you want SL (stop-loss) or entry suggestions.

SHORT ON BITCOINBITCOIN has continue to create lower highs at a major resistance zone.
I will be selling bitcoin looking to make over 8000 to 20,000 points.

EUR/USD.4h chart pattern.EUR/USD 4H chart, I can see an ascending trendline with a breakout to the upside, suggesting bullish momentum. You’ve also marked a "TARGET" zone visually on the chart.
Estimated Target:
Based on standard breakout and trend continuation principles:
Current Price: Around 1.1598
Visual Target Zone (as per your chart): Near 1.1700
Potential Target Zone:
1.1700 - 1.1720 (Approximate zone for bullish continuation if breakout holds)
Notes:
✅ Strong bullish structure confirmed by higher highs and trendline support
✅ Breakout already in motion; as long as price stays above the trendline, bullish target remains valid
✅ Watch key support at 1.1535 - 1.1500; price falling below this weakens bullish outlook
Would you like Fibonacci or measured move targets calculated more precisely? Let me know!


EUR/USD 4H Chart Pattern, here's the analysis..Looking at My EUR/USD 4H Chart Pattern, here's the analysis:
Current Price:
Around 1.1819
Observations:
Price is moving inside an ascending channel
Breakout from the upper channel line is happening
Ichimoku Cloud shows bullish momentum as price is well above the cloud
---
Target Levels:
✅ First Target Zone: 1.1900 - 1.1950
✅ Final Target Zone: 1.2000 - 1.2020 (as marked on your chart)
---
Notes:
Watch for strong breakout confirmation above 1.1850
If momentum continues, price can reach 1.2000
Use stop-loss below 1.1750 to manage risk
---
If you want, I can help suggest stop-loss, entry, and risk management in detail. Let me know!

GOLD 3H Chart Pattern, I have marked a cup formationGOLD 3H Chart Pattern, I have marked a cup formation, which often indicates a bullish reversal setup. Based on the chart:
Key Levels:
Current Price Zone: Around 3,323 - 3,330
First Target: Near 3,380 - 3,400
Final Target: Near 3,440 - 3,460
Analysis:
Price is forming a cup pattern with resistance around 3,380 - 3,400
Break above 3,400 could lead towards the final target zone of 3,440 - 3,460
Watch for price reaction near Ichimoku Cloud; clean breakout above the cloud confirms bullish momentum
Suggested Targets:
✅ First Target: 3,380 - 3,400 USD
✅ Second Target: 3,440 - 3,460 USD
Note: Wait for confirmation above 3,330 - 3,340 and bullish momentum to continue.
If you want, I can also give stop-loss and entry suggestions based on this chart. Let me know!

AAPL triangle breakout pattern (bullish bias in this case).📈 Chart Pattern Observed:
This is a symmetrical triangle breakout pattern (bullish bias in this case).
Price has broken out or is near breakout above the descending trendline.
Ichimoku cloud thinning and flattening indicates potential bullish momentum building up.
---
🎯 Target Levels Based on Chart:
1. First Target Point:
Price Level: Around $225.00 USD
This is the initial breakout target, often calculated by measuring the widest part of the triangle and projecting upward from the breakout point.
2. Second (Final) Target Point:
Price Level: Around $250.00 USD
This is a more extended target if bullish momentum continues strongly and volume confirms the move.
---
🔍 Additional Notes:
Current Price Zone: Around $202–$206 USD
Stop-Loss Idea: Below the recent swing low or lower trendline, around $195–$197 USD
Entry Idea: On confirmed breakout and retest, above $206.50–$208.00 USD
Would you like help with a trade plan including entry/SL/TP levels based on risk-reward?

SILVER US$ 1H CHART PATTERNSilver (XAG/USD) 1H timeframe, here’s a breakdown of the target levels indicated:
📈 Chart Analysis Highlights:
The chart shows a bullish ascending triangle pattern, which is typically a continuation pattern signaling upward movement.
The price has recently broken above resistance around the 36.36–36.40 area.
You’ve marked two target points:
---
🎯 Target Levels:
1. First Target Point:
Price Level: Approximately 37.40 USD
This is the first significant resistance level after breakout, potentially reachable if momentum continues.
2. Second Target Point (Extended Target):
Price Level: Approximately 37.80 USD
This would be a more ambitious target assuming strong bullish follow-through.
---
📌 Notes:
Ensure to monitor volume on breakout for confirmation.
Risk management is important — consider stop-loss near 36.10 or below the ascending trendline.
Watch for any false breakouts especially near Ichimoku cloud resistance zones.
Would you like help setting up entry/exit levels or risk-reward ratios?

ETH Pushed Back, Support in Sight
ETH on the 4H just closed below the last daily close and the 0.5 Fib again, after getting pushed back from the 4H 200MA and daily 200MA resistance zone.
The next key supports are the weekly 200MA and the local support zone.
Also worth noting: Trump and Musk are stirring things up again. The last time this dynamic appeared, it triggered a selloff a few weeks ago, even before the conflict began.
Always take profits and manage risk.
Interaction is welcome.

do not SHORT Bitcoin with 20XA consolidation range happens when the market trades sideways, in a neutral capacity. This sideways trading is neither bearish nor bullish, thus neutral. The bearish or bullish tendencies can only be defined based on the broader market structure.
If the consolidation range develops coming from a major drop, you can say that the market is bearish and the consolidation a bearish consolidation even if the breakout happens to the upside. Once it happens to the upside we can say that a reversal developed but the tendencies were bearish nonetheless.
If the consolidation range develops coming from a major rise, you can easy say while being correct that the market is bullish and the consolidation phase a bullish one, because of the bigger structure, previous price action and the chart.
Bitcoin is consolidating with bullish tendencies but there is a boundary which we call resistance and another boundary which we call support, this is the trading range. When the market is ranging, this is when margin traders lose the most because the trend remains hidden and money tends to be made when the market is in a clear trend.
Whenever the upper boundary gets challenged we get a retrace and a test of support. Whenever the lower boundary gets tested prices recover and move back up. This process gets repeated for as long as it is needed to remove all the weak hands, most of the signals are pure noise.
This is the situation in which we find Bitcoin today. Ultra-bullish but sideways and anything can happen short-term. Do not SHORT Bitcoin with 20X. You might end up with some fast and easy profits.
Thank you for reading.
Namaste.

Bitcoin H4 | Potential bullish bounce off an overlap supportBitcoin (BTC/USD) is falling towards an overlap support and could potentially bounce off this level to climb higher.
Buy entry is at 106,535.50 which is an overlap support that aligns with the 23.6% Fibonacci retracement.
Stop loss is at 104,600.00 which is a level that lies underneath a swing-low support and the 38.2% Fibonacci retracement.
Take profit is at 108,808.50 which is a multi-swing-high resistance.
High Risk Investment Warning
Trading Forex/CFDs on margin carries a high level of risk and may not be suitable for all investors. Leverage can work against you.
Stratos Markets Limited (tradu.com ):
CFDs are complex instruments and come with a high risk of losing money rapidly due to leverage. 63% of retail investor accounts lose money when trading CFDs with this provider. You should consider whether you understand how CFDs work and whether you can afford to take the high risk of losing your money.
Stratos Europe Ltd (tradu.com ):
CFDs are complex instruments and come with a high risk of losing money rapidly due to leverage. 63% of retail investor accounts lose money when trading CFDs with this provider. You should consider whether you understand how CFDs work and whether you can afford to take the high risk of losing your money.
Stratos Global LLC (tradu.com ):
Losses can exceed deposits.
Please be advised that the information presented on TradingView is provided to Tradu (‘Company’, ‘we’) by a third-party provider (‘TFA Global Pte Ltd’). Please be reminded that you are solely responsible for the trading decisions on your account. There is a very high degree of risk involved in trading. Any information and/or content is intended entirely for research, educational and informational purposes only and does not constitute investment or consultation advice or investment strategy. The information is not tailored to the investment needs of any specific person and therefore does not involve a consideration of any of the investment objectives, financial situation or needs of any viewer that may receive it. Kindly also note that past performance is not a reliable indicator of future results. Actual results may differ materially from those anticipated in forward-looking or past performance statements. We assume no liability as to the accuracy or completeness of any of the information and/or content provided herein and the Company cannot be held responsible for any omission, mistake nor for any loss or damage including without limitation to any loss of profit which may arise from reliance on any information supplied by TFA Global Pte Ltd.
The speaker(s) is neither an employee, agent nor representative of Tradu and is therefore acting independently. The opinions given are their own, constitute general market commentary, and do not constitute the opinion or advice of Tradu or any form of personal or investment advice. Tradu neither endorses nor guarantees offerings of third-party speakers, nor is Tradu responsible for the content, veracity or opinions of third-party speakers, presenters or participants.

BTC - Consolidation, Manipulation & DistributionMarket Context
The current price action unfolds within the broader structure of a bullish leg that began after a sharp reversal near 97,000. This impulsive rally created a clear Fair Value Gap on the 4-hour chart—left behind as price surged upward with minimal resistance. Following this move, the market entered a consolidation phase, forming a range that has now broken to the upside. This kind of breakout often attracts breakout traders, but in this case, the context signals something more calculated.
Buy Side Liquidity Sweep Following Consolidation
The breakout above the consolidation range led directly into a Buy Side Liquidity Sweep, as price ran the highs just above the marked range. These highs acted as a magnet for liquidity—stop losses from short sellers and buy stops from breakout traders were likely pooled in that area. The quick rejection following this sweep suggests the move was not backed by genuine demand, but rather served the purpose of liquidity collection by larger players.
Manipulation and Distribution
This is a textbook example of manipulation into liquidity. Price was engineered to move upward into a zone of interest, taking out the Buy Side Liquidity before sharply reversing. The strong rejection signals distribution—institutions likely offloaded positions into the influx of late buyers. This kind of pattern often precedes a larger markdown, particularly when followed by lower timeframe bearish structure breaks.
Unfilled Fair Value Gap as a Draw
Beneath the price lies an unfilled Fair Value Gap, a zone of imbalance left behind by the earlier impulsive move. These areas often act as magnets for price, especially once liquidity objectives to the upside have been completed. Now that the sweep has occurred and distribution is underway, there is a strong probability that price will begin to seek rebalancing within this Gap. The area between 104,000 and 103,500 stands out as a high-probability target for the next leg down.
Execution Insight
If you're looking to enter short, it may be wise to wait for confirmation on a lower timeframe—such as a bearish break of structure or an internal Gap forming during the retracement. A 5-minute timeframe can often give early signs of rejection or supply stepping in. Being patient and allowing the market to reveal intent is crucial, especially after liquidity-driven moves like this.
Final Thoughts
Price doesn’t move randomly—it seeks liquidity and fills inefficiencies. This chart beautifully illustrates that logic, from engineered consolidation to a manipulative sweep, and now potentially toward rebalancing.
If you found this breakdown helpful, I’d really appreciate a like—it helps support the work and keeps this kind of content going. Let me know in the comments what you think, or if you’re seeing it differently. I'm always up for a good discussion.
