Bitcoin Weekly & $120,000This weekly Bitcoin chart says it all... Please, allow me to reveal to you what the future holds!
Good evening my fellow Cryptocurrency trader, what a wonderful day.
Only one week ever produced a higher close than the current price. Only once, 19-May, Bitcoin managed to close above $107,000... What happens if Bitcoin closes above $107,000? New all-time high confirmed.
Two days remain for the week to close and we—the bulls—only need to maintain a price of $107,000 or higher to send such a strong bullish signal that everybody will come out and start buying.
The next target on this timeframe is $120,000.
Bitcoin is using EMA13 as support. This level was tested and holds, the same for EMA8. When Bitcoin moved above these levels in April, it produced an advance from $83,000 to $112,000, more than 33%. The price now is $107,000 but instead of recovering from below EMA8/13, BTCUSDT is trading above; this means that the bullish bias is fully confirmed.
The weekly timeframe looks great. We can expect higher prices soon, with growth happening for an extended period of time. Bitcoin is very strong now and this is only the start.
I will continue to share proof that shows the entire Cryptocurrency market going up.
Thank you for reading.
Leave a comment with your questions.
Thanks a lot for your support.
Namaste.
Crypto

$420 Solana Within 2 Months —TargetsSolana is on a path to a hit a price target of $420 mid-term, within 1-3 months. This is the continuation of the uptrend that started in early April with the end of the previous correction and a more than a year long strong low.
This is not for the faint of heart. Solana is preparing for something massive, even scary but positive. $600+ is also possible but we are going step by step and $420 is the first step.
Immediately when prices start to rise Solana is likely to find resistance around $220 and $253.
The last high, January 2025, would be the minimum on this bullish wave. This would be price tag of $296.
The end of the retrace happened 22-June. This means that the market is already bullish for an entire week. Bitcoin is about to produce the best possible weekly close. As Bitcoin is ultra-bullish above $106,000/$107,000, the altcoins can continue to recover and will aim higher trying to catch up. Of course, no altcoin can catch up to Bitcoin but invariably the entire market will grow.
The wait is over, we are bullish now. Timing is great.
Bullish momentum will grow for weeks and then a major force will permeate the market, something not seen in many years. I hope you are prepared.
Namaste.

ETHEREUM WILL GROW|LONG|
✅ETHEREUM consolidated
Above the horizontal support
Around 2400$ and now we are
Finally seeing a bullish rebound
So we are bullish biased and
We will be expecting a
Further move up
LONG🚀
✅Like and subscribe to never miss a new idea!✅
Disclosure: I am part of Trade Nation's Influencer program and receive a monthly fee for using their TradingView charts in my analysis.

Can Ethereum start a daily uptrend?This daily uptrend might fail because btc dominance is strong but eth bulls are watching

Aave: Next High the Dec. 2024 Price ($400), Then Higher...I thought about Aave today. The retrace was minimum, it was swift and strong. As soon as the retrace is over we get the continuation of the bullish wave. That is what I see on this chart.
The recent retrace did not reach the 3-Feb. low, and this is all you need to know.
Current action is indicative of the continuation of the bullish wave. When a move is very strong, with too much force, it cannot go for too long. This happened with the drop from 11 to 22-June. It was so strong and it ends in a flash. Once it is over there is no other place for the market to go. If the down-move is over, prices can only grow. Aave is growing now, it will hit $400 as the next target, the December 2024 high just to continue higher.
Expect more retraces and corrections along the way. Just as you saw a few weeks back, but always remember that retraces are just an opportunity to buy-in, rebuy and reload. The market will always recover and produce new and more growth.
Namaste.

Dogs Can Yield 8,288% with 8X Leverage (Great Timing!)You are going to love me for giving you this... Why? Because you can make easily 1,000% profits. Perfect entry, perfect price, perfect timing. Easy win.
The market moves based on cycles and within these cycles we have waves... Good afternoon my fellow Cryptocurrency trader, how are you feeling today?
Feeling that feeling you get when you know you are getting close to something great.
Technical analysis
Let's focus on the chart. DOGSUSDT is now starting to recover from a higher low. Let's keep it very simple. Look at the chart and go back to 17-April. See? From this date prices start to grow until resistance is hit. It is the same. Starting 22-June the market starts growing slowly, building up speed; bullish momentum grows. Then resistance will be found at a strong higher high.
The main target for this chart setup and trade is 0.0007663. With 8X leverage this target, from current price, has a profits potential beyond 3,000%. There are even higher targets on the chart.
That's why I mention 1,000% at the start. It is very easy to collect 1,000% on this pair if you are smart. Not that smart just patient and wise... Well, you can do it if you truly want. I'll see you at the top.
Opportunities are endless.
This is just one and many more will be coming your way.
Put some time and effort into your trading, your buying and selling, and watch your capital grow. Together we can win.
Thanks a lot for your continued support.
Namaste.

OFFICIAL TRUMP 1,244% Target Revealed & Map UpdateI have several questions for you:
1) Did the market break your patience? Are you still holding?
2) How much are you going to take? Will you go for 278% or maybe 1,244%?
TRUMPUSDT has been really uneventful lately and this is good, it means that consolidation is still happening and consolidation is a form of exercise for a trading pair; TRUMPUSDT is building strength.
From a technical analysis perspective, the chart is great, still bullish continues bullish; looks good. Because the action continues to happen as a higher low compared to 7-April. 7-April is the market bottom, as long as this level is not challenged or broken we are now in the bullish zone.
The move that peaked in late April is the initial bullish breakout. The higher low 22-June marks the point where the retrace from the initial bullish breakout ends. 22-June can also signal the start of the next upthrust. From here on we will see growth.
Higher lows lead to higher highs. We have a very clear, strong and ecologically sustainable higher low. This means that a higher high comes next.
Here is the tricky, not so tricky part: TRUMPUSDT will grow to $50, $62, beyond $100 and so on, but, not all growth happens in a single wave. Just as TRUMPUSDT moved from $7 to $16 and then stopped, it can move from $9 to $34 and then make another stop, this one short. Then another rise toward $50 and so on. The market never moves straight down but neither straight up. And this gets us to my point. Will you sell when resistance is hit to later buy back lower, or, will you continue waiting until the market top, higher targets?
That's the question you need to answer to maximize profits when the action goes green. If you decide you want to sell the wave, then make sure to prepare to sell when the market is green. What happens is that if you don't sell when green but wanted to take some profits then you will do so when the market is red. In this case you will not be taking out the maximum possible...
Anyway, we have to leave something for another day. TRUMPUSDT will grow, for certain, but it takes time. Patience is key.
Thank you for reading.
Namaste.

What is Needed for BTC-Altcoins Bull Market —Crypto is Going Up!Some people are under the impression that Bitcoin needs to go down for the altcoins to go up. No, no, no, no, no... This is a big mistake. Bitcoin needs to continue growing for the altcoins to explode. Let me explain.
Bitcoin has been trading very high forever now and the altcoins grow when Bitcoin is very strong. The current situation with Bitcoin is good for the altcoins but the altcoins need a major force, a strong impulse and maximum support for a bull run and this only happens when Bitcoin goes up.
If Bitcoin retraces from resistance this is bad for the altcoins. Whatever gains tend to be removed right away. If Bitcoin moves forward and hits a new all-time high, this is incredibly beneficial for the altcoins and the altcoins continue growing for the long haul.
Instead of Bitcoin going down or falling behind for the altcoins to grow, Bitcoin needs to continue strong. A stronger Bitcoin is good for the altcoins. The more Bitcoin grows, the more pressure the altcoins market feels to follow.
As long as Bitcoin trades above $100,000, the altcoins can do great. If Bitcoin falters, the altcoins suffer but this is only short-term.
Regardless of what happens in the short-term, Cryptocurrency is set to grow. We will experience the best yet since 2021. This bull market will extend beyond 2025 and it will go into 2026 and who knows, maybe even beyond.
100% certainty, you can bet your house on it; Crypto is going up.
Namaste.

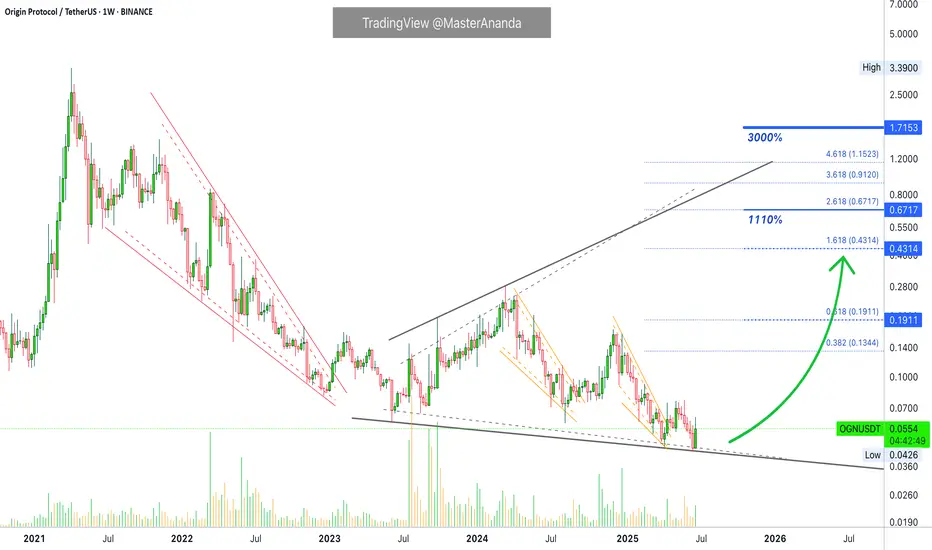
Origin Protocol 1110% Target Explained & 3000% Prev-Bull MarketOrigin Protocol has been moving within a massive broadening channel since December 2022. Now trading within its lower boundary. The upper boundary works as resistance while the lower boundary works as support. Whenever the action starts to happen close to the lower boundary this becomes a buy-opportunity, this entry can be used either for the short- or long-term. With the current market situation, the best focus is long-term. A 6 months time window.
Origin Protocol (OGNUSDT) produced a 3,000%+ bullish wave back in the 2021 bull market. We know for a fact now that this pair can produce wild gains. The price that launched this wave was 0.1068, the peak was 3.39. In comparison, the bottom in 2025 stands at 0.0426. The next peak can be anything but we have plenty of room available for growth. On the chart I have a 1,110% target and this is an easy one. This project is likely to grow 2,000% or more. Can be 3,000%. 1,110% is the safe, strong, easy target.
Thank you for reading.
Namaste.
Contentos 1550% Potential, Bitcoin & The Evolution of FinanceThe previous all-time low happened March 2020, more than five years ago. The "new all-time low" happened last week, 22-June, just a few days ago.
Contentos, we traded many times before in the past and it has been mixed but mostly a success. How are you feeling right about now? Are you ready for a new try on this Cryptocurrency trading pair?
The last bullish cycle produced a nice +1800% bullish wave, 19X. This time around something similar can happen, growth potential can be capped at 1550% or it can go higher, 2500% or more.
The chart is a standard one. A small cap. project so the action this year resulted in a new all-time low. This atl is the base from which the 2025 bull market wave will develop. Currently, we are seeing the best entry prices available before this event.
A major event truly for the market. There will be millions upon millions of participants exchanging crypto, talking crypto, living crypto, using crypto, buying crypto. It will be something not experienced before.
It will be the first bull market with the approval and even support of the US government and the recognition of all the important nations of the world. (The nations that are against Crypto are irrelevant and rooting for slavery basically. They are against growth, prosperity and freedom. It is as if the world was getting rid of slavery and some nations are against it, that's the best analogy.)
The stage is set for Cryptocurrency to take over. The evolution of finance right in your face.
We are living the most exciting financial times in the history of humanity, when money made a leap from centralized to decentralized; it is a development as big as the invention of the printing press. The world will never be the same. Prosperity will be the norm. Everybody will have access to banking; anybody can access, use and enjoy Bitcoin with as little as just a cell phone.
Namaste.

AERO, break down or the sound barrier!?If you find this information inspiring/helpful, please consider a boost and follow! Any questions or comments, please leave a comment!
AERO started by showing the kind of impulsive structure that could lead to a much larger advance. The internal retracement off the low was deep enough to flush weak hands but shallow enough to retain the broader bullish context.
The structure looks like a completed wave 2 correction: a double zigzag down into that .51-.61 pocket, finishing with an impulsive pop off the lows. That initial thrust is exactly the type of reaction you want to see if this is the early stages of a wave 3 or C advance.
What’s next? Ideally, price continues to respect the 0.615 level and we see price return back to the channel and then breaks above it with momentum, signaling the start of the next leg up. A clean swift move above .965 would help confirm that bulls are in control and we’re not dealing with an extended corrective mess.
Upside targets are layered: 1.31 is the first zone to watch—an area of prior structural reaction. Beyond that, the move has potential to extend above 1.80+ in a classic wave 5 push, provided we continue to see impulsive follow through.
Bias is bullish while price holds above .61 and continues to print higher lows. Any significant break back into that .51-.61 zone without reclaim would invalidate this setup and shift focus back to low prices.
Trade safe, trade clarity!

BITCOIN - NEW BREAKOUT !Hello Traders !
The BTC failed to break the support level (101570 - 100377).
Currently, The resistance line is broken !
So, I expect a bullish move🚀
___________________
TARGET: 110400🎯

BTCUSD – Major Decision Point at The Edge📍 By: MJTrading |||
Bitcoin has rallied sharply from ~$98K and is now testing a critical confluence zone — the top of the descending channel and a strong supply area, known as "The Edge."
EMAs are turning up, supporting bullish momentum
⏳ What’s Next?
At this stage, two scenarios emerge:
⚠️ This is a make-or-break zone:
🟩 Breakout above the channel signals trend reversal → next resistance: $111K
🟨 Rejection leads to a move back to the $103K or $100K levels
This setup offers a high-RR opportunity for both breakout traders and mean reversion players.
🧠 Trade the reaction at the edge, not the prediction.
Thanks for your attention...
Share your thoughts...
—
#BTCUSD #Bitcoin #CryptoTrading #TheEdge #BreakoutOrBounce #CryptoSetup #DescendingChannel #SmartMoney #TechnicalAnalysis #PriceAction #SwingTrade #EMA #RiskReward #MJTrading #4hChart #TrendDecision #SupplyZone

Livepeer Strong Performer: Opportunity Missed? Never Too LateLivepeer was one of the strongest performing pairs between April and May growing some 340%. I look at this one frequently but somehow in the last cycle missed it and what a costly mistake.
It tends to happen, there are so many pairs, so many good projects and so many good opportunities that it is hard to catch them all. One that performs good tends to continue to do so for the entire cycle, meaning, Livepeer can continue to advance, to move forward and grow strong. Notice the chart.
Livepeer—LTPUSDT
Here we have the downtrend and the uptrend. It seems more clear now. It seems quite certain now. This chart leaves no room for doubt. After 7-April we are in bullish territory higher highs and higher lows with bullish momentum building up it will only continue to grow.
$38 as the next main target gives a nice 460% potential for growth. Mid-term, long run there is more, more, more, are you ready for more? More in the sense that the 340% previous bullish wave, or bullish jump, was great but we were not around but this is not the end. More in the sense that this is just the beginning and I love this chart because it confirms everything that I've been sharing and everything that I will share. More and higher. The altcoins market is just getting started. Prepare for higher prices. How will you maximize profits in this bullish wave?
Thanks a lot for your continued support.
You are truly appreciated and if you are reading this now... I am wishing you tons of profits and continued success. You deserve it of course. You deserve everything you wish since the day you were born. That's just my belief.
I appreciate the fact that you do take the time to read.
If you enjoy the content follow me.
Namaste.

HIVE: When To, How To?I've been tracking HIVE for a while and now I want to show it to you, it will be a good money maker if you decide to "jump in." Let's go back to some basics signals.
HIVEUSDT Technical Analysis
In August 2024 we have the main low and subsequent higher low in November. In 2025 we have a long-term higher low, April & June and also a double-bottom. That's the classic.
The higher low points to a higher high for the new bullish wave that will develop in the coming days and weeks; the double-bottom points to the low being in and current prices being good for a trade setup with low risk vs a high potential for reward.
When to sell
I have a friend and he is a scientist, he asked, "Hey Alan, when should I sell? Should I go for 400% or 660%?" It is always the same question.
I said, "You can do whatever you want of course..." He wasn't satisfied. Imagine, the scientific mind. "Yes, but how do I know if the right target is the one where you placed 400% or the 660%?" He said. You know, the scientific mind is never satisfied unless supplied with specific answers.
"Well..." I am preparing myself to give a reply that will require no additional questions. "How you approach the targets will fully depend on your trading style, that is, your goals, your capital, your risk tolerance and how confident you feel about my analysis, the targets and the chart."
"What?" Listen, you just buy and hold and contact me after three months. You'll know what to do when prices are up... Just kidding of course.
Namaste.

Bonfida —Solana Name Service Strong 900% Target MappedI have another one for you and this one we've been looking at for some time. Bonfida —Solana Name Service (FIDAUSDT).
This is a good project, based on the chart. The December 2024 high was set at 0.4277. This is a "mandatory" target, that is, an easy hit or must hit because the market tends to challenge resistance just as it challenges support.
On the down-wave the last low was broken completely, then sideways a little bit and now comes the change of trend. On the up-wave the last resistance will be challenged and broken and this is how 900% becomes possible mid-term, it will be awesome. It is not the same reading about potential profits and predictions vs experiencing the results. Imagine how nice you will be feeling when your money grows but for this to be possible now you must buy and hold.
I expect higher prices of course and this will be confirmed soon enough, for now, the targets on the chart are more than ok. We are not greedy, to be honest, we are happy with 200%, 300%. But, knowing how strong Cryptocurrencies potential is, we aim higher but always securing profits.
Make a habit of securing profits on the way up. If you can accumulate many small wins, eventually you will reach the big ones. Start small and grow big. That's one way, or simply wait for the top. Regardless of your choice, you will be successful in this cycle; we have the right experience, we have the right guidance, we have what it takes.
I am happy to have your support. Thank you for reading again.
Namaste.

Penguins Can’t Fly, But This Chart Might If you find this information inspiring/helpful, please consider a boost and follow! Any questions or comments, please leave a comment!
The move off the low looks like a clean, completed impulse wave sharp, decisive, and showing solid structure. After that, we had a double ZZ retracement. While it was a bit deeper than the textbook ideal, it still fits perfectly within the normal range you’d expect for a healthy correction. Now, we’re seeing another smaller-degree impulse forming from the .007 pivot, suggesting that the market is gaining momentum again.
Here’s what we’re watching closely:
The secondary impulse off .007 continues to build structure.
We want to see a pullback after impulse completion that ideally holds above the .011 region, showing the market respects previous support and AOIs.
The structure of this potential pullback needs to be corrective rather than impulsive to confirm bullish continuation.
A clean move above prior swing highs would confirm that the larger wave 3 or C is underway.
Overall, this chart is ticking the boxes for a potential larger upside push if the market respects key levels and continues to print impulsive structure higher.
Trade Safe!
Trade Clarity!

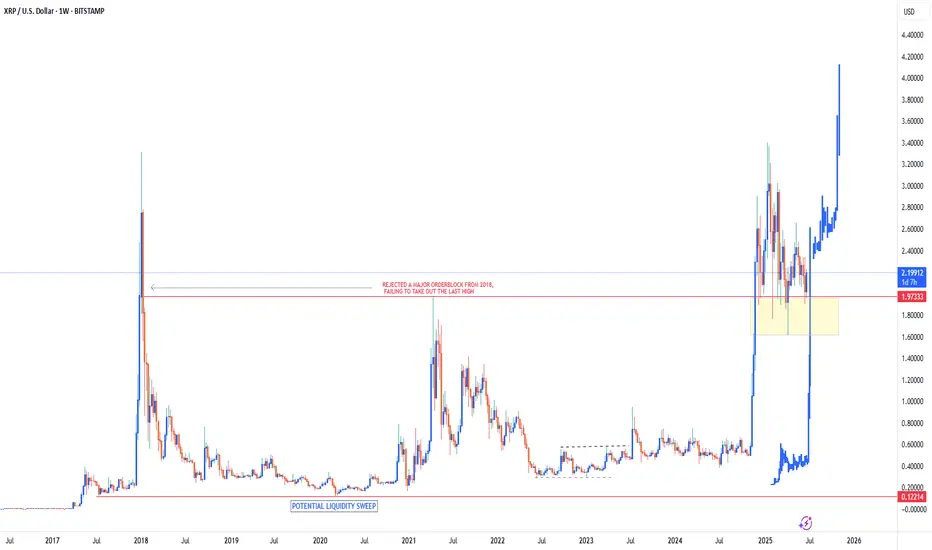
XRP Bullish to ATH of $4.10Since breaking out of its 6 year price range of $0.12 - $1.97 in November 2024, Ripple has remained within a bullish territory, sitting just above its support zone of $1.60 - $1.97.
As long as price can remain above this support zone I do believe that Ripple has much more upside to come in the next few YEARS. This definitely won’t be a fast move as there’s still a lot of legal situations involving XRP which is keeping price limited to the upside. But, as these legal battles come to an end & they will, it will slowly give XRP room to move to the upside.
I definitely see $4.1 as an achievable target for Ripple as the first target in the future. Once this price is reached, market structure & price action will give us a better indication of whether or not we can see high prices above the $4.1 target.
For now just be patient & let XRP play out in accordance with its external macro factors.
Wormhole Token Recovers From Bottom & Activates 2,400% PotentialTrue bottom and true recovery. We have a great situation here, this is a pair that has more than 2,400% potential for growth. The chart looks great right now, the signals are strong and confirmed.
Good afternoon my fellow Cryptocurrency trader, I hope you are having a nice Saturday. Let's consider this chart, a great opportunity for sure.
Wormhole Token (WUSDT) entered bottom zone 11-March, so already 111 days trading at bottom prices. The best time to buy.
After this initial low in March we have huge volume after a few days, and just two days ago another strong buyers day with a followup composed of two bullish signals. The DragonFly Doji yesterday and the full green candle today.
These are all strong bullish signals fully confirmed, which means higher prices next. I am showing only the daily chart but the potential for growth is extraordinary when focused on the long-term. This publication is time-based.
Right now we have great entry timing and prices...
The time is right, the time is ripe.
Another great altcoin for those looking to profit massively from the 2025 bull market.
Thank you for reading.
Namaste.

#QNTUSDT #4h (Bitget Futures) Bull flag near breakoutQuant regained 50MA support after breaking out of the falling wedge, bullish continuation seems likely.
⚡️⚡️ #QNT/USDT ⚡️⚡️
Exchanges: Bitget Futures
Signal Type: Regular (Long)
Leverage: Isolated (6.0X)
Amount: 4.6%
Current Price:
100.30
Entry Zone:
99.22 - 96.92
Take-Profit Targets:
1) 106.59
2) 112.99
3) 120.11
Stop Targets:
1) 90.95
Published By: @Zblaba
GETTEX:QNT BITGET:QNTUSDT.P #4h #Quant #RWA quant.network
Risk/Reward= 1:1.2 | 1:2.1 | 1:3.1
Expected Profit= +52.1% | +91.3% | +134.8%
Possible Loss= -43.6%
Estimated Gaintime= 1-2 weeks

BRIEFING Week #26 : Are we going for a Bubble ?Here's your weekly update ! Brought to you each weekend with years of track-record history..
Don't forget to hit the like/follow button if you feel like this post deserves it ;)
That's the best way to support me and help pushing this content to other users.
Kindly,
Phil

BTC - Will the Bears finally get their chance?Buy Side Liquidity Sweep in Progress
Price is currently climbing toward a region densely packed with resting buy side liquidity, marked by multiple previous highs. The area around 108,900 to 111,000 is especially significant, with two clear liquidity pools stacked above recent swing highs. These levels are likely to attract price as market participants seek to trigger stop orders and induce fresh buying interest—setting the stage for a potential reversal.
Weakness in the Current Impulse
The recent rally has advanced with minimal retracement and virtually no visible Gaps. This lack of corrective structure often indicates imbalance and suggests the move is overextended. When price moves upward too cleanly, it tends to leave behind thin liquidity zones, making the entire leg vulnerable to a sharper correction once exhaustion sets in.
Fair Value Gap as a Draw Below
Below current price lies a prominent bullish Fair Value Gap around 104,000. This inefficiency was left unfilled during the last leg up and may now serve as a magnet for price. These types of Gaps are often revisited by the market in an effort to rebalance supply and demand, especially after aggressive moves that break structure to the upside.
Once the higher liquidity levels are swept, watch for a clear reaction—either a strong rejection or lower timeframe structure shift—which could signal that the top is in. If that shift materializes, price may begin a downward leg targeting the unfilled Gap below. The magnitude of the move, combined with the lack of structure on the way up, leaves plenty of room for corrective action.
For those looking to engage, waiting for confirmation on a lower timeframe—such as a break of short-term bullish structure or the formation of a bearish Gap—can help time entries more precisely. In setups like these, patience is key: let the Sweep play out, observe how price reacts, and only then consider stepping in.

Litecoin ETFs Target $199 Followed by $283 Followed by...It will definitely go higher but, let's do it step by step. Litecoin is setting itself to move up with targets being first $199 and then $283, these are the main targets for this bullish jump.
It will go higher of course but the market tends to fluctuate, never straight down but also never straight up. It advances nicely and then stops, a stop that you sense can last only a few days can result in a correction lasting more than an entire month. When you see this happening, you question yourself, "Why didn't I sell when prices were up?"
And the same pattern repeats; over and over, again and again. Now, Litecoin will produce a new bullish wave. The retrace can last 3 weeks rather than 6 weeks. It can last 12 weeks rather than 6 weeks, I don't know. So, instead of being 100% right or 100% wrong, we can sell portions at each target and just be happy/grateful with the results. Or, we can plan ahead... Focus on maximizing profits because Litecoin is ready to grow, the continuation of the bullish move; the next "leg-up."
» Litecoin Exchange-Traded Fund (LTC ETF).
Do you think this is bullish? Think about Bitcoin's ETFs results. It can be mixed at first, volatility, but the end is always bullish. Strongly bullish. Hyper-bullish. Litecoin is very small compared to Bitcoin. It can be a major boom!
Thanks a lot for your support.
Namaste.
