Shentu Back To Baseline, 200% Minimum, Fast!We have a very good chart setup here but I will focus on one target only and the short-term, "back to baseline."
Shentu is about to make a strong jump. One of those that can leave us with our mouths wide open. Similar to 30-April but without the rejection and lower low.
This time, the jump will result in long-term growth. Of course, there can be some daily growth first before this jump. The 200% profits potential target is the minimum, there is huge potential for growth, CTKuSDT, long-term. As well as mid-term. And I am telling you now about the short-term, so everything is pointing up.
The main low happened in April. The recent lower low is a form of consolidation with a bearish bent. This type of consolidation can produce higher lows or lower low but the end result doesn't change, which is a strong rise with a higher high compared to the last high.
This is one is good and already on the move. Four days green, but this is only the start.
Thank you for reading and good profits. It will be great.
Namaste.
Crypto

Cardano, The Support Line —Crypto For The FutureHere we have Cardano long-term. I am keeping it simple because simple is best.
We have this "support line." Notice that a descending wave ends on a flat support. Each time this pattern showed up, decreasing prices with a stable base, what followed was a strong inverse reaction. Prices were going down but the reaction was a strong jump. Notice how each time the bullish jump becomes bigger.
» The first support line and descending triangle happened in 2023. This led to a small bullish wave, not a fast one but a good one.
» The second descending triangle and support line happened in 2024 and this one led to a strong bullish jump supported by high volume. Here the candles start to become bigger.
» The third and final support line is the current one, 2025. This one is expected to produce such a strong reaction that a new all-time high is expected and beyond.
Now, the action will be wild and strong but it won't happen in a single day, week or month, it will take months, many months. The bullish wave can develop in 4 months as it can take 6 months or even more. And this even more is very important because this is something not seen before. A "White Swan" event. The bullish cycle can develop for 12 months or even more because the preparation has been so prolonged and because fundamental market conditions have been improving for years, with a major boost the past 6 months. Conditions are so much better now compared to just a few years ago, that it is even hard to understand. It is like the world is shifting, changing and adapting to our vision. We saw Crypto, we voted for Crypto with our energy, attention and money, and the world is now catching up.
If all this "improvement" in acceptance and adoption has already happened within just 6 months, what do you think will happen in four full years? By the time this cycle is over, we will be living in a different world.
If you are in this market now, Oh boy! you are blessed; you are wise, you made the right choice.
If you are a developer, a reporter, a coder, designer, web manager, project owner, entrepreneur, promoter, innovator and the like, you are damn smart and you will be reward for the risk you took.
If you are on the other side of the spectrum, the artist, the dancer, the writer, the composer, the teacher, the athlete, the body builder, yoga instructor, waiter, the server, the clerk; the lawyer, the accountant, the advisor, and decided to put your hard earned money in Crypto, you decided to join... God bless you, you will be rewarded for the risk you took.
Patience is key, we are very close.
If you decided to trust my clean-sharp-straight words, Thank you!
You are appreciated greatly for your continued support.
If you are a human being, we love you... Crypto was made for all of us.
Don't worry about Cardano, it is going up.
Namaste.

SPX is overheated, a correction is necessary📉 Market Update: No, It Has Nothing to Do with Trump
This move has nothing to do with Trump’s dramatic announcements. The reality is simple: the MACD on the daily chart is overheated, and a healthy correction is needed — likely down to the 5,520 level — before resuming the uptrend.
Now, does it surprise anyone that Trump acts like a PR agent for his investors? He always seems to drop “bad news” at the exact moment the charts call for a pullback. My guess? They're shorting right now.
🪙 Bitcoin Stalling
CRYPTOCAP:BTC is also losing momentum, and looks like it’s in need of a short-term correction as well. This suggests a week of consolidation ahead for the whole crypto market.
But let’s be clear:
🚀 The Bull Market Is Not Over
The weekly charts remain very bullish, and this trend could last another 4–6 months. The macro bullish structure for crypto remains intact.
However, in TradFi, there are cracks:
🔻 20-year bonds sold at 5.1% — a major recession red flag
💸 Tariffs are putting pressure on global trade
📉 The entire traditional market is starting to de-risk
🔮 What to Expect
Short-term correction to ~5,518 (first bottom target)
A possible rebound after healthy consolidation
A continued uptrend in crypto unless key support breaks
I’ll publish a new update when conditions change.
📌 Follow me to stay ahead of the market. And as always: DYOR.
#CryptoMarket #Bitcoin #MACD #TechnicalAnalysis #CryptoCorrection #BullishTrend #RecessionWarning #TradFi #Altcoins #BTC #MarketUpdate #TrumpEffect #DYOR

#AXSUSDT #4h (Bitget Futures) Falling wedge breakout and retestAxie Infinity just pulled back to 50MA support where it's bouncing, looks ready for recovery towards 200MA resistance and more.
⚡️⚡️ #AXS/USDT ⚡️⚡️
Exchanges: Bitget Futures
Signal Type: Regular (Long)
Leverage: Isolated (4.0X)
Amount: 4.7%
Current Price:
2.509
Entry Zone:
2.489 - 2.407
Take-Profit Targets:
1) 2.758
2) 2.991
3) 3.224
Stop Targets:
1) 2.189
Published By: @Zblaba
NYSE:AXS BITGET:AXSUSDT.P #4h #AxieInfinity #P2E axieinfinity.com
Risk/Reward= 1:1.2 | 1:2.1 | 1:3.0
Expected Profit= +50.7% | +88.7% | +126.8%
Possible Loss= -42.3%
Estimated Gaintime= 1-2 weeks

MyShell Signals: Bottom Confirmed Rise ConfirmedWhat you see here is a big, classic, Adam & Eve bottom pattern.
First the rounded bottom followed by the pointed-bottom. And this reveals the market will change its trend coming from a classic signal.
What you see on this chart is a perfect falling wedge pattern (orange). This reveals an upcoming bullish breakout, the breakout leading to a new uptrend.
Then you can see a perfect higher low (purple trendline). Coupled with a reversal candle and continuation with a full green candle after the higher low, 22-June, is in. A strong combination of bullish signals but I can show you more.
The full green candle 23-June pushed SHELLUSDT daily above EMA8 and EMA13.
There was high volume 9-June. The highest volume day in months.
There is also a resistance baseline that was conquered around 0.1380. All bullish but still early. SHELLUSDT is still trading at bottom prices compared to what you will be seeing in a matter of months.
The RSI is trending up. Notice the same falling wedge pattern...
The MACD produced a bullish cross after a major higher low. This is all ultra, hyper bullish of course.
When so many bullish signals are combined together, it simply leaves no room for doubt; Crypto is going up.
MyShell is trading at bottom prices with many confirmed signals, soon to grow.
Thank you for reading.
Namaste.

BTC Consolidates Above Pivot – Bullish Momentum Toward 113,770?BITCOIN OVERVIEW
Crypto Breakout or Crash? Powell's July Message Becomes the Deciding Factor
Federal Reserve Chair Jerome Powell’s testimony on Capitol Hill has intensified the uncertainty surrounding risk assets.
He emphasized that while inflation has eased significantly since mid-2022, it remains “somewhat elevated”, and the Fed is in no rush to shift its policy stance.
This leaves markets with a binary outcome: crypto breakout or macro-driven pullback—and July may be the turning point.
TECHNICAL OUTLOOK – BTC/USD
Bitcoin remains in bullish momentum, having stabilized above the pivot level at 107,750.
The price is currently pushing toward the key resistance zone between 108,950 and 110,360.
A breakout above this zone would likely lead to continuation toward the next ATH target at 113,770.
However, consolidation is expected between 108,950 and 106,320 until a breakout occurs.
Key Levels
Pivot Line: 107,750
Resistance: 108,950 → 110,360 → 113,770
Support: 106,320 → 104,150

USDT - Hope AheadMorning my friends,
Figured I'd share a little bit of this USDT chart.
Deff showing a downtrend, even though our beloved coins are still suffering. Thats mainly because of BTC.D.
Once USDT moves lower, signaling a breakdown we should get a big relief, that if maybe paired with BTC.D moving lower as it is also near very strong resistance a bull market for alts will begin.
Keep an eye on this descending triangle breakdown.
Trade thirsty, my friends!

Bitcoin Update 25.06.2025 —Altcoins, Top Altcoins Choice & MoreGood morning my fellow Cryptocurrency trader, I hope you are having a nice week and a wonderful day.
We have good news to start today and it is all based on Bitcoin's price action. This is going a bit deep on the daily noise, price swings.
Price action analysis
Bitcoin went deep on its sideways range and tested below 100K. This is normal for a sideways market. The positive news comes from the fact that Bitcoin is once more trading above $106,000 and already hit above $107,000. This type of action reveals a bullish bias.
If the market was mainly bearish with a major drop on the deck, say going below 90K or 80K even, then Bitcoin would not be allowed to go beyond $105,000. In fact, any bounce or small recovery would be quickly sold as bear would be active, waiting and selling each time prices move up.
The fact that Bitcoin can grow day after day and consume all selling pressure while doing so, reveals a strong presence from buyers. We know this to be true because Bitcoin is now in a new phase in its evolution and growth cycle. It is truly a young technology that only now is being fully accepted with plenty of room available for growth.
We have three instances where Bitcoin moved above 110K. The selling that happened afterward is not filled with pressure, instead you can see some standard candles as prices continue to consolidate.
On the other hand, notice the last session from 21-June (21-24 June —3D candles). You can see a long lower shadow, a bullish hammer; there was definitely strong buying pressure as soon as Bitcoin reached below support.
Altcoins market action
Some altcoins continue to produce multi-months high. The highest price since January 2025. These altcoins recovered, started to rise and continue rising in clear, standard bull market fashion. Literally straight up.
Some altcoins did even better and grew as high as December or November 2021. The highest price in almost four years. This is very important when we go deep into the chart and price action because it is the main revealing signal. The altcoins simply do not go on a major bull market before a market crash. If the altcoins are recovering or rallying, it is because the market is set to "buy." The Cryptocurrency market is in bullish mode.
If the market was set to drop long-term then we would be experiencing a rise that is running out of momentum. This rise would later peak and a surprise sudden flash crash would signal the start of a major downturn. This is not what we see.
Inversely, if prices are going to rise strongly we start by seeing some form of retrace or correction, this event losing momentum and volume and then finally a strong bullish jump as soon as support is confirmed. This bullish jump would signal the start of a major market move. This is what we are experiencing today.
Bitcoin & Altcoins
Bitcoin and the altcoins move together. Bitcoin leads the altcoins, the altcoins reveal what Bitcoin will do when the action is sideways.
We can always say that Bitcoin is leading the altcoins of course because Bitcoin has been growing non-stop since November 2022. The major trend being bullish the altcoins are set to follow at some point.
Now, when Bitcoin goes sideways, by definition, anything goes. The market can break-down just as it can break-up. This is where the altcoins become useful.
If smaller Cryptocurrency projects are moving ahead, strongly and even producing 3-4 multi-year highs, it reveals what Bitcoin will do once its consolidation period ends.
Buying Bitcoin
In short, Bitcoin is going up. The next major market move is a rise and we have proof coming from the signals, the altcoins and the charts.
Never again in its history Bitcoin will trade below 80K. 90K soon to be gone... Once the action starts, you will look like a genius for buying below $110,000.
What to choose: Bitcoin or altcoins?
Now, my personal suggestion is different. If you are not a whale, the way to go are the altcoins. Why? Because there is more room for these to grow. We can say that the altcoins are riskier, but risk is almost non-existent with spot. We can simply focus on the pairs that have been filtered by the major exchanges. Reputable pairs with a long track record and plenty of room available for growth. You can't go wrong with those.
If you are ready for the 2025 bull market, leave a comment below.
Altcoins analysis by request
I think it is time for a new Your Top Altcoins Choice, session. It is always wise to do these when the market hits bottom or before a major bullish wave, that's exactly where we are now. If you agree and would like to see a new session, leave a comment saying "Yes! Top Altcoins Choice." If there is enough interest we can work together and find many hidden gems. It can be done with your support.
Namaste.

Bullish momentum, breakout & risk road-map – All-frames review__________________________________________________________________________________ Technical Overview – Summary Points
__________________________________________________________________________________
Momentum : Strong bullish bias confirmed from daily down to 30min by the Risk On / Risk Off Indicator (“STRONG BUY” signal prevailing).
Major supports : 102626–103303 USDT (1D/4H/2H pivots), key multi-touch rebound area.
Strategic resistances : 106031–106480 USDT (4H, 2H, daily, weekly pivots), tested zone, potential upside extension to 109950–112000 USDT if breakout confirmed.
Volume : Normal to moderately high flows, no extreme spikes, trend remains healthy.
Multi-timeframe behavior : Overall Up structure on D/12H/6H, micro-divergence “Down” on 2H/4H only; ISPD DIV neutral everywhere, no sign of euphoria/capitulation.
__________________________________________________________________________________
Strategic Summary
__________________________________________________________________________________
Directional bias : Active bullish, favoring buy on clean 103300–102600 USDT pullback or daily breakout >106500 USDT on volume.
Main opportunities : Swing buying on deep support (stop <99500 USDT, risk <1.5%) or daily breakout toward 109950–111700 USDT.
Risk zones : Below 102600 USDT daily closes, bullish bias invalidated, risk of quick flush. Watch persistent “Down” on 2H/4H even if breakout occurs.
Macro catalysts : Fed (25/06), Powell testimony, Iran/Israel/US ceasefire; volatility expected, active exposure management pre/post-news.
Action plan : Monitor volume and timeframe alignment for momentum confirmation. Use dynamic stops, active management around Fed events.
__________________________________________________________________________________
Multi-Timeframe Analysis
__________________________________________________________________________________
1D–12H–6H : General Up structure, supports held, Risk On / Risk Off Indicator momentum very strong. ISPD neutral, controlled volumes.
4H–2H : Isolated “Down” divergences caution intraday aggressive buying. Higher volume on rebounds, no excess or exhaustion.
1H–30min–15min : All Up, strong rally on resistance test, healthy volumes.
General summary : Support/resistance confluences, strong momentum down to intraday, low risk of capitulation. Cross-timeframe confirmation needed for extension.
__________________________________________________________________________________
Actionable Synthesis
__________________________________________________________________________________
Preferred scenario : Favor buying on major pullback (103300–102600 USDT, stop <99500 USDT) OR confirmed daily breakout (>106500 USDT) if 2H/4H support returns bullish.
Risk management : S/L -1.5% to -3%, TP 109950 then 111700+ USDT. Increase vigilance around Fed (25/06), dynamic stops, active management.
Invalidation zones : Daily close below 102600 USDT = bullish bias invalid, potential flush alert.
Macro / On-chain : High off-chain speculation (record open interest), low on-chain flows. Leverage high, squeeze risk present. No signs of euphoria/exhaustion.
Conclusion : Constructive technical context, dip buying remains valid. Lighten up under resistance, prudent leverage management.

OLUSDT Ready to Explode? Don’t Miss This SetupYello Paradisers, is this the calm before the storm? #OLUSDT has just bounced off a key support zone and is now grinding right under a critical resistance. If you’ve been following our recent plays, you know exactly how this pattern can end with an explosive move that catches the herd completely off guard. This chart setup demands attention right now.
💎What we’re seeing is a textbook descending broadening wedge formation, which historically leads to powerful breakouts when the price breaks through the upper trendline with volume. #OLUSDT has respected this wedge perfectly, with two touches on both the resistance and support lines, confirming its technical strength. At the time of writing, the price is testing this resistance again, and any sustained breakout above it could flip the current structure bullish and trigger a rally.
💎The recent bounce came directly from a strong support zone between $0.028 and $0.030, an area that has consistently absorbed selling pressure. This level is now acting as the foundation for a potential trend reversal. As long as the price remains above this zone, bulls remain in control of the narrative. However, a daily close below $0.028 would invalidate the current bullish setup, signaling that bears may still have fuel left to drive the price lower, potentially targeting the $0.024 region.
💎On the upside, if the resistance gives way, we’re watching three major reaction zones: the first is minor resistance at $0.037, then moderate resistance around $0.043, and finally, the strong resistance zone at $0.046 to $0.050, which would represent a full breakout completion and a 50% move from current levels. These levels are not just random numbers; they represent areas of high liquidity and previous heavy sell interest, so they must be approached with caution and strategy.
Stay ready. Stay focused. And always play the long-term game like a pro.
MyCryptoParadise
iFeel the success🌴

SUI Wave 2 Complete?CRYPTOCAP:SUI appears to have completed a wave 2 pullback at the 'alt-coin' golden pocket Fibonacci retracement 0.786.
Price tested the S2 daily pivot as support, which adds confluence to the .786 Fib. A bullish engulfing candle followed, negating the previous 3 days price action but price still has to overcome resistance.
A sustained breakout above the descending orange trend line and major resistance will be a queue to go long.
Analysis is invalidated below $2.28.
Safe trading

FET Wave 2 Complete?NYSE:FET (Fetch.ai) appears to have completed a wave 2 pullback and looks set for the next move up towards $1.1
Price swung below the bottom of the wedge, tested the S1 daily pivot and 61.8 Fibonacci golden pocket. It quickly recovered with a bullish engulfing daily candle negating the 3 previous days bearish price action.
A close above the top wedge line and daily pivot will be the signal to go long again.
Analysis is invalidated below $0.54 and that will bring up a downside target of $0.34 which is the ascending macro support from June 2023.
Safe trading

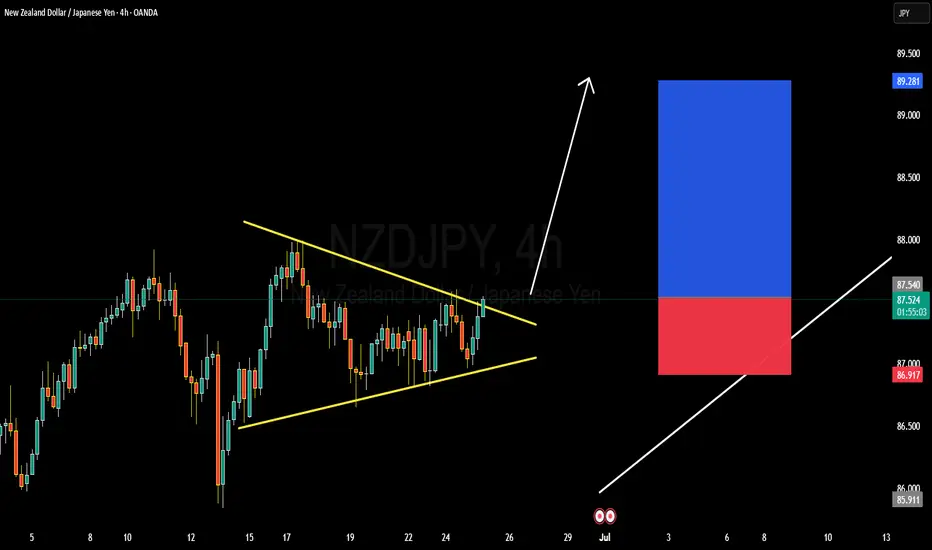
NZDJPY TECHNICAL AND FUNDAMENTALS DETAILED ANALYSISNZDJPY has just completed a bullish breakout from a well-defined symmetrical triangle on the 4H chart, confirming the start of a fresh impulsive move. Price action has broken cleanly above the descending trendline resistance around 87.400, supported by consecutive bullish candles with momentum. This breakout structure is signaling trend continuation, and I’m now targeting 89.500 as the next key resistance zone. The pair has also held higher lows consistently, showing strong bullish pressure in the medium term.
Fundamentally, the New Zealand Dollar remains supported by the Reserve Bank of New Zealand’s persistent hawkish stance. With the RBNZ maintaining higher interest rates to combat sticky domestic inflation, NZD has found strong backing in recent sessions. On the other hand, the Japanese Yen continues to weaken across the board, with the Bank of Japan maintaining ultra-loose monetary policy and no real signals of tightening. Japan’s latest inflation reading came in weaker than expected, further dimming any hawkish BOJ bets.
Today’s sentiment also reflects a global risk-on environment, with equities up and commodity-linked currencies like NZD benefiting. This reinforces bullish momentum in NZDJPY, especially as yield differentials between New Zealand and Japan favor carry trades. Technically, the pair could see brief pullbacks toward 87.100–86.900, which may offer fresh entries for bulls aiming to ride the breakout wave toward 89.500.
With technical confirmation, bullish momentum, and a supportive macro backdrop, NZDJPY looks well-positioned for further upside. I’ll be watching for sustained price action above the breakout zone, and any dips will be viewed as buying opportunities. The trend is up, and momentum is real—this is a textbook breakout setup aligned with both fundamentals and price action.
BTCUSD : HUGE FALL AHEAD ? Sell at 106200 or below
Stoplos : 113000
Target : 100000, 90000
BTCUSD struggling hard to make new highs. Retest of 90k level expected.

GRIFFAIN BEARISH SETUPGRIFFAIN/USDT (1H Chart) – Distribution Phase Signals Short-Term Bearish Reversal
The 1-hour chart of GRIFFAIN/USDT on Binance displays a distribution pattern at the recent high, suggesting bullish exhaustion and an imminent correction. Price has now broken below the consolidation range, confirming a shift in intraday sentiment.
🔍 Key Technical Insights:
Distribution Zone Formed: Price stalled at the top with several failed attempts to push higher, forming a range – a classic sign of distribution before reversal.
Bearish Breakdown: The bearish candle has breached support, initiating a potential downward move toward the 0.5 Fibonacci retracement level.
Key Level to Watch:
Next Target: $0.0400 (50% Fib level + historical demand zone)
Further Support: $0.0360 (Fib 0.786 region)
📉 Outlook & Expectations:
Short-term bias remains bearish below the $0.0458 zone. As long as price stays below the distribution range, expect continuation toward the $0.0400 support area, aligning with key structural and Fibonacci levels.
This setup is ideal for intraday or short-term swing traders watching for pullback entries or breakdown continuation.

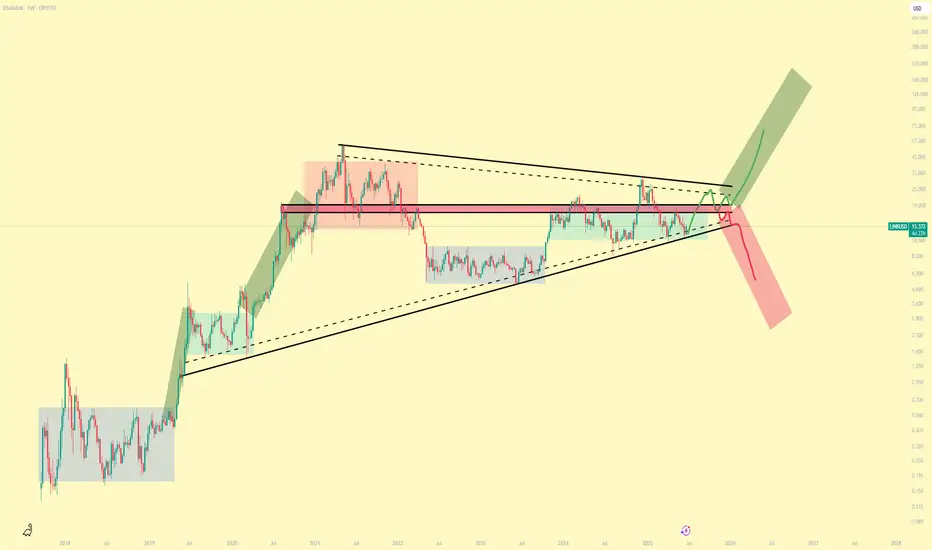
LINKUSD Paths on OfferPretty clear accumulation stages going on and so I am inclined to think we head towards the Bullish path to ~$100
Bears will want to buy LINK at massive discounts and so perhaps we do see some capitulation before our next mark-up phase.
However, the current Total Market cycle patterns, along with the BTC pairing, almost rule out the possibility of further downside, or at least major downside.
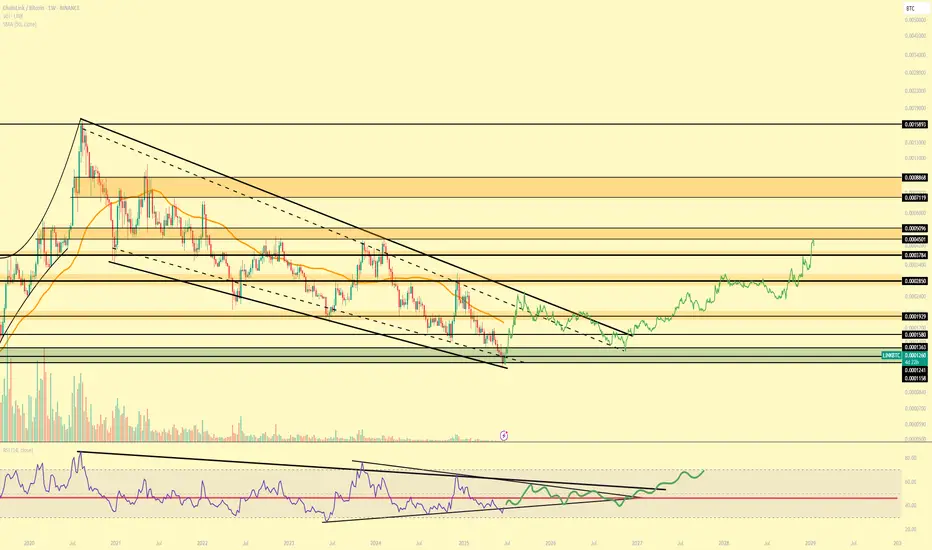
LINK / BTC Looking Juicer Than EverEven if you aren't aware of the fundamentals of LINK adoption & application , the chart speaks for itself.
Would be very surprised is LINK isn't bottoming out here and all it needs is a bit of sideways before we get some expansion and mark-up.
Harvest Finance 1,490% Profits Potential & The 2025 Bull MarketThis is a yield aggregator, DeFi. And if there is something people love about the Cryptocurrency market is decentralized finance.
Harvest Finance —FARMUSDT
The danger zone is also the opportunity zone. An opportunity that is not available anymore. This is a price range between the November 2022 and June 2023 lows.
FARM found support in April and May 2025 at the exact same level from November 2022, on a wick. In June, last week, it wicked below this level (orange line on the chart) just to quickly recover. This week FARMUSDT is full green.
While the opportunity zone is likely gone forever, there is still some time to buy while prices are low. This pair has great potential for growth and I can see the development of a new bullish impulse in the coming days.
Entry level
Anything below $30 should be consider a strong buy opportunity when considering the long-term.
Growth potential
Growth potential is truly unlimited and it is hard to make accurate predictions here because this pair started trading in August 2021. It was near the end of the previous bull market. So we don't know if the top is a valid number or it simply crashed because the bull market force had already run its course.
Some conservative targets yet strong can be seen on the chart.
$299 and $430 are looking good, I would say high probability.
The $193 target I would say is the minimum within the next 3-6 months. This one would produce a total of 615% profits potential. So this is a good pair.
The $430 target, just to give you an idea, gives more than 1,490%.
Some pairs show maximum growth potential reaching 500-600%. Some other pairs can go as high as 8,000-9,000%. It really depends on the size of the project, the popularity, past action and how many exchanges carry it for trading. I do all my projections based on the chart and past action.
One thing to keep in mind is that the market tends to surprise, very important. The bull market is very likely to end up breaking all the targets that we extracted so far. It is a common situation, it always tend to go much higher and for much longer than anything we can imagine; great.
Thank you for reading.
Namaste.

Stacks Short- Mid- & Long-Term Bullish Signals (PP: 900%+)Stacks is a very interesting project and I believe it has many fans. Here the signals are really good and by good I mean strong.
This pair, STXUSDT, has been a top performer but the action bearish since March 2024.
Between March 2024 and April 2025 we have a classic ABC correction, a long-term one. Needless to say, this type of correction is always followed by an impulse, a bullish impulse and this is a sequence of 1,2,3,4,5 waves. Three waves up and two waves down in-between.
The August 2023 low produces a rounded bottom and then a new wave of growth. This low is preceded by another bullish wave. This pair has been growing long-term.
Then a new rounded bottom shows up but this one a long-term higher low compared to August 2023. That is April and June 2025. So mixed bullish signal. Short-term, mid-term and long-term all being combined to give us a bullish mix. Ultra-bullish in short.
The last all-time high happened around $3.84, so the next one can happen around $7.11 or $9.65. The $7.11 projection gives more than 900% profits potential.
Oh, and this week is young and already full green. The candle's real body trades above the two previous weeks open and close.
Thank you for reading.
Your support is appreciated.
Namaste.

Pepe Prepares To Grow After 5 Weeks Red (5X Possible)I am sorry, the system is not working and won't let me write more than a few lines. This is the best I managed to publish without getting an error.
You can get the idea by looking at the chart and drawings. It points to higher prices in the coming weeks and months. Namaste.

Circle Collapse - Will COIN follow? Circle stock has been on a wild ride lately
After a meteoric rise of over 700% since its IPO on June 5, it's now facing some turbulence:
- Today, the stock dropped nearly 16%, partly due to Cathie Wood’s ARK Invest selling $110 million worth of shares.
- Analysts are also sounding caution. Compass Point initiated coverage with a $205 price target—below its current trading price—citing rising competition in the stable coin space.
- Despite the dip, some still see long-term potential. A recent Forbes analysis explored whether Circle could hit $500 per share, driven by growth in USDC reserves and infrastructure revenue.

Do you want to have glory? Do want to see Valhalla?#HODL
These next few years will could change your life.
#ETHEREUM is cheap right now.
#ETH still can do tens of X's

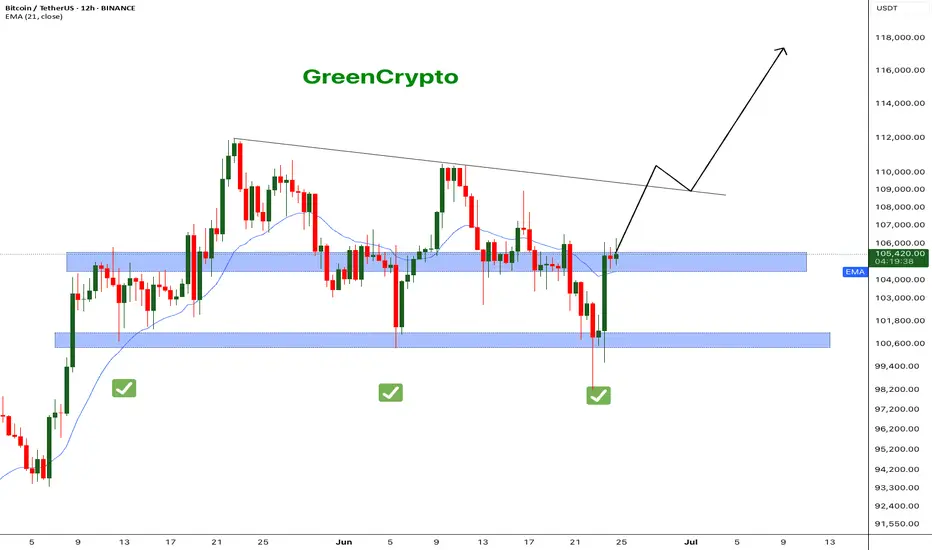
Bitcoin - What's next ? BINANCE:BTCUSDT (12H CHART) Technical Analysis Update
Now that ceasefire is announced, bitcoin price has successfully recovered to the resistance level and currently trading at the resistance zone. It's critical that bitcoin breaks this resistance for it to hit the next resistance around 110K .
I'm expecting price to reach 110k this week and we can see some consolidation in that range before moving further up.
Follow our TradingView account for more technical analysis updates. | Like, share, and comment your thoughts.
Cheers
GreenCrypto