BTC - Bulls vs Bears: who will win?Market Context
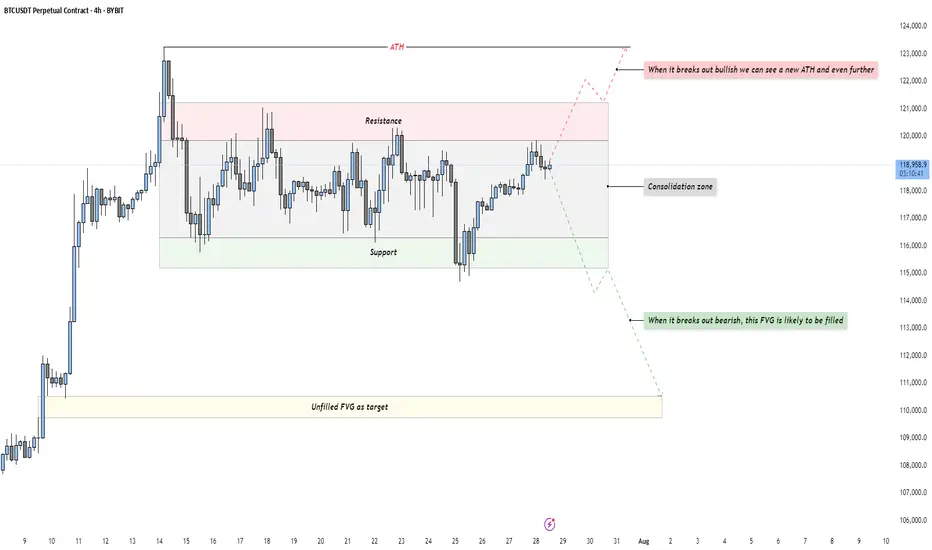
Bitcoin is trading in a tight consolidation just below its all-time high after a strong impulsive rally. This phase represents a balance of power between buyers and sellers, with neither side able to take control yet. Such a pause in momentum at this key level often builds pressure for a breakout move as liquidity pools accumulate above and below the range.
Consolidation Phase
The current range is clearly defined by a resistance area at the top and a support area at the bottom. Price has been oscillating within these boundaries without any sustained breakout attempts. This range-bound behavior is an essential part of the market cycle, as it allows larger players to build or distribute positions. The longer price stays in this box, the more significant the breakout that follows tends to be.
Bullish Breakout Scenario
If price breaks out decisively above resistance, it would indicate buyers have absorbed all the supply at these levels. Such a breakout opens the path to a new all-time high and could potentially extend far beyond as trapped shorts are forced to cover. For traders, a retest of the breakout level on lower timeframes could provide a low-risk entry point for continuation to the upside.
Bearish Breakout Scenario
On the flip side, if support fails, the market will likely gravitate toward the unfilled Fair Value Gap left behind during the previous rally. This inefficiency becomes a natural draw for price, offering a logical downside target for a corrective move. A clean break below the range followed by a retest from underneath could present shorting opportunities for those aiming to capture that move into the FVG.
Final Words
Patience and precision are key when dealing with setups like this. Let the market come to your level — and react with intent.
If you found this breakdown helpful, a like is much appreciated! Let me know in the comments what you think or if you’re watching the same zones.
Crypto
Bitcoin Passes Stress TestOn July 25, 2025, Galaxy Digital executed one of the largest Bitcoin sales ever recorded: 80,000 BTC, valued at approximately $9 billion , on behalf of a Satoshi-era investor.
Despite the size, the market absorbed the flow with minimal volatility—Bitcoin dipped from around $119,000 to $115,000, then rebounded above $119,000.
Liquidity Maturity in Motion
Analysts called the trade a significant demonstration of market maturity, noting that 80,000 BTC was absorbed in days with barely a market blip.
Crypto infrastructure has also evolved: algorithmic liquidity providers, institutional desks, and OTC channels handled the load without triggering cascading funding rate hikes or forced liquidations.
Ongoing Risks
Event-Driven Stress: During macro shocks or sharp sell-offs, liquidity may thin, and the same level of absorption might not persist.
OTC vs Exchange: This large sale was managed mostly off-exchange. A similar-sized on-exchange dump could still trigger stop-run cascades.
Retail Complacency Risk: The stability seen now can be deceptive, as retail may misinterpret low volatility as a safe leverage zone, only to be caught off-guard.
Projections:
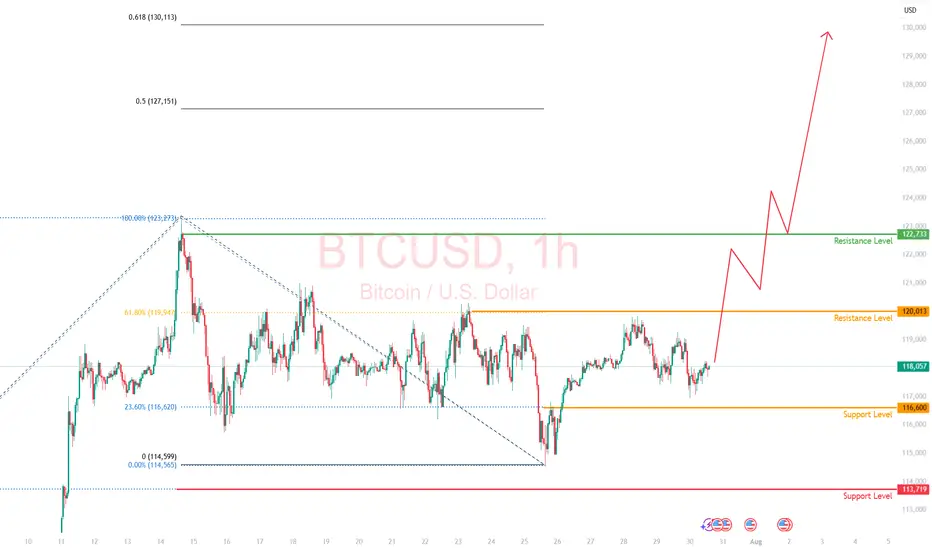
Watching the 23.6% fib retracement level in line with the $116,600 price level. Anticipate the resistance level of $120,000 to be retested.
If price breaks above $120,000, we could see a significant move toward $130,000
The $9B BTC sale went through without materially impacting price is considered a milestone in crypto market evolution. It reflects institutional-grade liquidity and sentiment maturity.
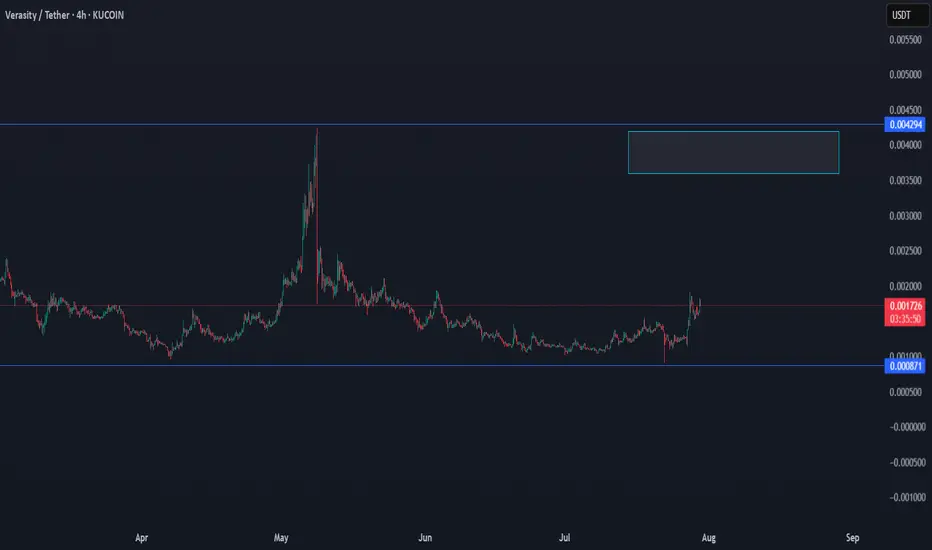
VRA/USDT THE RETURN TO KEY LEVELVra has good chance to return to the key level, since the last data shows a growth in the volume.
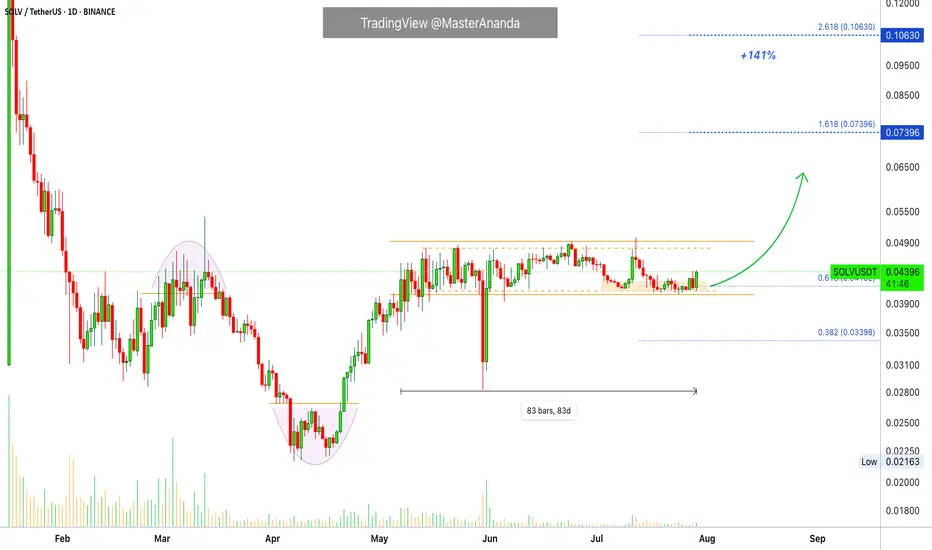
Solv Protocol · Bitcoin Staking · 140% Profits PotentialSolv Protocol has been sideways for 83 days, and it looks ready to rise. The market bottomed in April and afterward has been bullish ever since. It is nice to see how tight the trading range is.
This chart pattern is not very common. When a pair has a chart drawing that is not seen often, it means that it can move differently to others. It can go down while others are going up, but it can also go up while others go down.
The action is happening near the lower boundary of the range, perfect to buy as the action happens near support. When at resistance we can expect a drop; at support, a rise. And here SOLVUSDT seems eager to start rising.
With a close today above 0.04411, we get a strong signal for additional growth. The breakout can happen within a few days but the trend that follows can last for months. Catching the breakout can be nice and fun. Sometimes they reverse though to grow only after a few weeks.
Namaste.
DeFi’s Make-or-Break MomentThe spotlight today is on TOTALDEFI, an index that could become one of the most exciting charts in the crypto market.
While many altcoins look heavy under selling pressure, TOTALDEFI is holding firmly at the 61.8% Fibonacci support near 116B. This zone is often a turning point where strong reversals begin. If the level continues to hold, we might see a 20% move to the upside, signaling renewed strength in the DeFi sector.
This price action could be a sign that decentralized finance projects are ready to lead the next market phase.

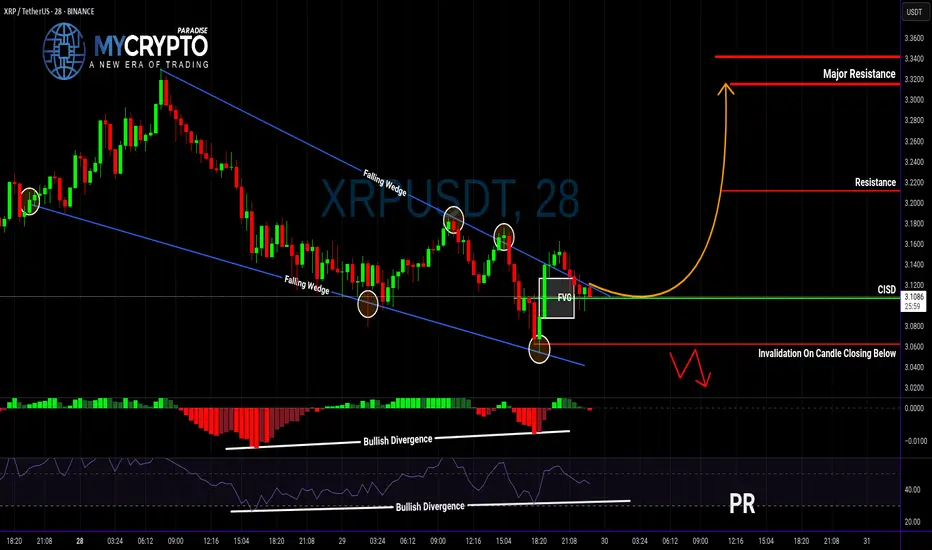
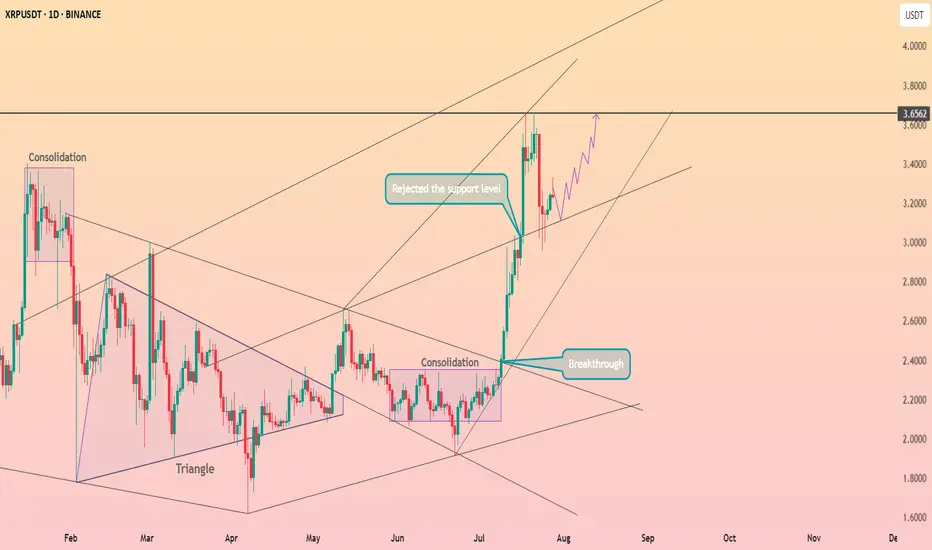
XRP Breakout Could Be a Trap… Or the Start of Something Big?Yello, Paradisers — are you about to buy into a fake breakout or position yourself right before a major move? Let’s break it down before emotions take over.
💎XRPUSDT has officially broken out of a falling wedge — a classic bullish reversal structure. What makes this breakout even more interesting is that it's supported by bullish divergence on both MACD and RSI, plus a Change In State of Delivery (CISD). All these technical signals combined significantly increase the probability of a bullish continuation.
💎Now, if you’re a disciplined trader looking for a safer entry with a higher risk-to-reward ratio, the smart move is to wait for a potential pullback to the CISD level. That would set up an opportunity offering a risk-to-reward of over 1:2.55 — not something you want to ignore.
💎But don’t get too comfortable…
💎If the price breaks down and closes below our invalidation level, the entire bullish idea is off the table. In that case, it’s wiser to stay patient and wait for clearer price action to develop. No emotional entries — only strategic moves.
🎖Strive for consistency, not quick profits. Treat the market as a businessman, not as a gambler. That’s how you’ll get inside the winner circle.
MyCryptoParadise
iFeel the success🌴
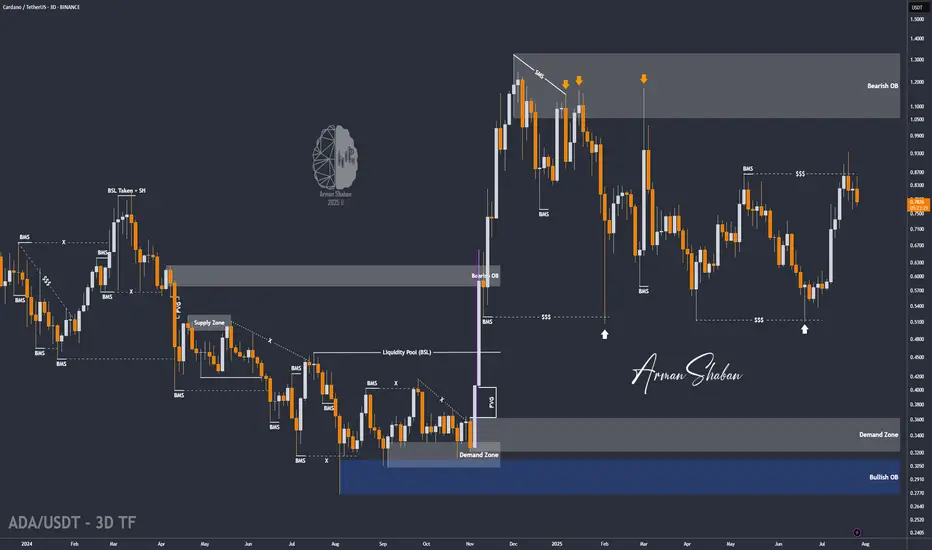
ADA/USDT | Pullback to Key Support – Can It Rebound Toward $1.32By analyzing the Cardano chart on the 3-day timeframe, we can see that after reaching $0.935, the price faced selling pressure and dropped by 18% to the $0.76 area. Now, the key is whether ADA can hold above the $0.75 level by the end of the week. If it succeeds, we could expect further bullish continuation. The next potential targets are $0.86, $0.93, $1.02, and $1.32.
Please support me with your likes and comments to motivate me to share more analysis with you and share your opinion about the possible trend of this chart with me !
Best Regards , Arman Shaban
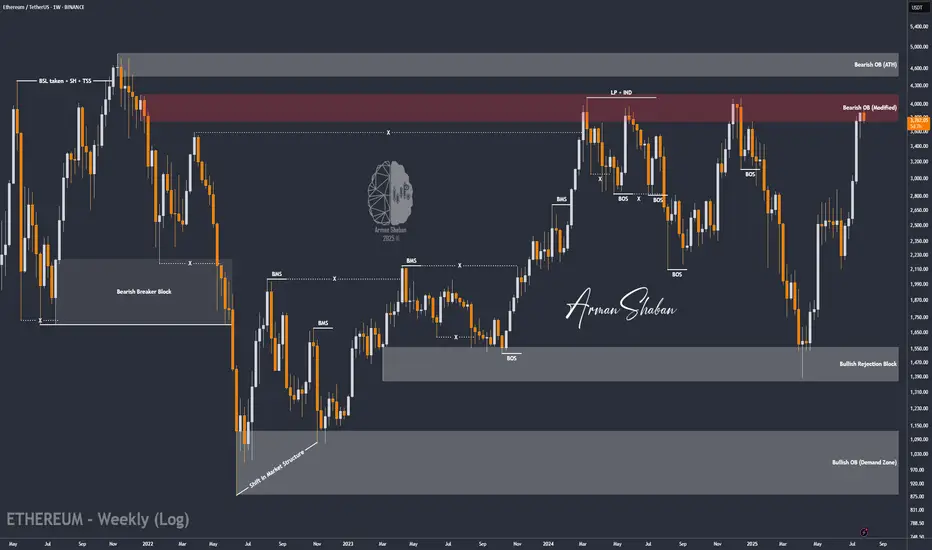
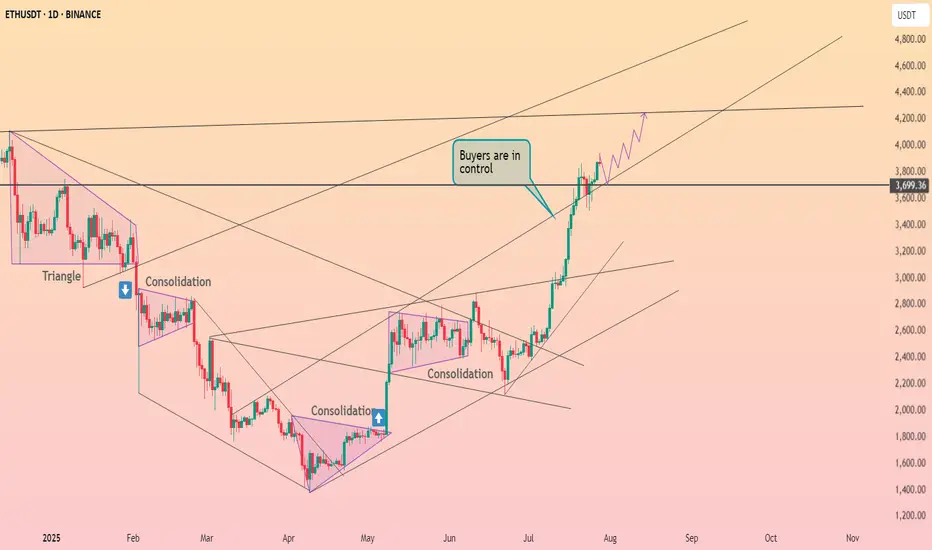
ETH/USDT | at a Crossroads – Hold Above $3440 or Sharp Fall!By analyzing the Ethereum chart on the weekly timeframe, we can see that after reaching $3940 and touching the key supply zone, ETH entered a slight correction and is currently trading around $3756. The key question now is whether it can hold above $3440 by the end of the week and push past $4000. If it does, we can expect another bullish leg toward $4100 and $4470. However, if the $3440 support fails, a sharp decline may follow — so this level is critical.
Please support me with your likes and comments to motivate me to share more analysis with you and share your opinion about the possible trend of this chart with me !
Best Regards , Arman Shaban
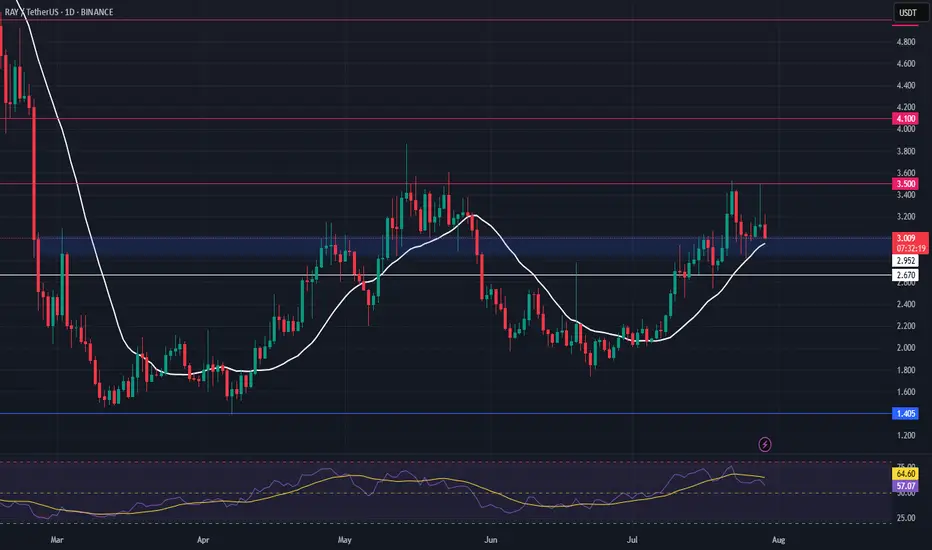
RAY Swing Trade – Key Support Retest in PlayRAY is pulling back toward a major support zone, offering a solid opportunity to position for a bounce as market structure remains constructive.
📌 Trade Setup:
• Entry Zone: $2.85 – $3.02
• Take Profit Targets:
o 🥇 $3.50
o 🥈 $4.10
• Stop Loss: $2.67
Bitcoin is testing the boundaries of the triangle ┆ HolderStatBINANCE:BTCUSDT is printing higher lows along trendline support near $67,800. The price is compressing into a wedge below $69,000 resistance. A breakout would confirm continuation toward $71,000–$72,000. Momentum remains intact unless $67.5k is broken. The market is building pressure for the next impulsive move.
Ethereum destroyed resistance at the $3700 level ┆ HolderStatBINANCE:ETHUSDT remains stuck between $3,260 and $3,320, forming a tightening range with bullish undercurrents. Price is holding a higher low and consolidating under resistance, hinting at re-accumulation. A breakout above $3,325 could send ETH toward $3,400+ in short order. Bulls remain in control above $3,260.
XRP held the support line ┆ HolderStatBINANCE:XRPUSDT is holding above $0.685 support after a correction from recent highs. Price is stabilizing inside a horizontal channel, with buyers defending the bottom of the range. A clean push above $0.70 would reopen the path toward $0.75. The market is at a decision point with strong reactions at both ends of the range.
Solana maintains its upward structure ┆ HolderStatBINANCE:SOLUSDT is bouncing from the $170–172 zone, building higher lows just below resistance at $180. The structure is shaping into a rounded bottom with signs of accumulation. If SOL clears $180 with volume, targets lie at $188 and beyond. Trend remains bullish as long as price stays above the local demand zone.

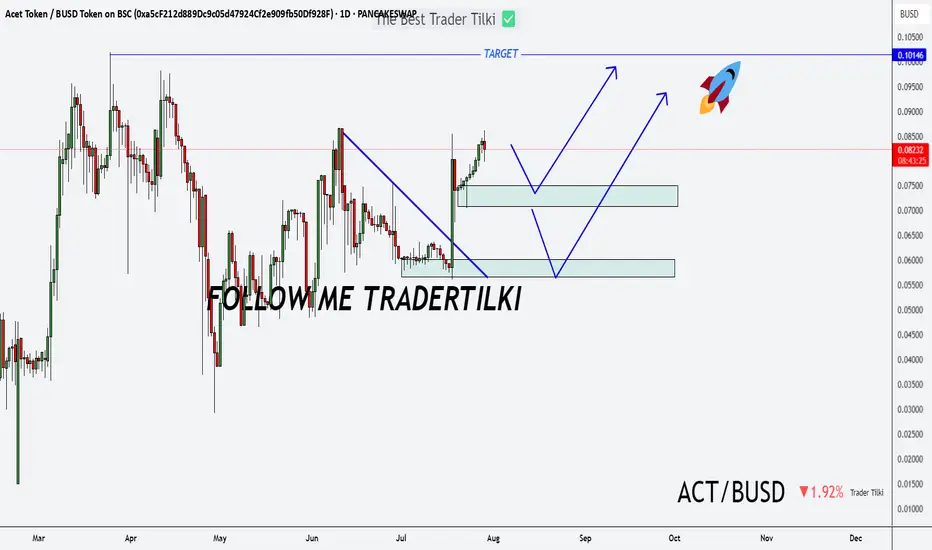
Act Bust on My Radar: Long-Term Vision, Short-Term Target!Hey folks 👋
I’ve put together a solid analysis for a promising token: **Act Bust**.
Whether it hits my entry level or not, I’ll be holding this token long-term.
Right now, the target is set at **0.10146**—once we get there, I’ll update you all.
Stay tuned, and trade smart 💼🚀
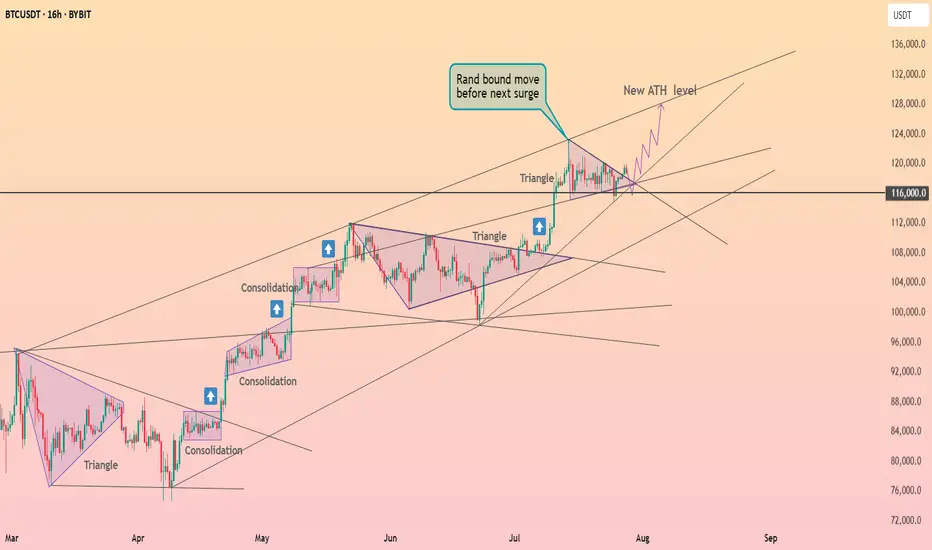
Bitcoin Weekly Recap & Gameplan | 27.07.2025📈 Market Context:
Bitcoin maintained its bullish momentum, driven by continued institutional demand and a supportive U.S. policy backdrop.
Last week’s gameplan played out well — solid profits were captured (see linked chart below).
🧾 Weekly Recap:
• Price made a bullish retracement into the Weekly FVG (purple line) exactly as projected in last week's post.
• From here, I expect continuation toward new all-time highs.
📌 Technical Outlook:
→ First, I expect a short retracement and a 4H swing liquidity grab at 117,828$.
→ Then, a strong continuation move toward ATH targets.
🎯 Setup Trigger:
Watch for:
✅ 4H liquidity sweep
✅ 15M–30M bullish break of structure (BOS)
This is the confirmation zone for potential long setups.
📋 Trade Management:
• Stoploss: Below confirmation swing low
• Targets:
– 120,938$
– 123,400$
💬 Like, follow, and drop a comment if this outlook helped — and stay tuned for more setups each week!

ARKK: The Calm Before the Innovation Storm -ALTSEASON Is COMING🚀 ARKK: The Calm Before the Innovation Storm 🌪️
The markets are shifting, and disruption is about to go vertical. ARK Innovation ETF (ARKK) is quietly positioning itself for what could be the most explosive move of this decade. With high-conviction bets in AI, Bitcoin, genomics, and next-gen tech, this isn’t just a fund—it’s a launchpad for exponential growth.
This post breaks down exactly why ARKK could go parabolic—and why the smart money is already moving in. 👇
Explosive upside in 2026
ARKK is already up over 24% YTD , showing strong momentum compared to broader markets and signaling early stages of a potential parabolic move .
High-conviction concentration in game-changers
Top 10 holdings include Tesla, Roku, Zoom, Coinbase, UiPath, Block, Crispr Therapeutics, DraftKings, Shopify, and Exact Sciences. These are leaders in innovation sectors with massive upside potential .
Deep exposure to Bitcoin and digital assets
Heavy allocation to Coinbase and Block gives indirect exposure to Bitcoin . If BTC breaks into a new cycle high , ARKK stands to benefit significantly.
Positioned in exponential growth sectors
Focus on AI, genomics, EVs, fintech, robotics, and blockchain , all of which are entering accelerating adoption phases globally.
Aggressive smart-money accumulation
Cathie Wood’s team continues buying aggressively during dips, reinforcing institutional confidence in the fund’s long-term trajectory.
Technical breakout structures forming
Ascending triangle and multi-month consolidation breakouts suggest a technical setup primed for explosive upside .
Innovation supercycle aligning
ARKK's themes are aligned with major global shifts like de-dollarization, decentralized finance, and AI convergence .
High beta = massive upside leverage
With a beta above 2 , ARKK tends to outperform in bull runs , offering leveraged exposure to innovation without the need for margin.
Resurgence of top holdings
Names like Coinbase, Tesla, Shopify, and Roku are up 50%–100% YTD , driving ARKK’s NAV growth and fueling bullish sentiment .
Long-term vision with short-term catalysts
The fund projects 5x returns over the next five years , while Bitcoin halving cycles, tech innovation, and regulatory clarity serve as short-term ignition points .
Marty Boots | 17-Year Trader — smash that 👍👍, hit LIKE & SUBSCRIBE, and share your views in the comments below so we can make better trades & grow together!

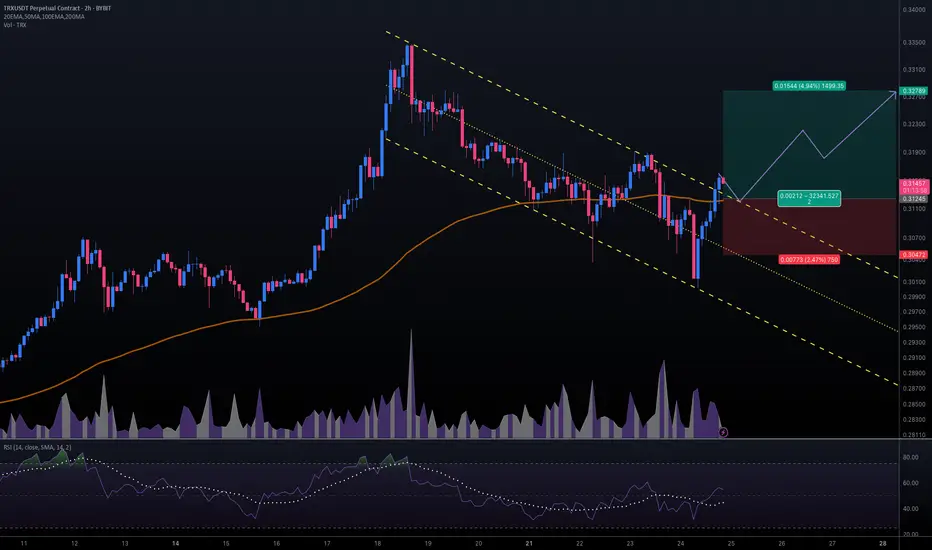
#TRXUSDT #2h (ByBit) Descending channel breakout and retestTron just regained 100EMA support and seems ready for bullish continuation after a pullback to it.
⚡️⚡️ #TRX/USDT ⚡️⚡️
Exchanges: ByBit USDT
Signal Type: Regular (Long)
Leverage: Isolated (16.0X)
Amount: 5.1%
Entry Targets:
1) 0.31245
Take-Profit Targets:
1) 0.32789
Stop Targets:
1) 0.30472
Published By: @Zblaba
CRYPTOCAP:TRX BYBIT:TRXUSDT.P #2h #TRON #DPoS #L1 #Web3 trondao.org tron.network
Risk/Reward= 1:2.0
Expected Profit= +79.1%
Possible Loss= -39.6%
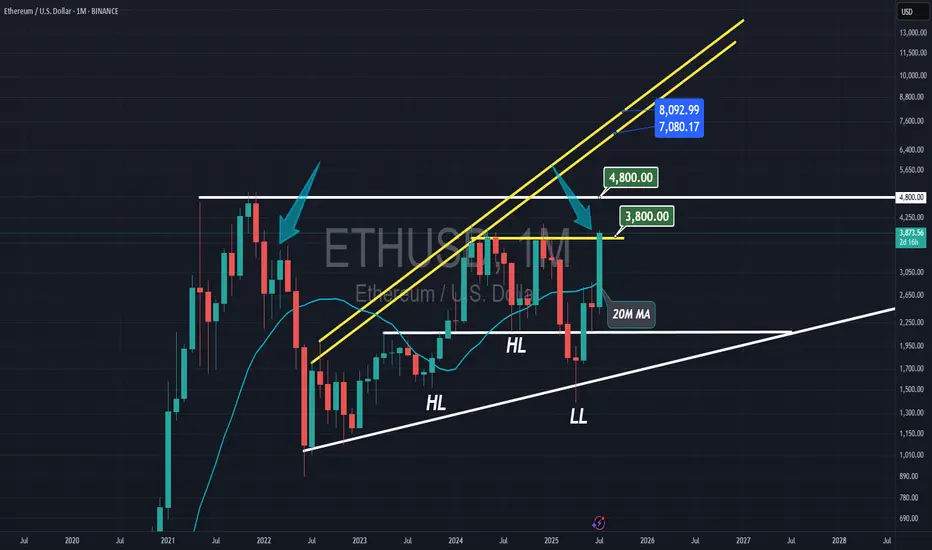
Ethereum the HIGHEST MONTHLY CANDLEEthereum is closing its highest monthly candle since 2021, signaling very bullish months ahead, with $8,000 as the resistance.
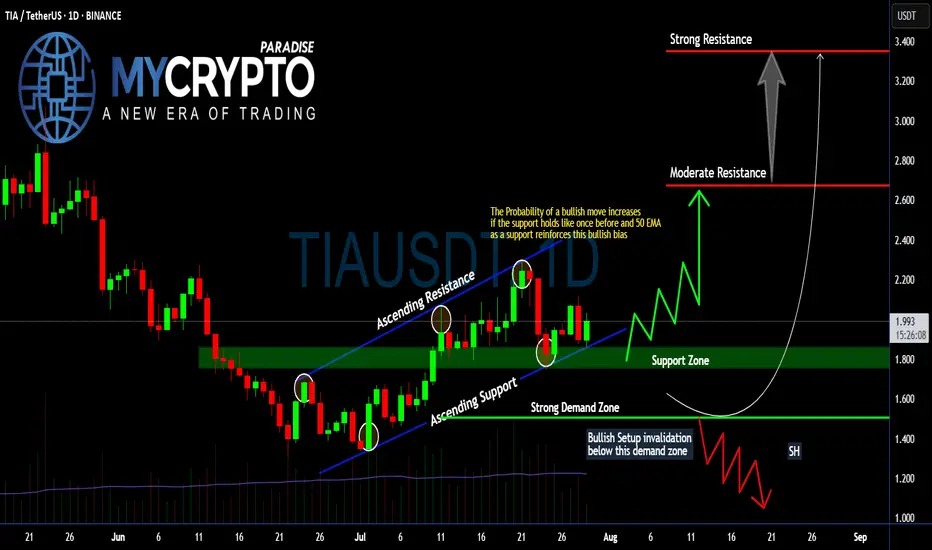
Will #TIA Continue to Soar or Bears Can Halt it? Must Watch Yello, Paradisers! Will we see #TIA continue to soar from here, or can bears halt its momentum? Let's see the latest setup of #Celestia to see what's going to happen:
💎Following a textbook ascending channel structure, #TIAUSDT has been respecting both its ascending resistance and ascending support, with each touchpoint confirming trader participation and growing confidence. Price is currently holding above the 50 EMA and within a crucial support zone between $1.80–$1.90—an area that previously triggered a strong impulse move to the upside.
💎The probability of a bullish continuation increases significantly as long as the #TIAUSD respects this support zone and the 50 EMA acts as dynamic support. If this level continues to hold, we expect a move toward the moderate resistance around $2.67, the key area where sellers previously stepped in aggressively.
💎But that’s not all—if bulls gain momentum and break above $2.67 with strong volume, the next price magnet becomes the $3.34 level, where strong resistance and high-volume node overlap. This level would likely be the point of exhaustion unless broader market momentum takes over.
💎However, caution is critical here. If price breaks below the strong demand zone around $1.507, this invalidates the bullish structure entirely and opens the door for a swift move down toward the $1.20–$1.00 range, where a potential market shakeout could occur. Remember, a failed bullish setup often becomes a powerful bear trap for undisciplined traders.
Stay patient, Paradisers. Let the breakout confirm, and only then do we strike with conviction.
MyCryptoParadise
iFeel the success🌴
GBPJPY 4HOUR TIME FRAME BUY ANALYSISOn the 4-hour chart, GBP/JPY is showing clear signs of a renewed bullish trend:
Higher-highs & higher-lows
Since mid-July, price has been carving out a staircase of successive peaks and troughs. The latest swing low around 197.30 held firm, and the subsequent rally cleared the June–July consolidation high near 198.40.
Breakout and retest
Price broke above a shallow descending trendline at ~197.65 late yesterday, then pulled back to retest that line as new support. Your entry at 197.902 sits just above that retest, giving a tight buffer to the stop.
Stop-loss placement
The SL at 197.275 undercuts the recent 4H swing low (197.30), so if that level fails it argues the bullish thesis is invalidated.

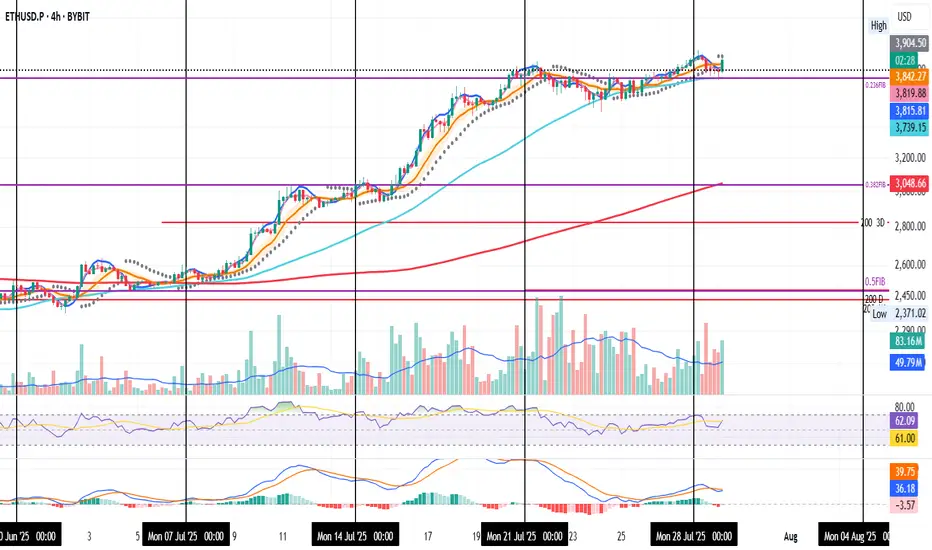
Strong ETH on the 4H !
ETH is now in the process of retesting both the 50MA and the 0.236 Fib level.
This current candle is closing strong — with solid volume. If momentum holds, both systems are close to flipping bullish:
– PSAR is about to flip
– MLR and SMA are lining up to cross above the BB center
RSI has cooled off, giving room for more upside, and MACD is close to turning bullish.
In short:
We’ve got a confirmed Fib retest on good volume
Both systems are preparing to signal long
And both oscillators are backing the move
We’ll be here to watch it unfold.
Always take profits and manage risk.
Interaction is welcome.
XMRUSD - Monero And It's Warning-LinesToday we’re analyzing Monero, with a focus on a new aspect of Median Lines — the Warning Lines, or WL for short.
Warning Lines are simply extensions of the distance between the Center Line (CL) and one of the Median Line’s outer boundaries, either the Upper Median Line Parallel (U-MLH) or the Lower Median Line Parallel (L-MLH).
So why are they important for us in our trading?
As you can see, WL1 and WL2 mark important price levels. WL2 is where price reversed, while WL1 acts as resistance.
Just like with the standard lines, our full trading rule set applies to Warning Lines too. This includes scenarios like a Hagopian, a breakout or "Zoom Through," and the Test and Re-Test.
Now, looking at the current analysis:
The price was rejected at WL1 after falling from WL2. This shows strong resistance at WL1, and now the price is heading toward the U-MLH.
If the price breaks below the U-MLH and starts opening and closing within the Fork again, there’s a strong chance it will move back toward the Center Line in the near future.
That could be your signal to take more profits, close the position, or possibly even short Monero.
Personally, I find it difficult to short crypto due to the high risk of manipulation by whales in the market. I prefer not to get caught in a short position if the price suddenly gaps to the upside. So I probably look to take a new position or add to an existing one, since it is a fair level where price found it's center.
That’s it for today.
Did you learn something new?
Great. See you next time, and trade safe.

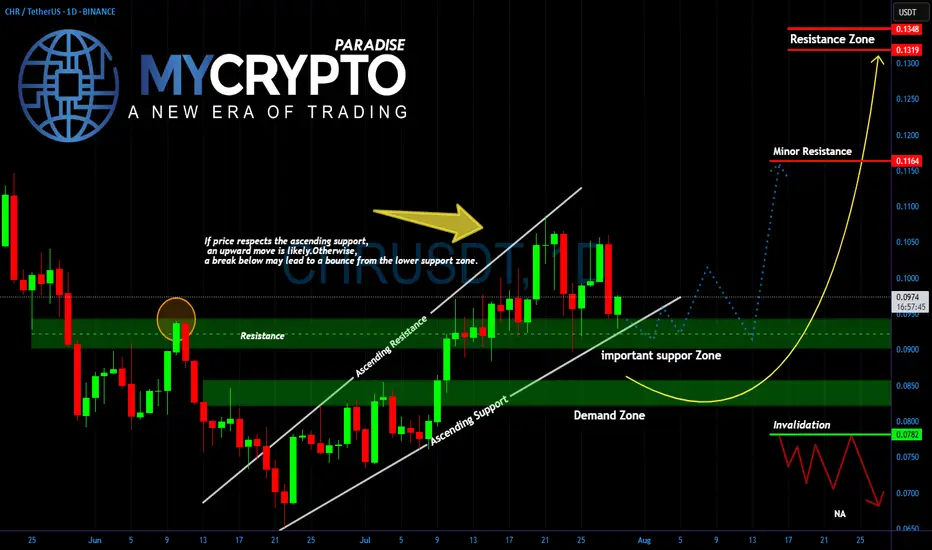
CHR Is About to Explode or Collapse Are You Ready for the Next BYello Paradisers, did you notice how #CHRUSDT is now testing the exact zone we warned about earlier? After weeks of climbing inside a clean ascending channel, the price is now sitting right on top of a critical support area. This is no coincidence what happens here will determine the next major wave.
💎The structure remains bullish as long as #CHR respects the ascending support trendline and the horizontal zone around 0.0900. This region, previously a strong resistance, is now acting as key support. If the bulls step in from here, we could see a sharp rebound toward the minor resistance near 0.1169. A confirmed breakout above that could open the path toward the upper resistance zone between 0.1320 and 0.1351.
💎But don’t get too comfortable. A clean break below this support zone would shift momentum back to the downside, dragging price toward the deeper demand area between 0.0840 and 0.0800. If the structure fully collapses and price breaks below 0.0782, we’d treat that as a clear invalidation of the bullish case, and a much lower range could open up.
For now, CHR remains in a waiting zone. It’s the reaction here that will give us the signal. Let the price come to you don’t chase it.
MyCryptoParadise
iFeel the success🌴