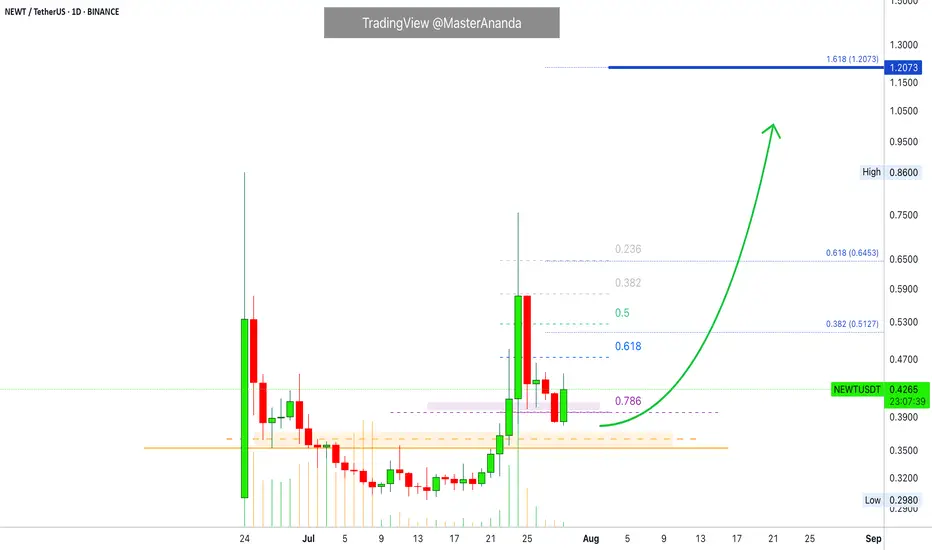
Newton Protocol · Round 2 Goes Easy To $1.20The higher low is in now and the strong bullish breakout we witnessed just a few days ago reveals the massive force behind this pair. Traders are ready to trade.
The high volume is good because volume is needed for growth. The first jump was only a small taste of what is possible, and seeing the action as it is now, NEWTUSDT is already preparing to produce a higher high.
This is good news for a buyer now and also for the rest of the market. If NEWTUSDT is ready to move forward with strength, this means that the current retrace is over and we will see a resumption after just 4 days.
Let's get to the chart.
Notice the rounded bottom pattern. Notice the recent bullish wave and the correction that followed. The action went below 0.786 Fib. and as soon as this level hit there was a recovery. Now the day is full green and the action is happening above this strong support zone. This can mean that NEWTUSDT is ready to move short-term. A higher high move would require days and days of sustained growth to be achieved. Getting the bottom can make for a very entertaining ride.
Patience is key. Market conditions can always change.
Be ready to wait and you should do great. You have great timing for reading this now, the altcoins market is just starting a major advance and bullish phase.
Namaste.
Crypto
Dogecoin · Risk of Much Lower is MinimumWe start the process by looking at a few charts. We start with the big projects in order to gain a perspective of the bigger picture. After reviewing 10-20 charts, we start to get an idea, but we don't form any picture in our minds, we just continue reading; reading the articles and reading the charts.
After just 10 days, we have anywhere between 80 and 100 articles/charts. Now we have a better picture of the market. We know how each sector is doing and this further helps us develop our bigger picture, the one that will help us call the shots.
After we review 150 to 200 charts and trading pairs, we get the pulse of the market. Where the energy flows, our attention goes and sometimes our attention reaches before the energy and this gives us an entry prize.
It will continue to work in this way. If you look at the market daily, read open to accepting new information, accepting always that I can be wrong, we can continue to develop a sense of what is really happening.
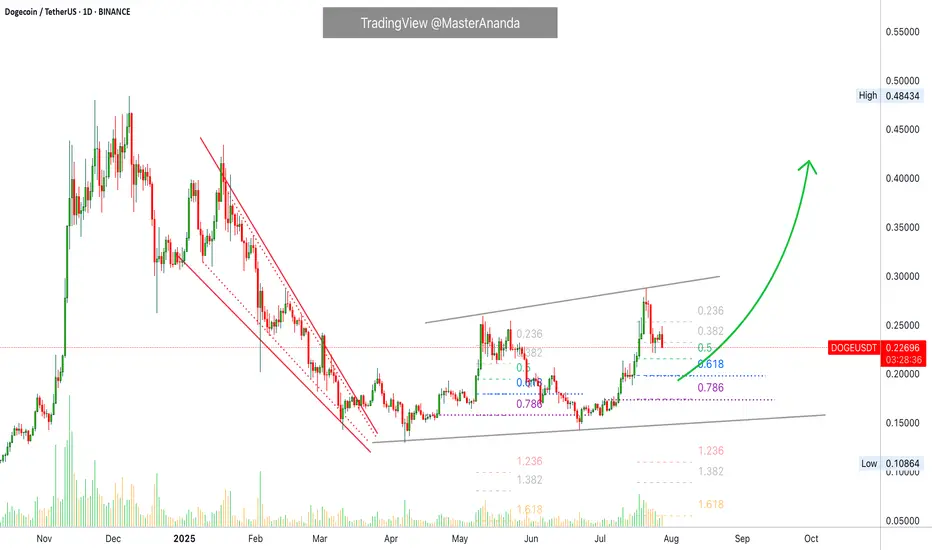
Dogecoin is making a minor pause after weeks of sustained growth. It is normal, if the market is going to be growing for months, everything cannot happen in a day. Five steps forward, three steps back.
Namaste.
XRP Update · What To Expect Short-TermRetraces should be considered a buy opportunity. It is the only time when prices are not rising. Whenever there is a stop, a retrace, that is an opportunity to enter or buy more before the continuation of the bullish trend.
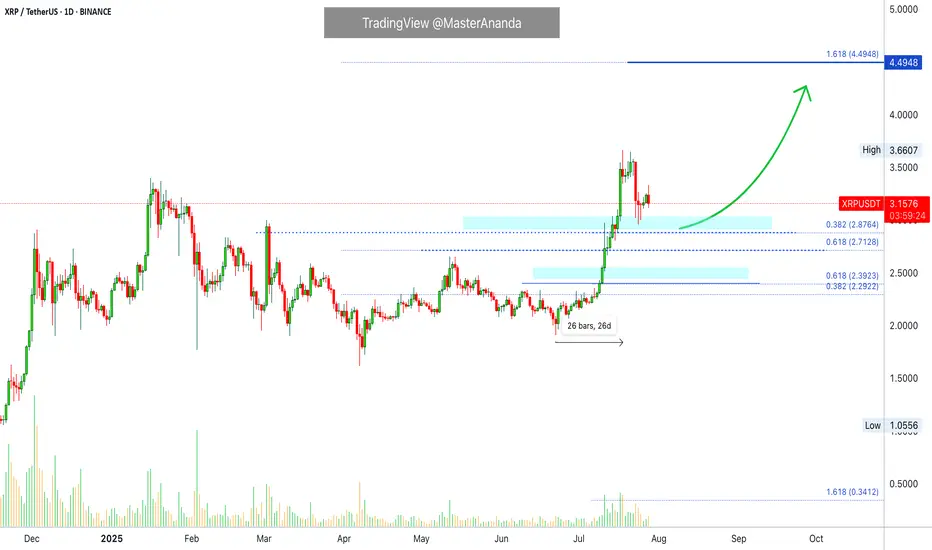
XRP started its latest major advance 22-June growing for 26 days straight peaking 18-July. there were only two red days in the entire move. This is certainly a strong advance and resulted in a new all-time high. More than 90% growth. After a strong move, there is always a pause, or correction or retrace.
A retrace can last a few days. Seeing this chart, here it can even last for weeks as I see no hurry on this chart. Prices can consolidate at support before the next advance. Some small swings are expected but nothing big and always knowing that the end result will be an advance going further toward $4.44. The bigger picture.
Do not try to SHORT within a retrace or even correction. It can lead to disaster. It is better to wait for support to show up and once confirmed buy LONG. The upside has no limitations while the downside is limited. It is harder and carries more risk, even more now that the market is bullish and people are starting to wake up. People can see the development of a major rise now, people are becoming aware and soon there will be a rush. This rush will fuel the next wave of growth.
XRP can consolidate for a little while after finding support before reaching higher. Market conditions remain strongly bullish for this pair. If support breaks, things can change.
Namaste.
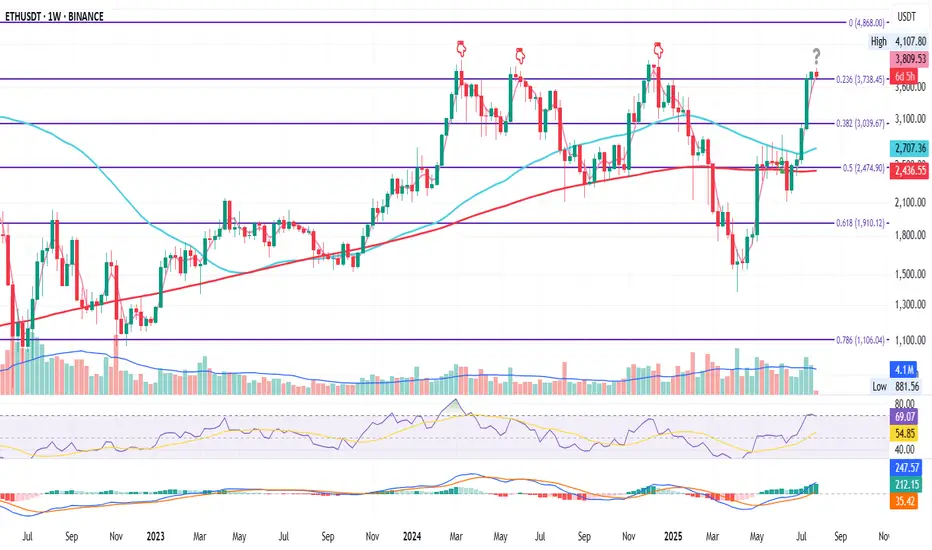
ETH Weekly Flip ZoneETH on the Weekly
ETH just closed the week above the 0.236 Fib level at $3738.45.
It’s the fourth attempt to conquer this zone since the June 2022 bottom.
If price holds above this level, the odds of continuation increase.
If it fails, we could see downside.
It may also just consolidate here for a while.
RSI just touched overbought, and MACD remains green — still some room for upside.
I remain bullish long term, but this looks like a smart area to manage risk if you’re late to the move, or take partial profits.
Always take profits and manage risk.
Interaction is welcome.
20:1 R:R setup for Ethereum.The train is about to leave the station if BTC breaks above 120K. This setup offers a favorable risk for a 20:1 R:R.
Entry: 3,750
Stop-loss: 3,580
Target: 7,000
BTC.D Stuck in the MiddleThis is BTC.D on the daily
After losing the 50MA in the final days of the first half of the month, BTC dominance found support at the 0.382 Fib level, only to bounce back up and get rejected at 62.25%.
From here, it all depends on which level breaks first: the 0.382 support or the 62.25% resistance.
Whichever way it goes, we’ll be here to watch it unfold.
Always take profits and manage risk.
Interaction is welcome.

Bitcoin & Altcoins: Technical Analysis and Market OutlookBitcoin (BTC) Analysis
Bitcoin is currently forming a short-term bullish pennant within a larger long-term pattern, projecting a potential target around $135K.
Key Levels: BTC is consolidating between the lower zone at $117.3K and the upper zone at $119.7K.
Breakout Potential: A break above this pattern could propel BTC toward a new all-time high (ATH), surpassing the current ATH at $123K.
Macro Events This Week:
Wednesday: The Federal Reserve will announce its interest rate decision, with no changes expected.
Wednesday: ADP Employment Report, providing insights into potential future rate cuts.
Friday: Non-Farm Payrolls (NFP) data release, which could further influence market sentiment.
Ethereum (ETH) Breakout
Ethereum has decisively broken through its 4-year historical resistance around $3,725, closing the week above this level. This breakout signals a strong bullish outlook for ETH, with potential for further upside.
Altcoin Highlights
BNB: Has shattered its previous all-time highs, showcasing significant bullish momentum.
XRP: Reached approximately $3.64, reflecting strong gains and market interest.
Market Context
The crypto market is showing robust activity, with altcoins following Bitcoin and Ethereum's lead. Key macroeconomic events this week could introduce volatility, so traders should stay vigilant.
Disclaimer: This is not financial advice. Every trader is responsible for their own strategy and risk management.
Happy trading and good profits! 🚀

Ethereum Eyes $8K After Bullish BreakoutEthereum (ETH) is setting up for a powerful move. After hitting a multi-month high last week, ETH pulled back into a higher-low formation—strengthening the newly established bullish trend.
Money flow is shifting: with recent crypto legislation, Ethereum is now benefiting even more than Bitcoin, marking a notable change in market dynamics.
📈 Technical Highlights:
✅ Short-term target: $4,800–$5,000 (new all-time highs)
✅ Long-term potential: $7,000–$8,000
🛡️ Key support: $2,800–$3,000 (bullish as long as this holds)
📣 Takeaway:
Ethereum’s trend is firmly bullish. As long as support holds, pullbacks could offer strong entry opportunities for both swing traders and long-term investors.
#Ethereum #ETHUSD #Crypto #Trading #TechnicalAnalysis #CryptoTrading #EthereumPrice #Altcoins #Bullish #Breakout

BTC/USD: Bullish Pennant Holds Above Breakout ZoneBitcoin is consolidating within a bullish pennant pattern just below the 120,000 level, following a sharp rally from the June lows. Price action has compressed between converging trendlines, forming higher lows and lower highs — a classic continuation formation in an uptrend.
Importantly, BTC remains well above prior resistance (now support) at 112,000, with both the 50-day SMA (109,837) and 200-day SMA (95,838) trending upward. This suggests strong medium- to long-term bullish structure.
Momentum indicators support the case for continuation:
MACD remains in positive territory, albeit with a slight bearish crossover, hinting at near-term indecision.
RSI is holding around 59.6, just below overbought, reflecting consolidation rather than distribution.
A breakout above the pennant resistance and psychological 120,000 barrier would likely trigger renewed bullish momentum, targeting fresh highs. Conversely, a breakdown below 116,000 could expose 112,000 as a key retest zone.
Bias: Bullish continuation favored while above 112,000. Watch for breakout confirmation from the pennant.
-MW

BTC Roadmap Ahead: Ideal Entry, TP Zones & What to AvoidAs long as Bitcoin stays above the ~$98,200 zone on the daily timeframe, I believe the bullish trend remains intact.
No need to panic — what we need now is rational decision-making, not emotional reactions.
Since price has reached a key area around $118K–$120K, I’ve already taken partial profits at this level.
If no major fundamental changes occur and conditions remain stable, I see the maximum target for this leg somewhere between $134K and $140K, where I plan to secure additional profits.
Right now, my main objective is to increase my Bitcoin holdings.
The first buy zone I’m watching is around $110K, clearly marked with a red circle on the chart.
When price reaches this zone, I won’t enter immediately — I’ll wait for consolidation and confirmation, as a deeper correction is still possible.
There’s no need to rush — patience is power.
📌 All I’m trying to do is accumulate as much Bitcoin and sats as I can — because I know one day, I’ll be proud of it.
🔁 This analysis will be updated whenever necessary.
Disclaimer: This is not financial advice. Just my personal opinion.

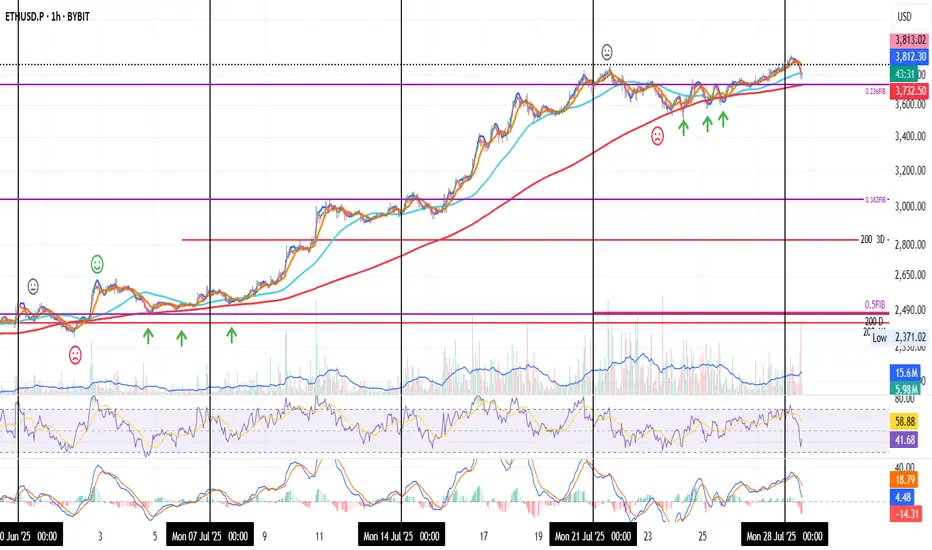
New Week New High for ETH
It’s just the start of the week, and ETH is already printing new highs.
But let’s zoom in on a familiar pattern in price action:
During the week of June 30 – July 7, ETH floated above the 0.5 Fib and the 200MA early in the week. Then it dipped below both levels, only to bounce back and start holding the Fib as sup
port. From there, price slowly climbed alongside the 200MA, bouncing off it a few times, then it took off.
Last week showed a similar setup, this time around the 0.236 Fib and 200MA.
Now both levels are sitting close together again. So, we might see another dip below them before ETH pushes higher.
Of course, if price fails to reclaim the zone, more downside could follow.
But as always: we’ll be here to watch it unfold.
Always take profits and manage risk.
Interaction is welcome.
Why hello there ETH, can we be friends?barring any black swan events - now that we have the new ETH release forthcoming, the bitcoin halving in the future, and the bear market behind us (fingers crossed?), this is the trend - we'll see some stops and volatility at the major support/resistances for trading.
I'll just be holding for the next year or two. Less stress!

Avalanche · Early or Late? · Targets & TALook at AVAX. It traded at $18 for 21 days, three weeks, and now its price is already at $27, 50% higher. That's how it all changes in a matter of days. In just 19 days Avalanche is trading much higher and soon you won't be able to get a buy below $50. $18 will seen like an old dream. Gone so long ago but it was available just recently. The same will happen with the current price.
Avalanche is still cheap below $30. The all-time high is $147. We can easily aim for $100 just to see how things will go. We know this level can hit easily so buying below $30 should be an easy decision and choice. That is if you like this pair.
This is another strong project, another bullish chart but always focused on the long-term. If you are looking at it very close, we can have days red but nothing changes. This will not change the bigger path that is being travelled to a new all-time high. So only leveraged traders should be careful when opening a new LONG position because the market can shake the next day. If you trade spot, buy and hold; buy and accumulate with no worries necessary because it is still early.
You can do great in this bull market; we can all do great. More opportunities will continue to develop and the market will continue to heat up.
The next major target for this project mid-term is $64, followed by $96 and then the ATH.
Once we enter the price discovery phase, new all-time high territory, anything goes. The action can continue rising and hit levels hard to imagine, for months, or it can stop just after a few weeks. It all depends on how much money into the market flows.
Namaste.

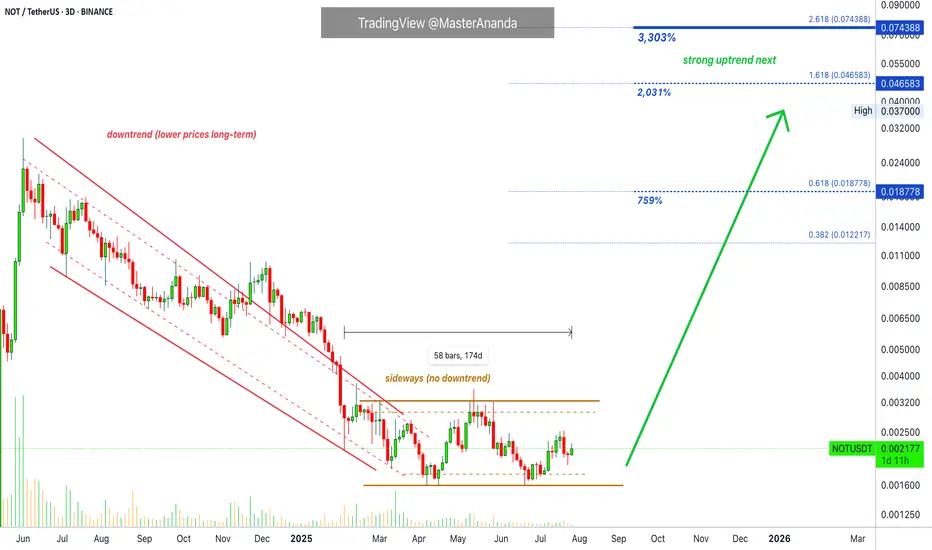
Notcoin · Last Chance, Great Entry & Leveraged Trade SetupNotcoin (NOTUSDT) is trading just above the 2025, 3-February low. This low and major bearish breakdown signals the start of the formation of a bottom. An accumulation sideways phase at bottom prices. This phase has been going for 174 days, almost 6 months. That is six months with Notcoin accumulating, slowly, at bottom prices. What do you think is going to happen when Notcoin breaks out? It will be huge. It has been doing nothing for 6 full months and this is the type of pattern that fuels major growth.
Many pairs are already moving ahead but thank god others are still low giving us the opportunity to buy a strong setup with low risk and a huge potential for reward. This is the beauty of what we are about to experience. While some projects are growing, others remain at support and only grow after a different group completes its cycle. This means that opportunities will be endless. If one door closes, 300,000 new doors open. The market always gives a second chance and a third. The market will always bless you with success and great profits if you have the ability to wait.
Wait, for the right choice. Wait for the right opportunity and time to take action. If you were to sit in front of your device and read—as much as you need, as much as you can—you will realize that eventually you start to see everything extremely clear. Even if you have certain doubts about a major move you will have no doubts about the action that is right for you. And that's the power of reading. The more educated you are about the process you are undergoing the higher your chances for success.
Prices are still low, good; but you need to be careful when using leverage. Make sure you cannot be liquidated regardless of what happens. Start small and only grow overtime with practice, training and experience. No need to rush, the market will continue function, it is not going away; we are only getting started.
Thanks a lot for your continued support.
Namaste.
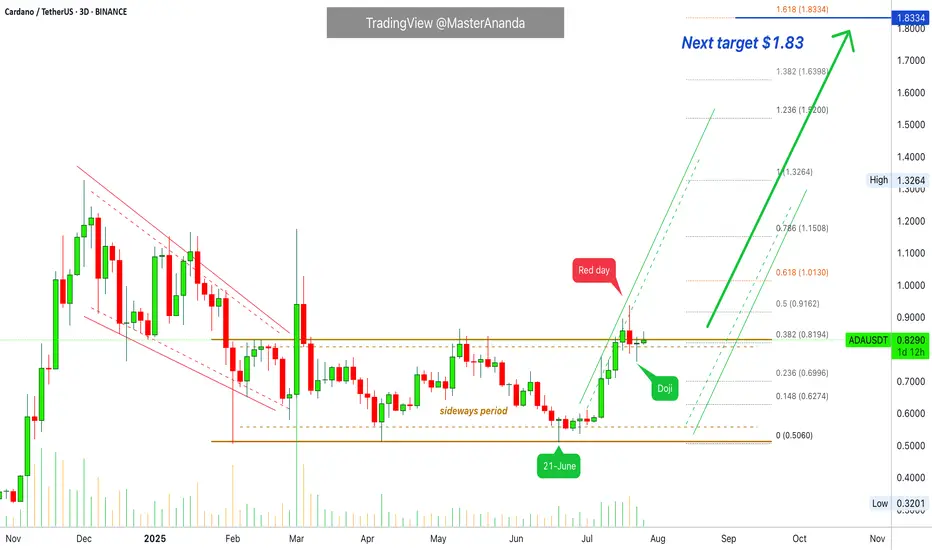
Cardano Update · Wait For New ATH Before Selling · Chart BullishI am using 3D candles. The last session is a Doji on ADAUSDT. There was a red session followed by a continuation with prices moving lower. That's last session, but it—the Doji—ended up closing green.
Sellers started to put pressure on the market and pushed prices lower (red day), by the next session, all selling was bought (Doji) and now ADAUSDT is back above 0.382 Fib. extension (0.8194). This is a bullish setup based on candlestick reading.
From here on ADAUSDT can grow to produce a higher high as long as it trades above this Fib. level, the continuation of the bullish move that started 21-June. So we had a small retrace and the action is recovering, right before bullish momentum grows, which means that this is a good setup to go LONG. It seems some positive event will develop soon and this will create a major wave, a major advance here and Cardano will see the highest prices in more than four years.
It can take a few days, not much longer; everything is pointing higher.
Here it is also wise to avoid selling too early. When we consider Cardano's potential for growth beyond $7, easily, we have to avoid paying attention to the temptation to sell when prices are still too low, the rise is only starting. It is ok to sell at major resistance levels if you have experience because there is always a stop before additional growth. If one is very active, it is easy to sell some at resistance and then buy more at support. But the easiest way is to buy and hold. If the entire bullish wave is set to produce 500%, this is always more than good enough so it is easy to hold thinking of the long-term.
We continue within the accumulation phase. While many pairs are already advanced and while prices are definitely growing, this is not it yet; things are about to go wild and it is better to be fully invested before the event. Everything Crypto. Buy Crypto. Hold Crypto. We are going up.
Namaste.
Ether Update · Accumulate, Buy & Hold · 2025 StrategyGood morning my fellow Cryptocurrency trader, I hope you are having a wonderful day.
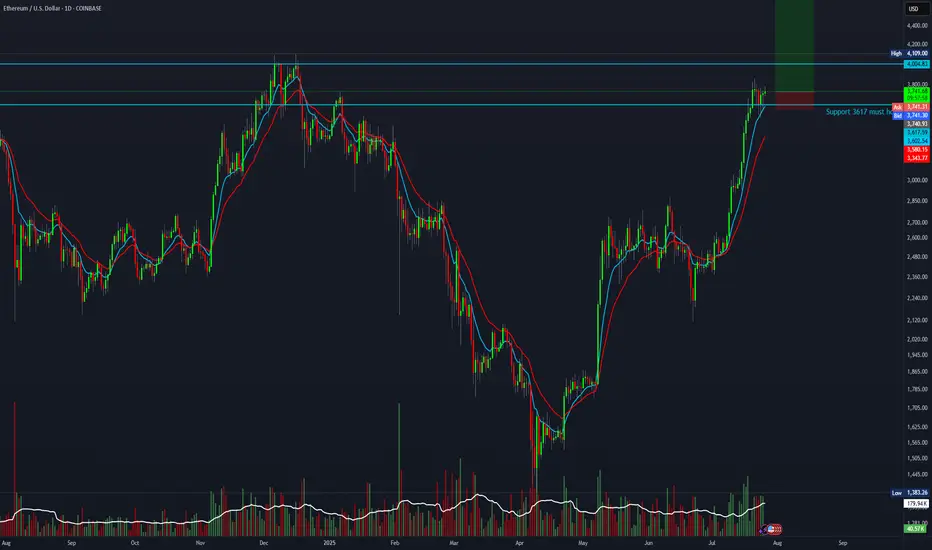
Ethereum continues really strong and today is trading at the highest price since December 2024. Right now getting close to a long-term resistance zone that was first established in March 2024. As soon as ETHUSDT manages to break $4,100 as resistance, we can expect a major advance toward a new all-time high. Remember, sustained long-term growth, just as it is happening already. Notice the slope on the rising wave since April. It will continue just like this, prices going higher and higher until a final jump produces very high prices based on a long wick.
Market conditions have not change since our last update. Everything is extremely bullish and the chart looks even better now, the rest of the market is also looking better so the focus should be on hold and preparing a profit taking strategy. How will you profit from this trade? How do you intend to sell? How will you reduce or close your position when the time is right? You can start preparing now.
There are many ways to approach the targets but it is always wise to wait at least until a new all-time high. Since we have enough data support a new all-time high as a high probability scenario, we want to benefit as much as possible from the uptrend and thus we ignore the initial easy targets. We go for the higher targets because we are now in the 2025 bull market.
When in doubt, you don't have to be 100% right but neither 100% wrong. If you don't know how the market will behave next, instead of thinking to sell the entire position, you can sell a small portion only, say 10%. And continue like this long-term.
There are many strategies, many ways to plan and win, but for now focus on holding patiently, patience is key. Those who can wait the longer without being tempted can produce the best results. Just let it roll... The market is set to grow. Accumulation and buying now the best choice.
Namaste.

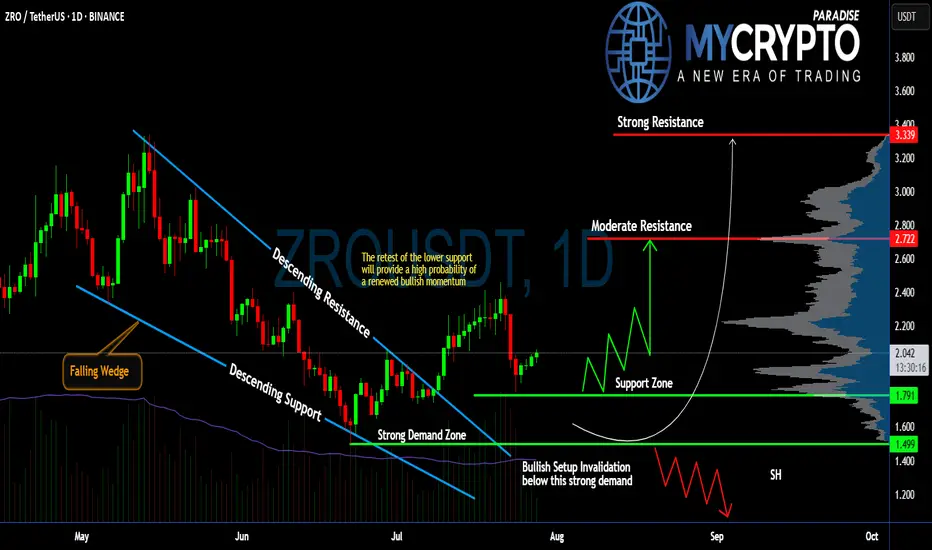
Will #ZRO Continue to Climb or Not? Must Watch For BullsYello, Paradisers! Are we witnessing the beginning of a powerful bullish reversal on #ZROUSDT, or is this just a fakeout setup? Let’s dissect this setup of #LayerZero:
💎After weeks of consistent bleeding, #ZRO has printed a classic falling wedge pattern, often a precursor to bullish reversals. This wedge has now been broken to the upside, with price currently trading around $2.037, suggesting renewed buyer interest following the breakout from descending resistance.
💎What’s crucial here is the retest of the wedge’s descending support, which aligns perfectly with a strong demand zone between $1.499 and $1.791. As long as #ZROUSD respects this zone, the probability of a bullish continuation remains high. This zone also serves as a clear invalidator for the setup—if price closes below $1.499, the bullish thesis will be off the table.
💎From here, if bulls can maintain control, we’re eyeing a potential move toward the moderate resistance at $2.722. That’s the first real hurdle where profit-taking or short interest could spike. A clean break above that level would open the path to the strong resistance around $3.339, where a heavy supply zone is likely to cap further upside.
💎Until then, we expect a series of zigzag corrections above the support zone before any sustained push higher. However, be cautious, losing the $1.499 support turns the structure bearish and could drag the price toward the $1.20 region, or lower.
Stay patient, Paradisers. Let the breakout confirm, and only then do we strike with conviction.
MyCryptoParadise
iFeel the success🌴
CARDANO (ADAUSD): Bullish Move Ahead!
ADA is testing a key daily support cluster.
I think the market is going to bounce from that
and continue growing.
Next resistance - 0.97
❤️Please, support my work with like, thank you!❤️

AUDUSD 4HOUR TIME FRAME ANALYSISOn the 4-hour chart, AUD USD has recently shifted into a shallow up-trend after carving out a higher low around 0.6480. From that support zone, price has rallied through a short-term descending channel, breaking its upper trendline just above 0.6500 and holding that breakout on the last two candles. The entry at 0.65231 sits just above a cluster of prior resistance–turned–support (0.6500–0.6520), giving the trade a solid foothold.
Momentum indicators confirm the bullish tilt: the 14-period RSI is riding around 60–65, neither overbought nor fatigued, suggesting room to run toward your target. Likewise, price is comfortably above both its 50-period and 200-period EMAs, with the shorter EMA crossing above the longer one roughly 12 bars ago, signalling that buyers are in control.

BITCOIN & 150kBitcoin in this RISING WEDGE, inside this huge RISING CHANNEL, gives us the resistance of the rising wedge & the middle line of the rising channel at $150,000.
This might be the TOP.

Celestia · A Strong Bullish Wave of GrowthCelestia right now looks pretty good. This one was called to my attention by one of my followers in the comments. The truth is that we've been looking at TIAUSDT and right now it continues to look good. The candles message is that the action is about to transform into a very strong advance. The action has been sideways for so long, with a bearish bent, that we can forget that the market always changes. We might forget that right around the corner there is big change. Everything is about to change and for the better that's what I know after looking at hundreds of charts. Celestia is the same.
Looking at the chart from a neutral standpoint, it is hard to predict what I am predicting because all we see is the same followed by more of the same. And that's my point, the market is always seeking change. It has been the same for too long and so everything changes now. The change is always the contrary to what was previously happening. So Celestia was down then sideways moving lower, and this will change into higher highs and higher lows. A strong bullish wave of growth.
Namaste.

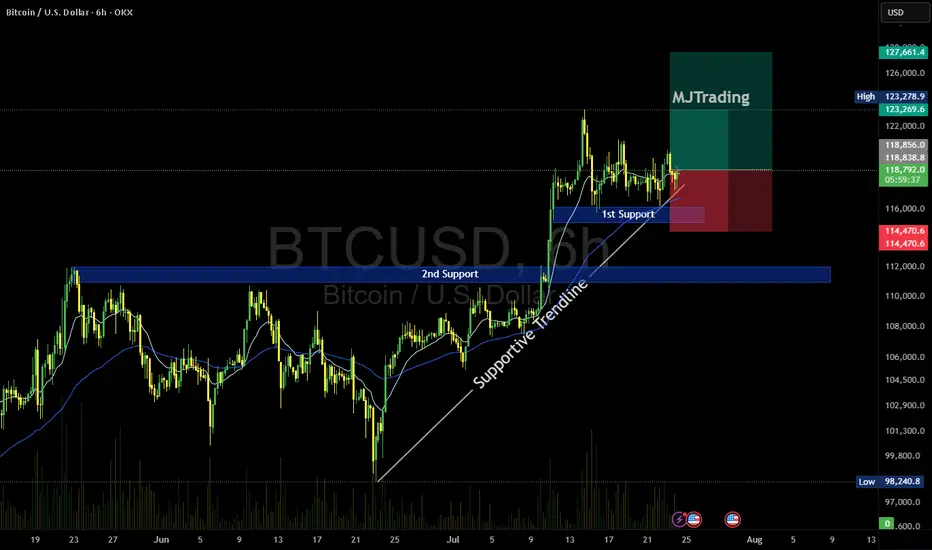
BTC/USD Buy Setup (6H Chart)📈 BTC/USD Buy Setup (6H Chart)
Strategy: Trendline Support Bounce
🔹 Entry
Price: $118,674.3
Reason: Price is bouncing off a supportive trendline and holding above the 1st Support zone.
🔻 Stop Loss (SL)
Price: $114,470.6
Reason: Below the 1st Support zone to protect against breakdown.
🎯 Take Profit Targets
TP1: $123,269.6
Reason: Near recent swing high, good for partial profit.
TP2: $127,661.4
Reason: Next resistance zone, ideal for full exit or trailing stop.
#MJTrading
#Bitcoin
Ethereum Weekly Recap & Gameplan | 27.07.2025📈 Market Context:
ETH followed the broader crypto market momentum led by Bitcoin, supported by institutional demand and positive macro policies in the U.S.
Last week’s plan played out cleanly — we saw strong gains from the 1H demand zone.
🧾 Weekly Recap:
• Price swept 4H swing liquidity and formed a 1H bullish BOS
• Created a solid 1H demand zone, from which price bounced strongly
• Momentum remained bullish as forecasted in last week’s post
📌 Technical Outlook:
→ Expecting a short retracement into 4H liquidity levels around 3761$ or 3702$
→ Then a continuation move towards ATH zone
🎯 Setup Trigger:
What I’m watching:
✅ Sweep of 4H liquidity
✅ Bullish BOS on 15M–30M
→ This will serve as the confirmation for long entries
📋 Trade Management:
• Stoploss: Below the confirmation swing low
• Target: 4100$
💬 If you found this helpful, don’t forget to like, comment, and follow — I share setups like this every week!
