$BNT/USDTBNT is showing a strong upward trend and is currently sitting on the 23% Fibonacci level. The targets have been identified based on the Fibonacci retracement. You can either wait for a correction or enter a partial buy at the current level
Crypto

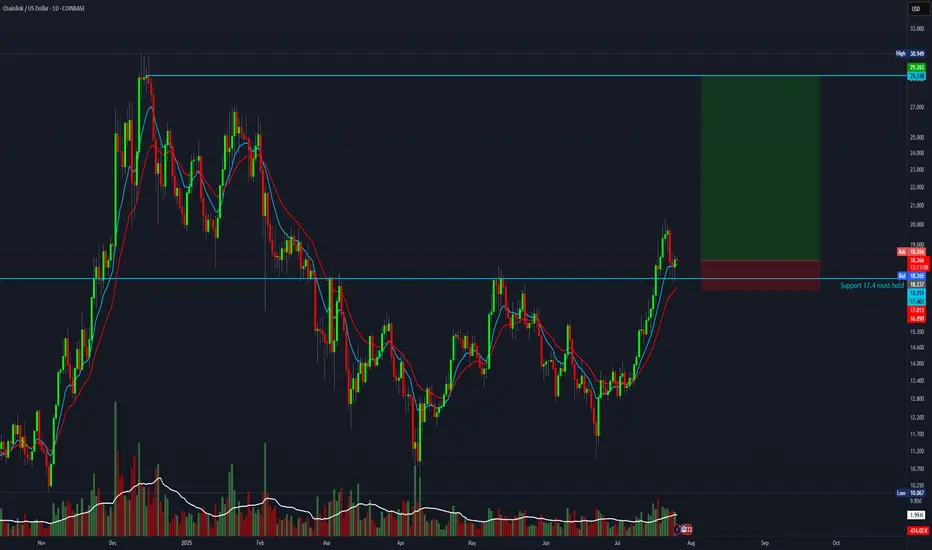
$Link/USDTLINK has taken on a strong upward trend on the daily timeframe and has the potential for solid growth. The EMA cross also confirms this trend. You can either wait for a pullback or consider entering a partial position at the current level

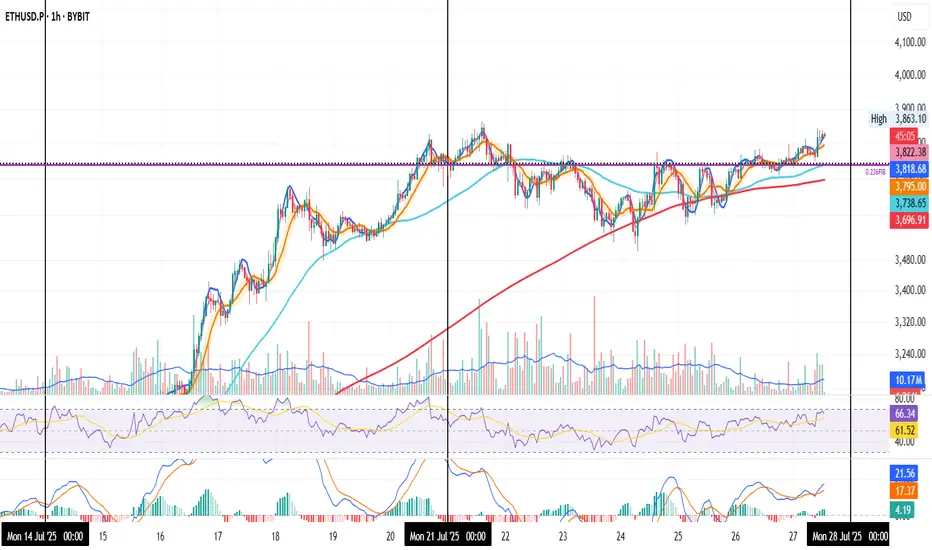
Closing the Week on ETH 1H
ETH is about to close the week just above the 0.236 Fib level.
The 50MA is crossing this key level, and the 200MA is close behind — showing alignment across moving averages.
MLR > SMA > BB Center confirms the current uptrend.
Volume is picking up slightly, though it’s Sunday — so expectations remain tempered.
RSI is nearing overbought but still has room to push higher.
MACD supports the bullish momentum.
Taken together, these signs lean bullish for the weekly close.
But this is crypto — and anything can happen in the final hours.
We’ll be here to watch it unfold.
Always take profits and manage risk.
Interaction is welcome.
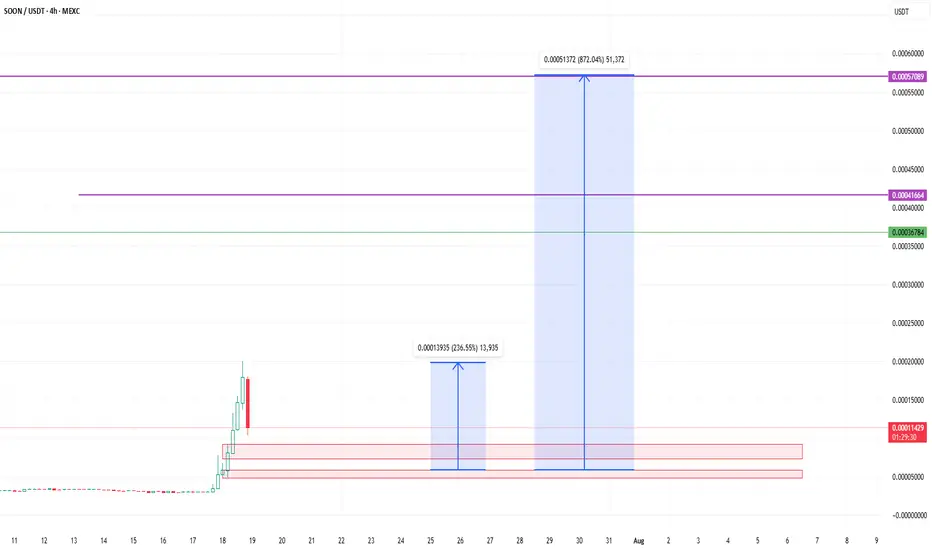
MR SOON GO TO THE MOON with huge commiunity and holder MR soon token is the Best meme for buy noow and a few wait foor a BIG pump so just buy and wait for pump and dont wory be happpy !
MR SOON GO TO THE MOON with huge commiunity and holder
now i am waiting for a very very very BIG PUMP my freind
8 R setup for ChainlinkBTC is about to flip upwards. This is the chance to take a high-reward trade with an 8:1 risk-to-reward ratio.
Entry: 18.23
Stop-loss: 16.8
Target: 29
Bitcoin Cash $2,615 Minimum · $4,178 Possible · Plan Ahead105 days. This is definitely the longest stretch of bullish action since 2021. Bitcoin Cash has been growing non-stop for 105 days.
If someone told you this would be the case some months ago or a few years back you wouldn't believe it. What if someone tells you now that you've seen nothing yet? What if I told you that the best is yet to come? This is only the build-up process. Bitcoin Cash is about to shoot up really strong. It will skew the chart. People won't be able to comprehend what is happening less adapt to the market. It will be chaos, bullish chaos.
Years of consolidation. Bitcoin Cash has been on a wide trading range since February 2024. We can easily say since mid-2023 if we consider using a wider range. This is all the build-up process for this moment now. The 2025 bull market. Predicted years ago, now it cannot be denied, it is right in your face.
Let's play the other side for entertainment's sake. Bitcoin Cash stops rising, either a lower high now or a reversal at the December or April 2024 high. What would happen then? A bear market? No! Just a down-wave, more consolidation before the final advance, price jump and market bull run.
Let's go back to reality for accuracy's sake. Bitcoin Cash will grow in bullish momentum and will break all resistance one next to the other, stops will be short. If there is a correction in-between the action, it won't be long.
Look back to the 2021 bullish wave, the fifth wave; notice three weeks red, two weeks red, one week red, etc., in-between the rising wave. Straight up but obviously, there are some stops. When we are in the experience, when it is happening, these weeks feel like forever and we never know if it will continue rising or if that's it, we reached the end. I am telling you now, it will not be over until a major new all-time high hits, and the levels are being shown now. When we are more advanced in the market cycle, I will not try to predict the short-term. Instead, I will tell you to secure profits and move on. Once prices are really high, close your position and start looking for the ones still trading low near support. Of course, writing this won't change anything, people will still be attracted to the action and mistakes will be the norm. Only if you bought early when prices were low, you will be able to withstand the market pressure. If you buy late, the market will kill you and take everything from you. This is a friendly reminder. Plan ahead.
Namaste.

Hedera 2025 All-Time High · Simple Analysis Bullish ConfirmedHedera is about to close five weeks green. Five weeks green and we only have a minor advance, relatively speaking. Some 100%. Back in late 2024 five weeks green resulted in more than 800% growth. Huge difference, but after the fifth week growth stopped. This time it will be different.
We already have five weeks of bullish action and this is only portion of the entire bullish period, just a small part. This can continue for months, then a stop and one final jump. Or this can start now and just keep on going until it peaks and that's it, nor more growth until the next bullish phase. So we would see a bear market after the completion of the bull market and the only bullish action would be corrections within the bear market. Right now market conditions are extremely bullish.
We have a long-term lower high. In early 2025 the action peaked below the 2021 all-time high. The wave that is developing now will break this barrier and produce a new all-time high. This is very easy to predict, market conditions are bullish.
The interesting part will be to see how far up Hedera will go. We can use this project, since it is definitely going to be one of the first to peak, to know how the rest of the market will perform. Easy we have between 200% and 400% potential for growth.
I hope you are being entertained and I really hope you enjoy the content. If you do, give me a follow @MasterAnanda
Namaste.

Ethena · Millions Overnight? It Can Be DoneEthena is starting its 2025 bullish cycle with three full green candles. The current week has the highest volume since the first week of trading in April 2024. Normally the first week of trading tends to produce the highest volume. ENAUSDT is matching those days now and market conditions are so much better in 2025 compared to 2024.
The entire bullish period last year lasted less than two months. That's it. This wasn't an uptrend nor a bull market, it was more like a bullish jump. A momentary event. ENAUSDT right now is entering the 2025/26 bull market. Growth can be sustained for a period of 6 months or longer. Sometimes a bull market trend can last 8 months, 12 months, or even 16 months or longer. We have many examples across the market.
This week Ethena is trading above EMA55 weekly for the first time ever. The bullish bias is confirmed.
When I saw this pair it was already moving, not the bottom catch that I like and go for and yet, I still went ahead on it because it is still early when you consider the bigger picture; practice what you preach.
We missed the bottom but it is still early, there is plenty of room available for growth. Trading is easy when the market is approached with the right mentality, with a simple working plan. Buy and hold. Watch how the market will take care of the rest.
Just deposit and continue to invest, as much as you can. Continue to add to each position you like and grow; let it grow. Check back every 3 weeks, every 1-2 months; watch your money grow. It is truly that simple. Timing is very important for this strategy and the best timing is now. Right now we are on the verge of a major advance, no need to wait. You can buy today and start earning within days.
A few months back, we had to wait for months. A few weeks back, we had to wait for weeks. Entering the market now, the wait is short but patience is key.
It will go higher than what is shown on the chart. This publication is to alert you of a great timing, be ready to wait. Make sure to do your own planning. The risk is minimum when trading spot. The worst case scenario is a long wait. If things go right; enter green, stay green and profits-capital grow.
Success can be achieved but the hard part is being around now, when prices are low. It is easy to be around when there is hype and everything is 1,000% up. But can you beat the impulse to sell when the right choice is to buy? Can you take action now and go ahead?
If you are reading this now, you are in the right track but for many people it is not that easy, they are allergic to low prices and they won't be reading this until it is too late. 90% of the people will only become aware of these opportunities that I am showing you daily when it is too late.
That's ok. We use the experience to learn. When I first started I went through the same process. The euphoria got my attention and when I became aware of the market everything was already high up. We tend to join at the market top. But then we go through the entire cycle, the market is here to stay. We get to buy the bottom, we gain experience and in the end we can always win if we never give up. Persistence and consistency, be ready to hold.
If you can hold your altcoins when prices are low, you will reap the rewards at the time of the bull run. Millions to be made overnight. Years of preparation, but it can be done.
Namaste.

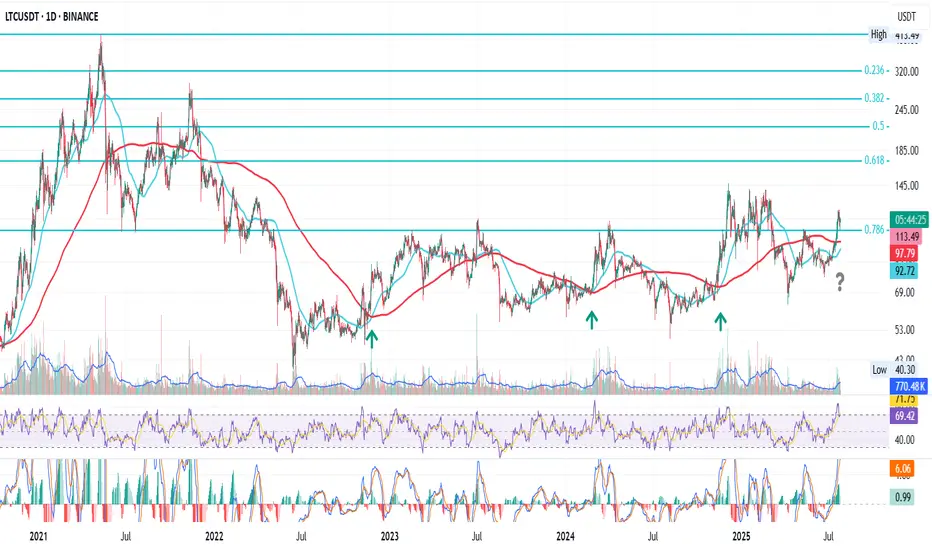
LTC Prepares to Break the CycleThis is LTC on the daily
After the bear market bottom in June 2022, LTC had three golden crosses, each followed by a rally into the 0.786 Fib level.
To be fair, last time price broke above that resistance, but got pushed back — like everything else — by the macro storms earlier this year.
Now we’re approaching another golden cross, but the setup feels different:
1. Price is already holding above 0.786, at least for now.
2. Macro looks calmer, with crypto gaining favorable attention from the SEC, and rate cuts becoming a matter of when, not if.
Putting these together, I lean bullish on LTC price action going forward.
Whatever happens next — we’ll be here to watch it unfold.
Always take profits and manage risk.
Interaction is welcome.
MKR ANALYSIS🔮 #MKR Analysis
🌟🚀 As we said earlier #MKR moved around 48%. Right now #MKR is trading in an Ascending Triangle Pattern and here we can see that #MKR moving again towards its neckline. We see see more bullish move in upcoming days
🔖 Current Price: $2260
⏳ Target Price: $2664
⁉️ What to do?
- We have marked crucial levels in the chart . We can trade according to the chart and make some profits. 🚀
#MKR #Cryptocurrency #Breakout #DYOR

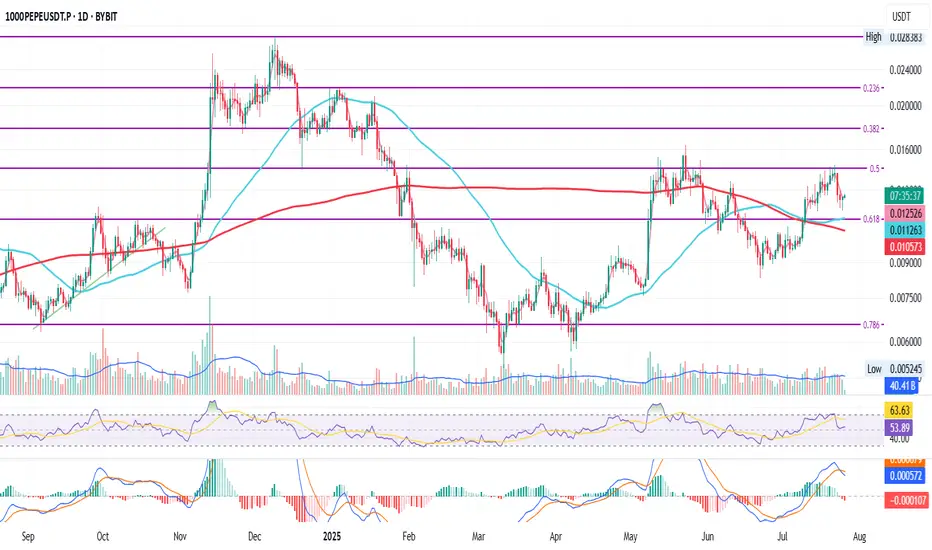
PEPE Daily Setup Holding Strong
This is PEPE on the daily
Price recently crossed above the 50MA which is currently resting on the 200MA after a golden cross
It was rejected at the 0.5 Fib but is now holding above the 0.618 Fib as well as the 50MA and 200MA
RSI is finding support at the mid level while MACD just turned bearish
Chances are we see a pullback first, a search for support, before the next possible move up
We’ll be here to watch it unfold
Always take profits and manage risk.
Interaction is welcome.
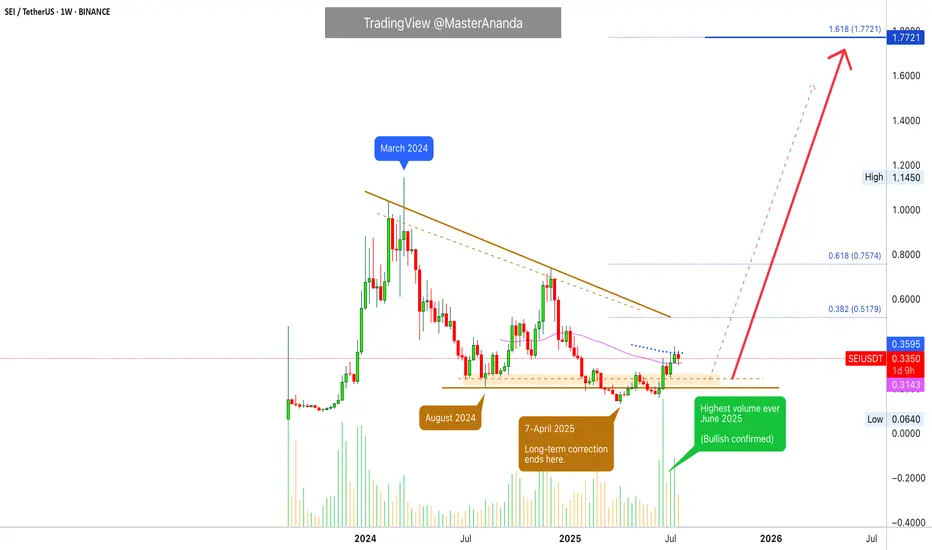
Sei · Technical Analysis · Beyond Trading —The Soul in the ChartThis is a nice chart. It is well structured. It is also basic and standard. You can know where a project is at based on the drawings (patterns) on the chart. When you look at hundreds of charts, for years, you can see the signature of the trading bots on each chart. Each exchange has a different set of algorithms doing the trading. It is fascinating to say the least. Once you learn their language and understand their behaviour, you can time the market and predict market moves. I've seen the same patterns, actions and reactions repeating thousands of times, over and over, again and again. This is good, it helps us predict the market.
Even if humans are the ones doing most of the trading, their habits and customs will show up on the chart. These will appear as different sequences, fractals and patterns. People act based on instincts, emotions, impulses and intuitions. These come based on the weather, the environment, our relations, physical chemistry and the effect of the astros on our bodies and minds. If we can put all these things together we can time the market. Doing it consciously sounds (feels/looks) like a very hard task but most of it is done subconsciously, like driving. You learn to perform the craft consciously but once you have practice and engage in it then it comes out naturally; you don't have to think about changing gears or pressing on the gas, you just do it; like riding a bike. That's technical analysis for you, that's trading. It can be approached in the same way. If you engage the market long enough, with an open mind always ready to adapt and accept new input, eventually you move with the market and this movement will tend to be the right choice when it comes to making a decision.
This or that? Your intuition is when solutions and answers come forth from a vast array of subconscious material. So we read, we trade and we participate and our minds take care of the rest. The way to organize all this subconscious information and make it useful—and available to the conscious mind—is through meditation.
I am going to go with the volume signal. The highest volume ever happened in June after a higher low. The main low from the March 2024 high happened in 2025-April, the market bottom. There was a low in August 2024 and this becomes an important level. When the action moved below, it activates signals for buyers; when the action moves back above, we are in the bullish zone. Current price action confirms this, SEIUSDT is long-time bullish now. Rising for months but momentum is yet to show. This is only the start.
The action is happening above EMA55 below EMA89. Support and resistance.
Considering the bigger picture and the overall growth potential we can say the market is still trading at the bottom. I am using the linear chart to make this clear.
After the highest volume ever the market cannot start dropping. After more than a year of bearish action, between March 2024 and April 2025, seeing a full green candle with the highest volume ever after a higher low means that the bulls are in. Coming from a technical analysis perspective, this means that the bullish bias is confirmed.
The break and close above EMA55 weekly gives this signal additional strength, and what is happening across the altcoins market; every single day several pairs are growing more than 100%, in just one day; reveals what the future holds.
This is not speculation. This is not my speculative opinion. This is a translation of actual price data, which is the action the market participants are taking, that says we are going up.
It is not "I" that is saying "we are going up." It is the chart, the market, the data. It is inevitable, it is already confirmed based on the information that I've been showing you month after month after month.
It is not predicting the future. It is simply pointing out the logical conclusion of a series of events. If someone has an idea to build a house and from this idea starts to work; accumulate the necessary money, hire an engineer and take all the necessary steps to build a house, you can easily say, if you have access to this information, that a house will be built at some point. You don't have to be genius to do it, but you know this person has been putting the money and effort, has been taking all the steps that are necessary to get it done. Knowing this, you can say with a high level of certainty that it will be done, based on the data of course. Crypto is going up. Only a Black Swan event can stop this, and you can't predict those. So we go with what is possible and what we know. Just watch!
Thanks a lot for your continued support.
It might be hard to be 100% right or predict minor swings and changes short-term, but when it comes to the bigger picture? It is impossible to miss.
Thank you for reading.
Namaste.
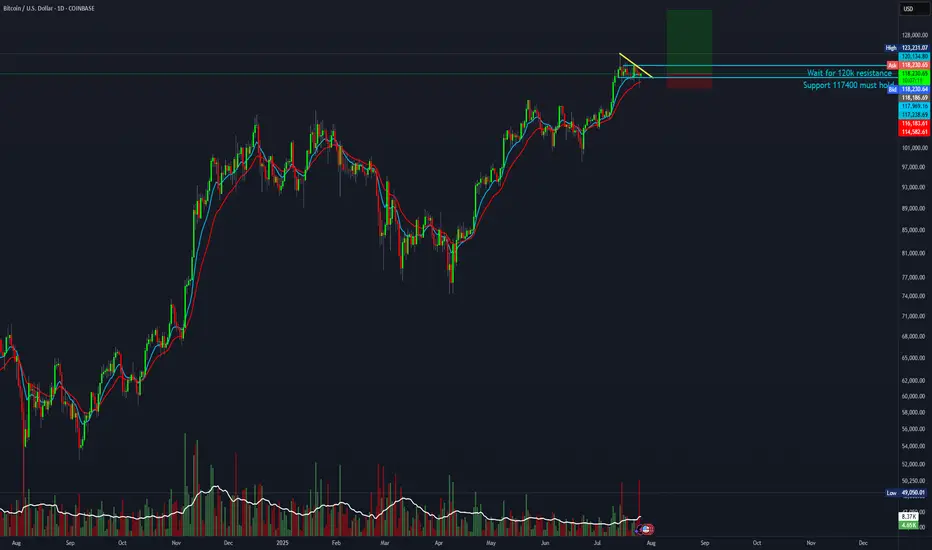
4:1 R:R for BTCBulls are likely to send it higher before the 120K breakout. This early setup is worth a try.
Entry: 118,200
Stop-loss: 115,000
Target: 135,000
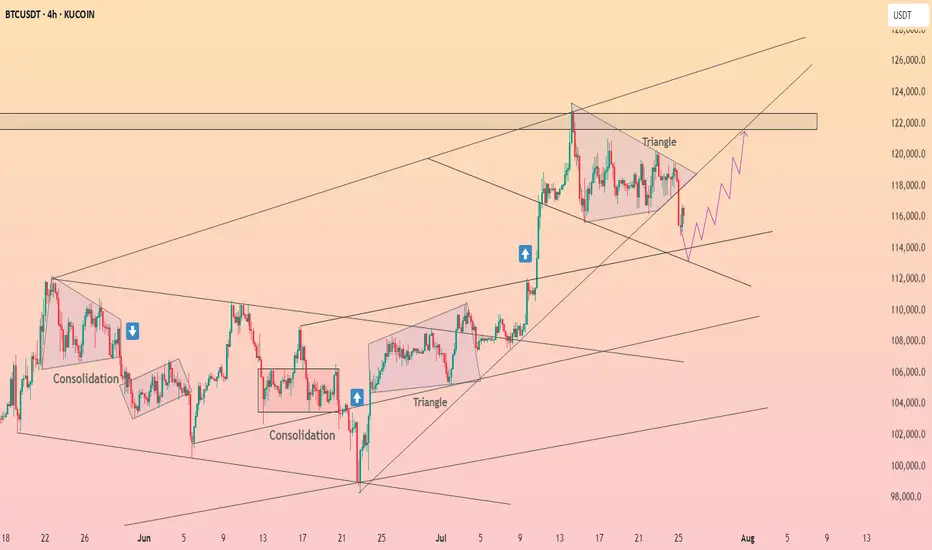
BTC - Trap, Tap, and Blast Off!BTC has been overall bullish, trading within the rising blue channel (1). After reaching a local high, it entered a short-term correction, forming a falling red channel (2).
👀All eyes are now on the key demand zone (3), which aligns with the lower bound of both the red channel and the rising blue structure.
🔎As long as this confluence holds, we anticipate a potential bullish impulse in August.
A retest of the $111,500–$112,000 zone could serve as the trigger for the next leg toward $128,000. Let’s see if BTC is gearing up for another breakout or if a deeper correction is in play.
🔔 Disclaimer: This analysis is for educational and informational purposes only. It does not constitute financial advice or a recommendation to buy or sell any asset. Always do your own research and manage your risk accordingly.
📚 Always follow your trading plan => including entry, risk management, and trade execution.
Good luck!
All strategies are good, if managed properly.
~ Richard Nasr

BTC setup looks good for 5R.Looks like BTC is about to make another leg up toward 135K. Playing a 5:1 R:R on this setup
Entry: 119,000
Stop Loss: 116,000
Target: 135,000

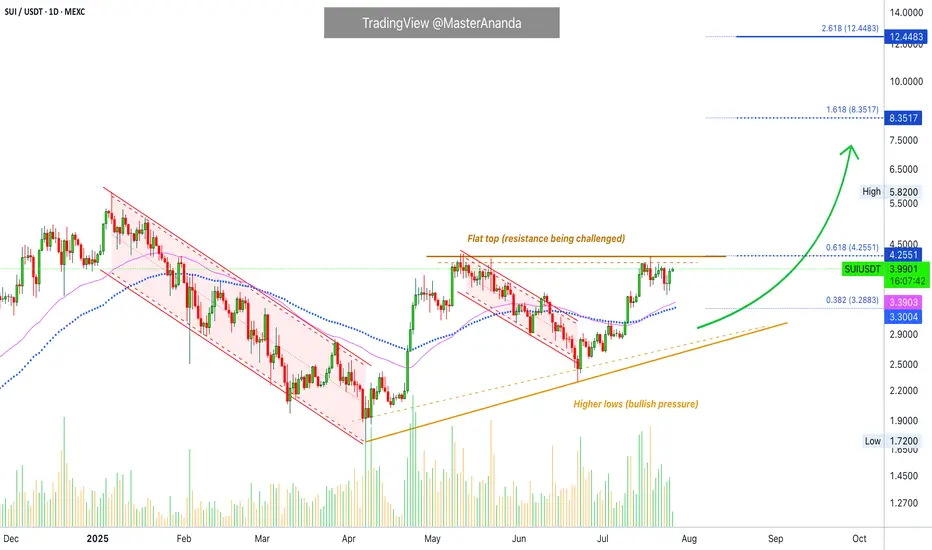
Sui Works To Break Resistance · Play To Win · No StressA flat bottom is bullish because support can be confirmed as found when sellers (bears) fail to move prices past a certain point. A flat bottom produces the double-bottom and triple-bottom reversal signals. When the bottom is flat, depending on the phase the market is going through, we can easily say bullish. A flat top is not bearish, it is a completely different story.
A flat top does not confirm resistance being found and thus a new bearish wave. We need context, it all depends on the phase of the market cycle. A flat top with a rising bottom is bullish. Resistance has been found and is being challenged. It is getting weaker because the action is converging towards the resistance point based on the rising bottom.
Here we have a flat top with a rising bottom (higher lows). The market is bullish. SUIUSDT has been bullish and growing since late 2024. This is the content we need. A bullish tendency, a rising market and resistance being challenged more than once starts to reveal a picture. Next this resistance won't have enough strength to hold. Next time SUI moves up it will continue rising to produce a new all-time high and this will unleash a price discovery phase.
SUIUSDT is trading above EMA55 and EMA89. The last challenge of resistance produced a rejection but this rejection did not lead to a test of the above mentioned support. Another signal of strength.
Sellers cannot push prices lower because buyers are active, or simply put, there are not enough sellers to start and thus the retraces become smaller and shorter. Price dynamics favoring the bulls.
The lows are getting higher, the top remains the same. When the low meets the top that is when resistance breaks. Sui is going up, it will continue to grow; the targets on the chart can be hit short-term.
There is no sense of urgency, but a major advance can be happening within days.
Are you ready to trade and hold? Prices going up aiming high trading requires no effort.
The effort is mental, the mind can be trained to succeed and avoid stress. Mental stress = lack of knowledge. If you know prices are going up and you feel certain about it, no effort is required to win because the mind doesn't have to struggle with questions relating to the strength of your position. The mind does not need to answer, should I buy or should I hold? Since you know prices are going up based on the chart, you can sit back and relax watching your profits grow. Reading relaxes the mind. Knowledge is food for the soul. The more you learn, the more you know the wiser you become. Wise means effortless. Trading can be effortless if you read the right stuff. Play to win. Plan before trading and you already won.
Answer the question before the situation shows up. That's it, you've just removed the complexity out of the game. When there is no complexity, there is no mental stress. Since you are sitting on a chair in front of a device, trading becomes effortless. To trade with peace in your mind you just need the right knowledge and that is what you are getting here. No stress.
Continue reading and watch your profits grow. Increase your peace, free up your time and enjoy better results.
Namaste.
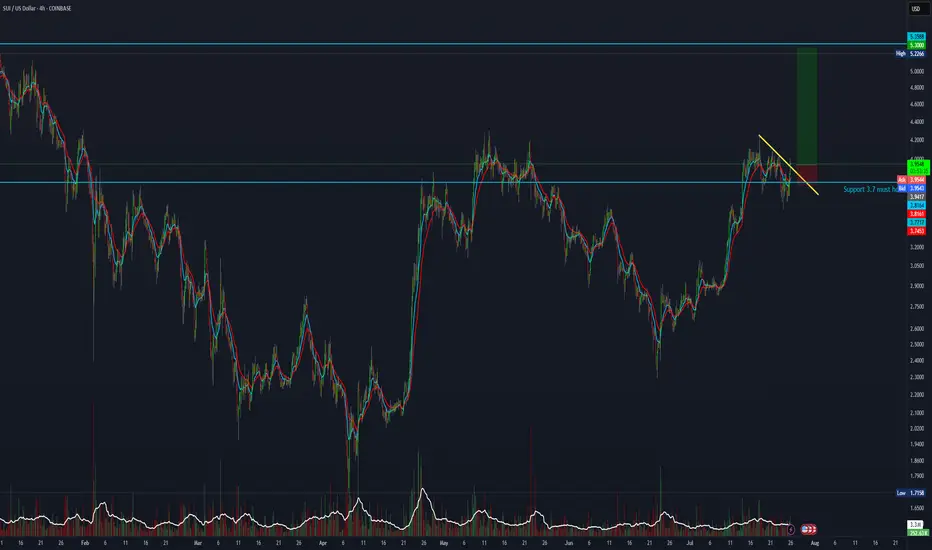
6:1 R:R trade setup for SUIAnother attempt at a 6:1 R:R setup with a target at the all-time high of 5.3.
Entry: 3.9417
Stop Loss: 3.745
Target: 5.3
REI/USDT CYCLE UPDATE $0,90 by 2025 - Price prediction📈 REI/USDT CYCLE UPDATE – $0.90 by 2025
REI could break above its old ATH, targeting $0.90 in the upcoming cycle. Why?
Upcoming
✅ Ultra-fast blockchain (⏱️ 1.5s block time)
✅ Gas-free or near-zero fees – perfect for DeFi, NFTs & gaming
✅ EVM-compatible – easy migration for Ethereum dApps
✅ Low market cap → high upside potential
✅ Clean tokenomics with staking + resource model
✅ Built for speed, scale & adoption
DATA
Data shows that there is a structural trend going on, where this coin can break soon.
If the altcoin market heats up, REI has the fundamentals & tech edge to explode past previous highs. 🚀
🧠 Watch this one closely.
#REINetwork #Crypto #Altseason #EVM #PricePrediction #Web3
This is not trading advice, but a view from a side of study.

The End of the Altcoins Bull Market? BTC.D Turns Bullish?Bitcoin Dominance produced a bullish trend that was more than 1,000 days long. While this was a major development, the action never happened just straight up. There were always fluctuations.
Bitcoin Dominance broke out of a major rising wedge pattern. A pattern that lasted years in the making.
Recently, Bitcoin Dominance produced the highest bearish volume since 2021. A strong chart signal.
The major breakdown following the multiple years long uptrend signals the start of a change of trend. A downtrend. This downtrend is extremely bullish for the altcoins market because BTC.D only goes down when the altcoins are going up and doing so faster than Bitcoin.
What we are seeing now is an inverted correction, a pullback. Simply put, BTC.D already made a strong drop and it needs some relief. This relief is not the end. Bitcoin Dominance can move just a little higher to later resume its newly developing downtrend. Which means that the altcoins market bull market has not reached its end, it is only getting started.
Thank you for reading.
Namaste.

LINK Swing Trade – Watching for a PullbackLINK has rallied 58% since June 24th and is now consolidating after making a higher high. Price action is facing resistance and looks overheated, so a pullback toward support could offer a fresh long entry.
📌 Trade Plan:
• Entry Zone: $15.00 – $16.00 (on pullback)
• Take Profit Levels:
o 🥇 $20
o 🥈 $25
o 🥉 $30
• Stop Loss: Close below $13

XRPUSD - Target reached. Reversal on the plateSo, that was a nice long trade.
Now price is stretched at the Upper Medianline Parallel (U-MLH).
As of the time of writing, I already see price pulling back into the Fork. A open and close within the Fork would indicate a potential push to the south.
Target would be the Centerline, as it is the level where natural Meanreversion is.
Observation Hat ON! §8-)

Bitcoin is correcting ┆ HolderStatBINANCE:BTCUSDT compresses inside a triangle between $132K and $137K. Breakout above $137K could initiate a run toward $143K. Breakdown exposes $132K. Watch for decisive move.
Ethereum will retest the $3,500 level ┆ HolderStatOKX:ETHUSDT is trending upward with $3,100 as the next resistance. Breakout aims for $3,250. $2,875 remains critical support. Bullish momentum intact.