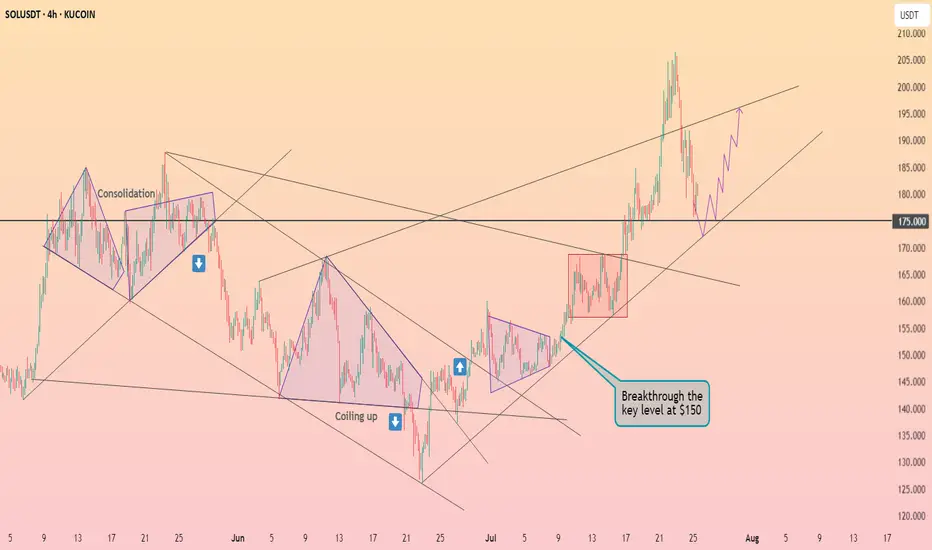
Solana is bouncing back from $175 ┆ HolderStatOKX:SOLUSDT is testing the $180 barrier. Breakout could extend gains to $186. If rejected, $172–$173 may act as reentry zone. Market structure favors continuation.
Crypto
Now We WaitTrading Fam,
In my last video, I mentioned how I had been learning to trade more patiently, giving myself those high-quality, high-probability winning trades. This is a perfect time to illustrate that strategy.
With our altcoin market overheated, I am expecting more rest, accumulation, and pullback in many of our alts. The selection of even decent entries is very slim. It's time for us to sit back, wait, and let the trades come to us again.
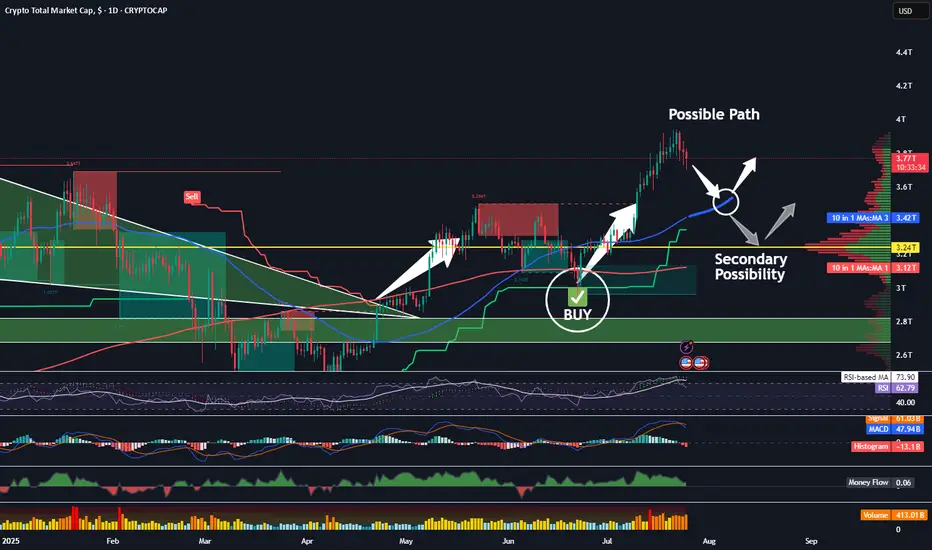
The TOTAL chart shows us more clearly what may occur. Let's discuss a few important indicators on this chart.
First of all, we see my indicator popped a BUY signal right around 3T. We had a safe bet at that point; we were going to see quite a bit of buying action in the altcoin space. Indeed, we did. The altcoin market increased by about 25 percent and went all the way to 4T, at which point the sellers came back in. Now, we are in the middle of a little bit of a pullback, and I think there could be more to come. I am expecting at least a touch of that rising 50-day SMA, currently at 3.4T.
Supporting my thesis here are the crossover of the RSI to the downside of its 14-day MA, the MACD cross, the Chalkin money flow decrease, and the HMV indicating high volume during these sell-offs. Leverage is being liquidated. This is healthy!
It is possible that the total market cap could drop even further, all the way down to that 3.24T PoC on the VRVP. That is where we see most of our volume in alts has occurred. Keep these two targets in mind. Once hit, I will begin looking for more trade entries once again.
✌️Stew
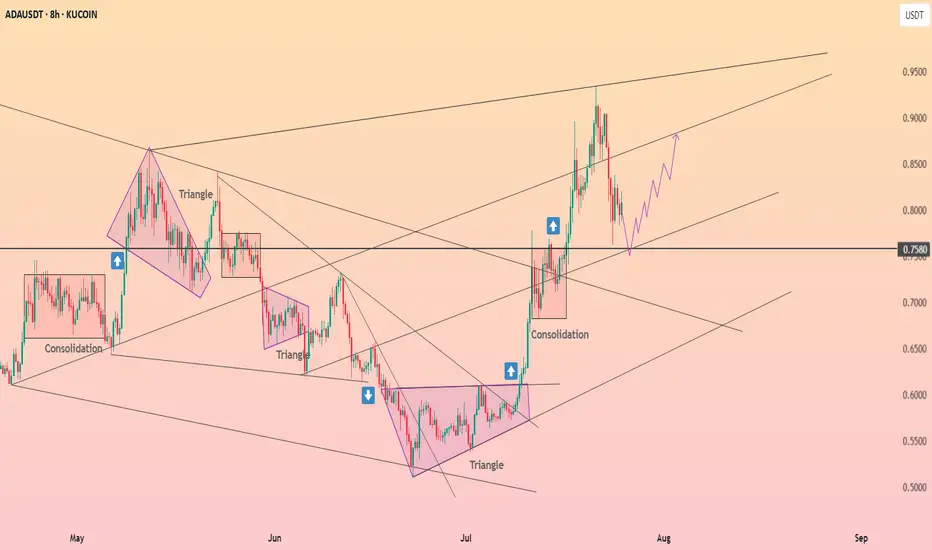
Cardano held above $0.76 ┆ HolderStatBINANCE:ADAUSDT is compressing under $0.44 with support from $0.418. Breakout from wedge structure may target $0.462. If $0.418 breaks, downside risk opens to $0.40. Watch for volatility.
ETH on the 1H
After rejecting the 0.236 Fib level, price found support at the 200MA.
RSI cooled off slightly, giving room for another move before hitting overbought.
MACD just flipped bullish, pushing price higher.
MLR > SMA > BB Center — structure confirms upward momentum.
Now price is back at the Fib level.
It looks fresher than yesterday, but needs clean closes above to build traction for a real breakout.
We’ll be here watching.
Always take profits and manage risk.
Interaction is welcome.

TOTAL CRYPTO MARKET CAP expected to hit $6 Trillion!The Crypto Total Market Cap (TOTAL) has been on a Channel Up since the 2022 market bottom and since the April 07 2025 Low (Higher Low for the pattern), it's initiated the new Bullish Leg, already turning the 1W MA50 (blue trend-line) into Support.
As long as this holds, we expect it to complete a +270% rise from the August 05 2024 Low, similar to the Bull Cycle's first Green Phase, and reach at least a $6 Trillion Market Cap!
More importantly, we expect this final part (blue ellipse) to be what is commonly known as an Altseason, where the lower cap coins show much higher returns and disproportionate gains to e.g. Bitcoin.
-------------------------------------------------------------------------------
** Please LIKE 👍, FOLLOW ✅, SHARE 🙌 and COMMENT ✍ if you enjoy this idea! Also share your ideas and charts in the comments section below! This is best way to keep it relevant, support us, keep the content here free and allow the idea to reach as many people as possible. **
-------------------------------------------------------------------------------
💸💸💸💸💸💸
👇 👇 👇 👇 👇 👇

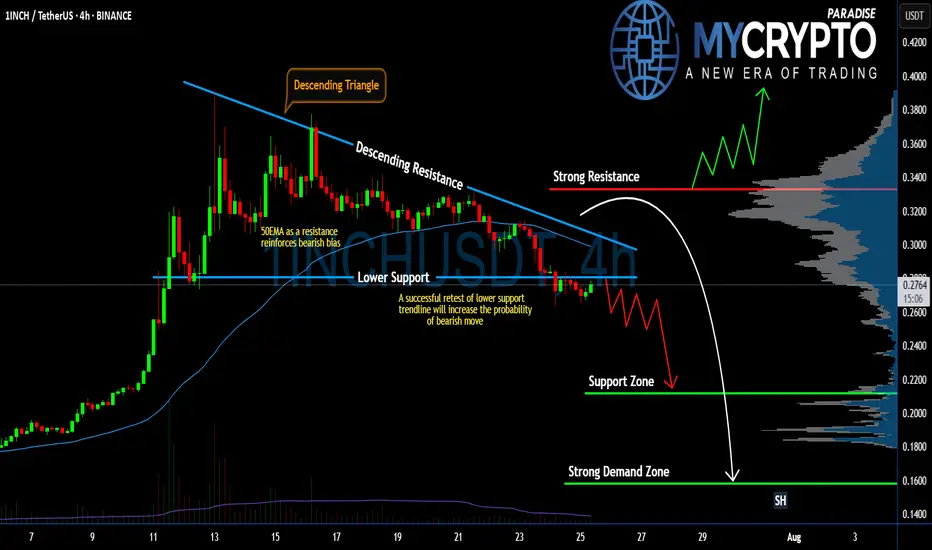
#1INCH Setup Favors Bears | Can Bears Pull it Down Further? Yello Paradisers! Are you prepared for what might be the next big move on #1INCHUSDT? The #1INCHNetwork is flashing clear warning signs:
💎#1INCH is currently trading inside a Descending Triangle, a pattern that historically favors bears. The price has broken down the lower support and is coming to retest it. If #INCHUSD retests the lower support and doesn't enter the descending triangle, the probability of the bearish pressure will increase.
💎The 50 EMA is acting as a strong dynamic resistance, reinforcing the bearish bias. Every attempt to reclaim higher levels has been rejected, and as long as we remain capped below the descending resistance, bulls are at a clear disadvantage.
💎A successful retest of the lower support trendline will significantly increase the probability of a breakdown. If this triangle finally breaks to the downside, we should be watching the $0.2116 support zone as the first key level to catch any temporary reaction.
💎But the real danger — and opportunity for patient traders — lies lower. If $0.2116 fails, the next strong demand zone sits at $0.1582, which could be the level where real buyers finally step back in. Until then, any bullish scenario remains invalid unless the price breaks and closes above the strong resistance at $0.3332.
Trade smart, Paradisers. This setup will reward only the disciplined.
MyCryptoParadise
iFeel the success🌴
Bearish retest or deviation for Bitcoin117000 is key. it’ll decide whether this is a bearish retest or just a deviation. i believe it’s a bearish retest and we’re setting up for 110-114 next.
last drop came when price kept failing to hold above EQ. now we’re below the EQ of the ath/previous ath range. if price can’t reclaim that either, a deeper drop is likely. a 12h close above EQ could open the path toward 120-121k, but that’s the less probable case in my view.
why? nasdaq and spx are in premium zones (fib extensions), and holidays are near for big players. as profit taking hits there, pressure will echo here. simple cause, predictable effect.

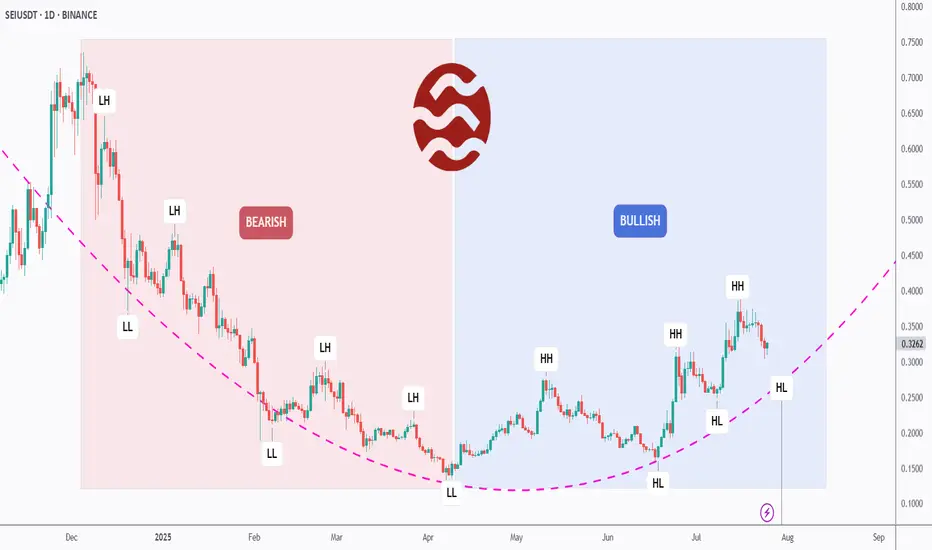
[Deep Dive] SEI – Edition 2: From Pain to Power: A Bull Cycle?SEIUSDT may have just flipped the script.
After months of consistent lower highs and lower lows, SEI has officially broken its bearish structure and is now printing clear higher highs (HH) and higher lows (HL) — a textbook sign of a trend reversal.
📉 Left Side: Bearish Breakdown
From late 2023 to Q2 2025, SEI was stuck in a painful macro downtrend. The structure was brutally clean: LH → LL → LH → LL. Each bounce was weaker than the last, reflecting exhausted buyers and relentless supply.
But something changed in late Q2…
📈 Right Side: Bullish Rebuild
Since its final low around April, SEI began to carve a new path. What started as a subtle accumulation quickly morphed into a solid structure of higher highs and higher lows.
The arc-shaped pink trendline tracks this momentum shift — and we’re now watching a potential continuation of the bullish cycle.
The most recent HL is forming exactly on that curve — a critical moment where bulls may step in for the next impulsive move.
🔥 What’s Fueling the Shift?
SEI is gaining traction as a high-performance Layer 1 designed for trading apps, with native parallelization and a focus on speed and throughput.
Its recent ecosystem growth — including projects in DeFi, gaming, and infrastructure — has started to attract both retail and VC attention.
On-chain metrics are showing increased activity, and whispers of upcoming protocol incentives could be the spark that pushes SEI toward the $0.45–$0.50 range.
🧠 What We’re Watching
- The current HL zone — will bulls defend this level?
- If SEI can break above the previous HH, the bullish structure strengthens.
- A failure to hold this HL would suggest a range or even deeper correction — so risk management is key.
Let’s recap:
- Structure has flipped bullish ✅
- SEI is riding a fresh higher low ✅
- Fundamental momentum is building behind the scenes ✅
It’s now up to the market to decide if this was just a bounce — or the beginning of a much bigger move.
💬 What do YOU think: Is SEI building steam for a breakout, or just teasing us with a fakeout?
🔔 Disclaimer: This analysis is for educational and informational purposes only. It does not constitute financial advice or a recommendation to buy or sell any asset. Always do your own research and manage your risk accordingly.
📚 Always follow your trading plan => including entry, risk management, and trade execution.
Good luck!
All strategies are good, if managed properly.
~ Richard Nasr
BITCOIN (BTCUSD): Recovery Starts
Bitcoin is going to rise from a key daily support.
After a liquidity grab, the market shows a clear strength,
forming a double bottom on an hourly time frame.
I expect a bullish movement at least to 117100
❤️Please, support my work with like, thank you!❤️
I am part of Trade Nation's Influencer program and receive a monthly fee for using their TradingView charts in my analysis.

Bitcoin & 150k TOPBitcoin has been trading within a rising channel for a long time, with resistance at $150,000. The middle support/resistance line also indicates $150,000, suggesting a potential significant rejection at this level.

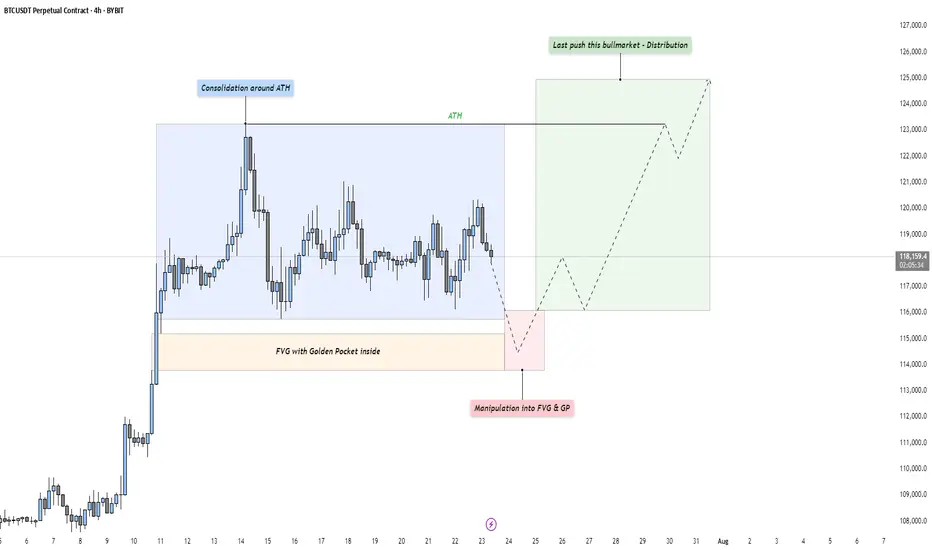
BTC - Last Push: Consolidation, Manipulation & DistributionMarket Context
After a strong upward impulse, Bitcoin has entered a mid-term consolidation phase just below its all-time high. This kind of price action is typical as the market digests recent gains and larger participants prepare for the next move. These pauses in momentum often precede either trend continuation or a reversal — and the structure here suggests we might be witnessing the former, but not without a final shakeout.
Phase 1: Consolidation Around the All-Time High
The first phase is defined by a tight range just beneath the all-time high, where price moves sideways in a balanced struggle between buyers and sellers. This is often where retail participants become overly bullish, anticipating a breakout. However, the lack of a sustained move higher indicates that smart money may be waiting for better entries — or preparing to engineer liquidity to fuel the next move.
Phase 2: Manipulation Into the Fair Value Gap and Golden Pocket
Directly below the range lies a clean Fair Value Gap, with a Golden Pocket retracement nestled inside it. This zone represents a strong area of interest. A sharp move into this area would likely sweep late long positions and trigger stop-losses from range traders — a classic manipulation pattern. This phase serves two purposes: collect liquidity and offer favorable pricing for larger players looking to position themselves before expansion. Watch for signs of absorption or reversal as price enters this zone.
Phase 3: Expansion – The Last Push of the Bull Market?
Following the liquidity sweep and reaction from the Fair Value Gap and Golden Pocket zone, we could see a renewed expansion toward higher highs. This is the phase where volume returns, sentiment shifts, and price accelerates. If this plays out, it could mark the final leg of this bull cycle — potentially driving Bitcoin to new all-time highs with strength.
Execution Thoughts
If you're looking to participate, it's wise to wait for a confirmation signal on a lower timeframe — like the 5-minute or 15-minute chart — once price enters the Fair Value Gap and Golden Pocket zone. Watch for a strong bullish reaction, break of structure, or shift in order flow to signal that buyers are stepping back in.
Final Thoughts
Let the market come to your level and don’t chase moves without context. These three phases — consolidation, manipulation, and expansion — are timeless patterns seen across all markets. Stay patient, stay objective, and react with clarity.
If this breakdown helped you see the setup more clearly, a like would mean a lot — and I’d love to hear your thoughts in the comments! Are you watching the same zone, or do you see something different?
MARA: shoulders done, now walk toward the targetOn the daily chart, MARA completed a textbook inverse Head & Shoulders reversal with a clear breakout above the descending trendline. A corrective pullback followed, and the price is now heading into the key buy zone at 15.21–15.77 - aligning with the 0.72 and 0.79 Fibonacci retracements, and the upper boundary of the broken channel. This is the area to watch for a potential continuation of the bullish impulse.
Volume on the breakout was above average, confirming strong buyer interest. The EMAs are trending below the price, supporting the upward structure. The first target is located at 21.57 (previous resistance), with a potential extension to 28.77 (Fibonacci 1.618).
Fundamentally, MARA remains highly correlated with BTC and crypto sentiment. As interest returns to crypto-related assets due to ETF flows and possible Fed easing, mining stocks like MARA gain attention. Recent reports also show improved production efficiency and lowered costs - a tailwind for bulls.
Tactically, the best setup would be a confirmed reaction from the buy zone — whether a strong candlestick formation, volume surge, or reclaim of a key level. If that happens, aiming for 21.57 and 28.77 becomes a solid plan.
The pattern played out - now it's time for the market to walk the talk.

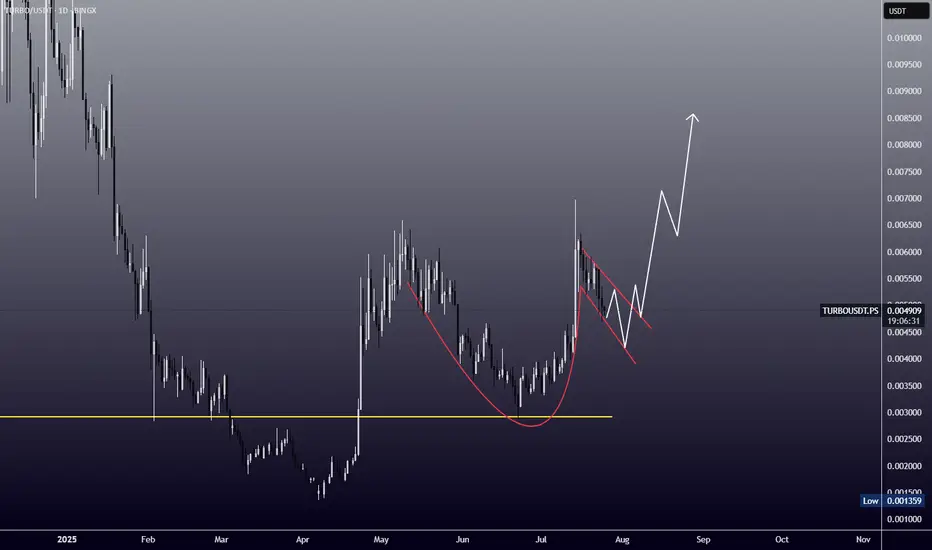
Cup and handle on TOSHIEvery time I look at the TURBO chart I can't help but see this cup and handle formation.
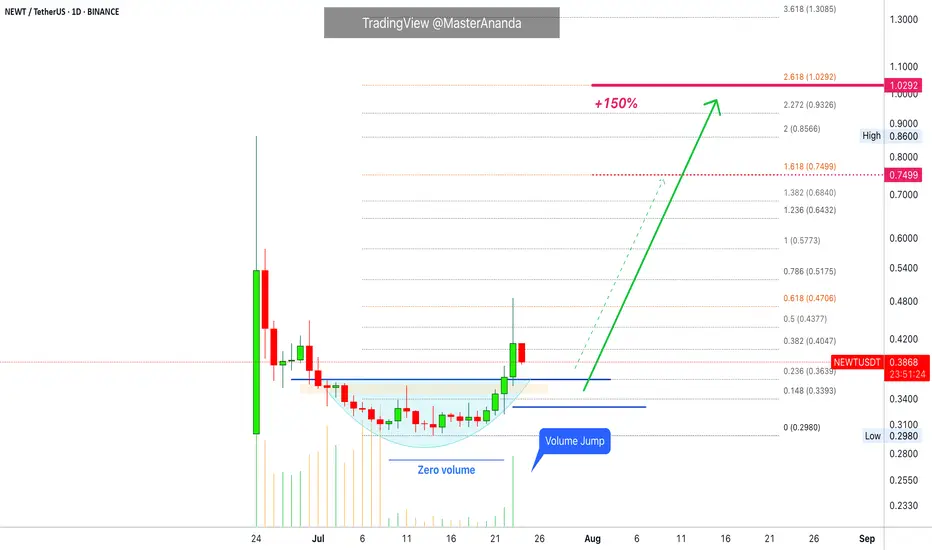
Newton Protocol · Volume Signal · 150% PP Short-TermI will show you now a successful choice on a volume signal as we look at Newton Protocol (NEWTUSDT) on the daily timeframe.
Notice how trading volume is flat while NEWTUSDT is producing a rounded bottom with the daily candles. It reads "zero volume" on the chart.
Now notice the strong "volume jump" today, 23-July, as soon as the action moves outside the rounded bottom, also a Fib. extension resistance. The strong jump confirms the start of a bullish advance. Our short-term target gives us 150% profits potential.
I will end this series soon and go back to our usual schedule.
These charts show the altcoins market being full of opportunities at this point in time. There is something for all types of market participants, active or passive traders. Risk lovers or risk averse. We are only getting started.
Your support is appreciated and all feedback is welcome.
Do you enjoy short-term trades?
Did you know, you can hold these pairs long-term once the bullish trend develops. Selling for profits is only optional, the market is set to grow until late 2025 or maybe into Q1 2026 or beyond.
The things that are happening worldwide in relation to Crypto are a first in the history of humanity. It is the first time that money is free from a tiny controlling monopoly. It is the first time in our history that you can create your own money. Decentralized finance. No middle men. The greatest financial and technological development in our history.
Namaste.
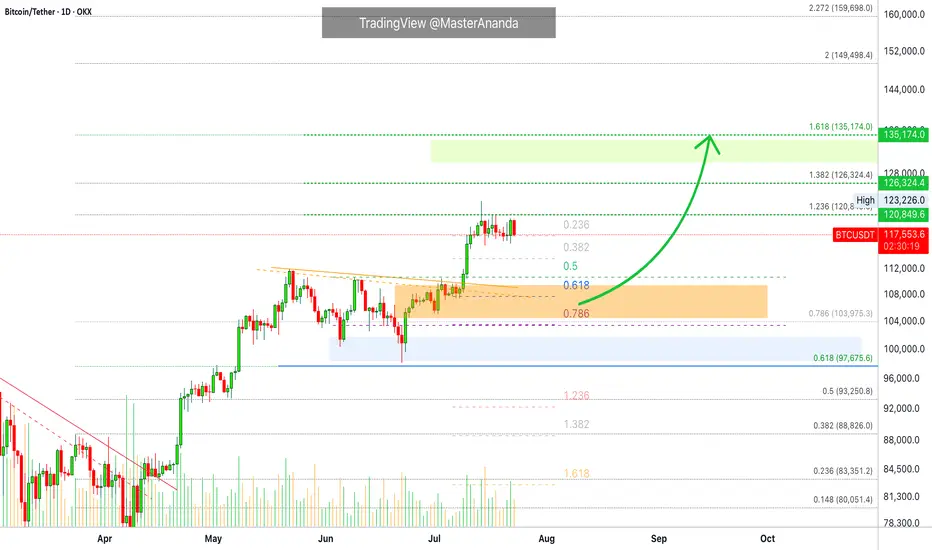
What's The Lowest Bitcoin Can Go? (Top Altcoins Choice —Comment)Bitcoin just hit a new all-time high recently and is consolidating just below resistance. I have a question: How far down can Bitcoin go on a sudden retrace?
That's a great question. Assuming that Bitcoin will continue growing mid-term and long-term, we can expect some more consolidation before higher prices. A retrace is not mandatory but is possible. A correction is almost impossible; low probability; not likely.
The worst case scenario Bitcoin does go down and the action should stop right at the previous high. Resistance turned support. That is, $112,000 to $110,000 would the first and main support range. Harder for Bitcoin to move much lower but these levels are not active yet.
If Bitcoin were to produce an extreme shakeout before additional growth, I would say the worst possible would be a touch of $104,000, but this is still a low probability setup. The chances are that Bitcoin will continue sideways while the altcoins grow. The fact that the altcoins are bullish means that Bitcoin will resume growing in due time. The next major move is another advance exceeding $130,000. It can happen within weeks or next month.
Patience is key on Bitcoin, the altcoins need to catch up.
Sometimes, Bitcoin can go sideways for months wile the altcoins grow. Prepare to wait or switch yourself to some mid-sized and small-cap altcoins. The big pairs tend to move like Bitcoin. Each chart needs to be considered individually.
Thanks a lot for your support.
Feel free to leave a comment with your favorite altcoin for an update. I will do an analysis for you in the comments section below.
Namaste.
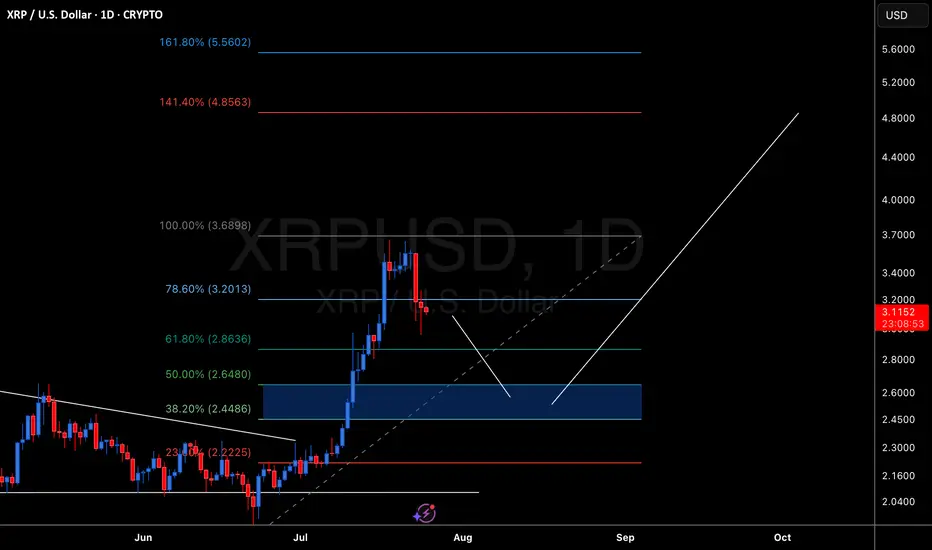
XRP Temporary Pull Back Followed Bu Move Up To $4.00XRP Created a new high. Looking for a pull back to the 50% retracement level. Followed by a move up to the 141 fib level of around $4.00
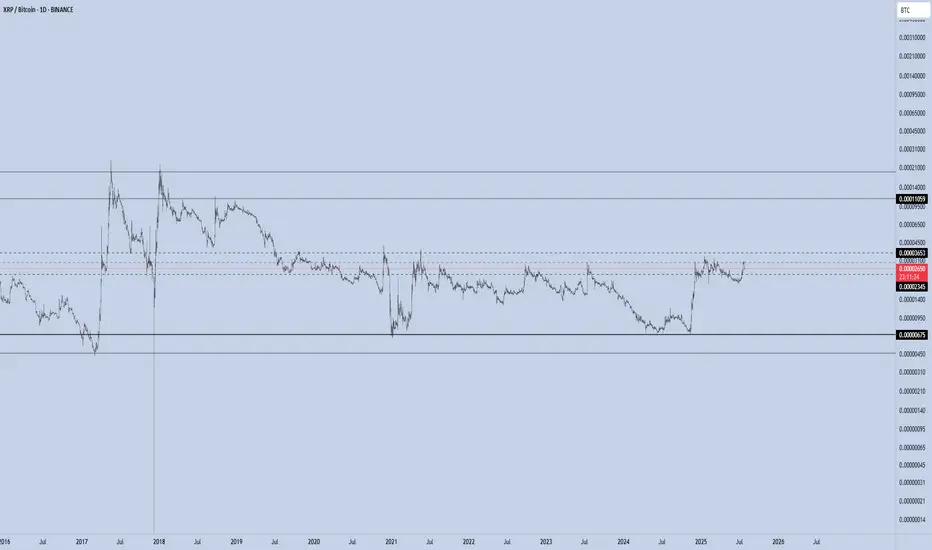
XRP/BTC – Channel Midline in Play The XRP/BTC pair trade inside a multi-year channel, with price currently testing the midline of this structure — a pivotal level that could define the next macro leg.
If bulls manage to break the midline to the upside and successfully retest it as support, the upper boundary of the channel becomes the next major target.
🔼 Upside Scenario:
A confirmed breakout above the midline would signal structural strength and likely lead to a rally toward the upper channel resistance.
If this move aligns with BTC dominance dropping below the 60% threshold, we could see a full-blown altseason emerge.
Under such conditions, historical XRP/BTC behavior suggests that XRP/USD could reach $12–$24.
🔽 Downside Risk:
Losing the mid-channel from here would weaken the structure and invalidate the breakout thesis.
In that case, XRP/BTC would likely rotate back toward range lows, and a defensive strategy is warranted.
Macro Implication:
The 60% BTC Dominance level remains critical. A clean breakdown below it historically marks the beginning of altseason, where high-beta plays like XRP against BTC have outperformed. XRP’s current posture within the channel reflects this high-stakes moment.
Is $PENGU Cooling Off?CSECY:PENGU continues to deliver, respecting structure and printing some clean price action. After breaking out of consolidation beneath the LOI at 0.032, price extended sharply, reaching as high as 0.0469—where we just saw a firm rejection, previously identified in the last update.
That level wasn’t random. It aligned with a Most Likely Target (MLT) for a wave 5 at a lesser degree and a wave 3 at a higher degree. That kind of confluence usually draws in some heat—and it did.
So what now?
The conservative bull outlook is that we may be entering a wave 4. How this pullback unfolds could tell us a lot. The last retrace was shallow, and if this one digs a bit deeper or breaks certain levels with pattern clarity, that might signal a higher degree wave 4 is underway. The key level here is the 0.0325 level we were watching before.
The raging bull scenario is that we’re still in a lesser degree impulse up. A hold and bounce off the key level could be enough to continue the move higher. But I’m watching the conservative outlook here until we get more print.
Here’s what I’m watching:
• Wave 4 Behavior
Is this a pause or a pivot? The next leg depends on how corrective this gets.
• 0.027
A break here would raise eyebrows. That’s a deeper level of interest and could hint at something more than a minor pullback.
• Pattern Depth & Structure
Each retrace tells a story. More complex wave 4s tend to show themselves through drawn-out corrections or deeper fib targets.
I’m still holding partial from the original 0.012 entry, having taken some profit on the way up. If we get a clean W4 print, I’ll be scouting for the next add.
Trade what’s printed. Stay flexible. Let the wave show its hand.
Trade Safe.
Trade Clarity.

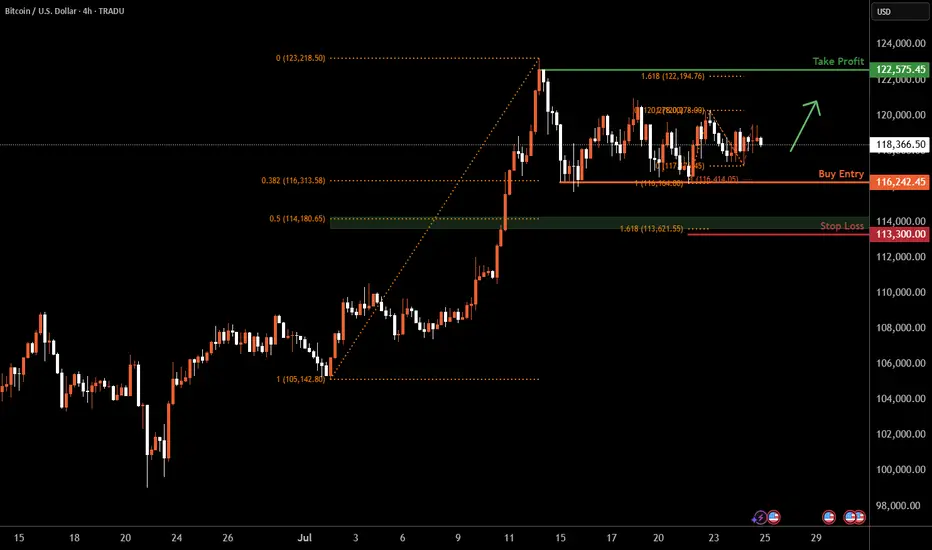
Bitcoin H4 | Falling toward a multi-swing-low supportBitcoin (BTC/USD) is falling towards a multi-swing-low support and could potentially bounce off this level to climb higher.
Buy entry is at 116,242.45 which is a multi-swing-low support that aligns with a confluence of Fibonacci levels i.e. the 38.2% retracement and the 100% projection.
Stop loss is at 113,300.00 which is a level that lies underneath a support zone that is identified by a confluence of Fibonacci levels i.e. the 50% retracement and the 161.8% extension.
Take profit is at 122,575.45 which is a swing-high resistance that aligns close to the all-time-high.
High Risk Investment Warning
Trading Forex/CFDs on margin carries a high level of risk and may not be suitable for all investors. Leverage can work against you.
Stratos Markets Limited (tradu.com ):
CFDs are complex instruments and come with a high risk of losing money rapidly due to leverage. 66% of retail investor accounts lose money when trading CFDs with this provider. You should consider whether you understand how CFDs work and whether you can afford to take the high risk of losing your money.
Stratos Europe Ltd (tradu.com ):
CFDs are complex instruments and come with a high risk of losing money rapidly due to leverage. 66% of retail investor accounts lose money when trading CFDs with this provider. You should consider whether you understand how CFDs work and whether you can afford to take the high risk of losing your money.
Stratos Global LLC (tradu.com ):
Losses can exceed deposits.
Please be advised that the information presented on TradingView is provided to Tradu (‘Company’, ‘we’) by a third-party provider (‘TFA Global Pte Ltd’). Please be reminded that you are solely responsible for the trading decisions on your account. There is a very high degree of risk involved in trading. Any information and/or content is intended entirely for research, educational and informational purposes only and does not constitute investment or consultation advice or investment strategy. The information is not tailored to the investment needs of any specific person and therefore does not involve a consideration of any of the investment objectives, financial situation or needs of any viewer that may receive it. Kindly also note that past performance is not a reliable indicator of future results. Actual results may differ materially from those anticipated in forward-looking or past performance statements. We assume no liability as to the accuracy or completeness of any of the information and/or content provided herein and the Company cannot be held responsible for any omission, mistake nor for any loss or damage including without limitation to any loss of profit which may arise from reliance on any information supplied by TFA Global Pte Ltd.
The speaker(s) is neither an employee, agent nor representative of Tradu and is therefore acting independently. The opinions given are their own, constitute general market commentary, and do not constitute the opinion or advice of Tradu or any form of personal or investment advice. Tradu neither endorses nor guarantees offerings of third-party speakers, nor is Tradu responsible for the content, veracity or opinions of third-party speakers, presenters or participants.
Bitcoin, SPX, Ethereum, Tesla: Whats Next? BTC appears to be showing distribution signs.
I do believe BTC local top is in, but alt coins like Ethereum can still push a bit higher.
Ethereum short around 3900-4000 looks promising
Tesla fell sharply on the back of cash flow burn and expenditures.
Investors are also fearful of sales decline and loss of EV credits.
SPX hit major long term resistance today. Coupling this with a depressed Vix we are likely setting up for a pullback in the market.
Small caps saw distribution today on the back of rising yields. A failed breakout observed on IWM chart.

BTC 4H – Dance with the 200MA
Bitcoin continues its strong relationship with the 200MA.
Each time price dips below it, fear spikes — but bounces off key Fib levels have followed, with price then riding higher alongside the 200MA.
Right now, price is caught between the 200MA and a nearby Fib level.
Here’s what could happen next:
– Price flips the Fib into support, ideally with help from a rising 200MA.
– Price waits for the 200MA to catch up, and they break the Fib together.
– Or, we get another panic dip, and the bounce comes after another test from below.
Whichever path it takes, we’ll be here watching it unfold.
Always take profits and manage risk.
Interaction is welcome.

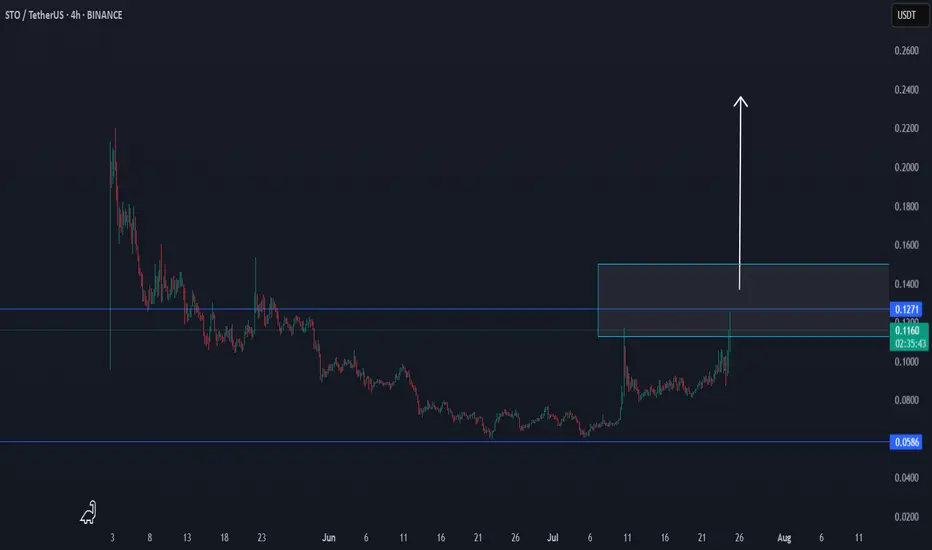
STO/USDT THE FLY EFFECTSTO/USDT are in a trend, which can break.
We will follow the confirmations in the coming time frames.
Volume looks interesting.
BITCOIN BULLISH WEDGE|LONG|
✅BITCOIN is trading in a
Strong uptrend and the coin
Has formed a massive bullish
Wedge pattern so we are
Bullish biased and IF we see
A bullish breakout we will
Be expecting a further
Bullish move up
LONG🚀
✅Like and subscribe to never miss a new idea!✅
Disclosure: I am part of Trade Nation's Influencer program and receive a monthly fee for using their TradingView charts in my analysis.
