Cardano Has Plenty of Room To Grow · Will Hit Beyond $4 EasilyCardano's all-time high is $3.10. Cardano is currently trading at $0.82. Pause. You will be a genius when ADA is trading at $4 if you decide to buy below $1. It is not too late. This is only the start.
Good afternoon my fellow Cryptocurrency trader, how are you feeling in this wonderful day?
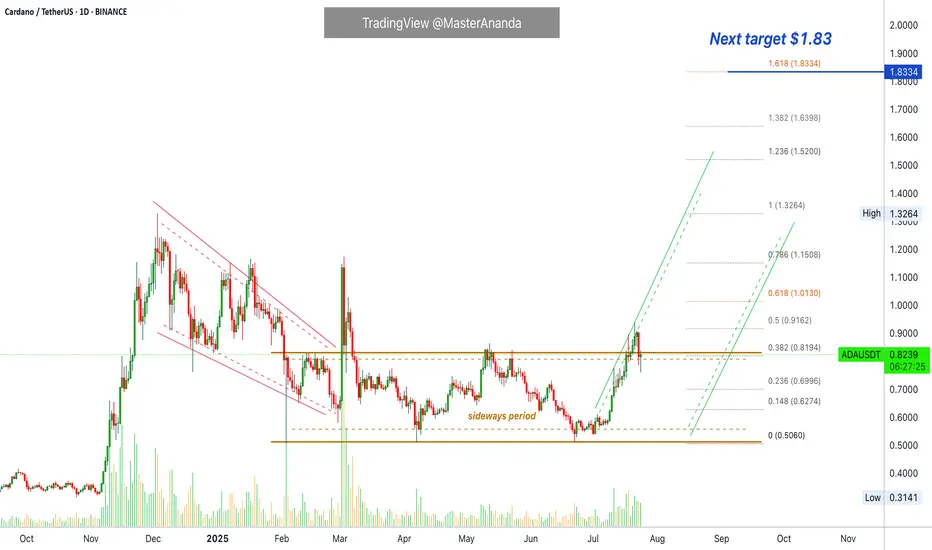
The first major advance for Cardano after the last bull market happened November 2024 and peaked December; we are still getting out of the consolidation that followed the correction of this bullish wave.
Only now Cardano is breaking a sideways channel and still trades below its December 2024 peak. Bitcoin is trading at a new all-time high and is preparing for a major move above $130,000. XRP is trading at a new all-time high and is not dropping. Ethereum is very close to a new all-time high and will certainly continue to grow, only days away. Cardano still has to break its March 2025 high, its December 2024 high; this is not bad, it only means that is still early for this amazing pair.
A bullish advance started 8-July and lasted only 13 days. We are seeing a small retrace now, three days with only one day red. Cardano will recover and continue growing. This growth will not be exhausted in a matter of weeks, it will go for months. Cardano has to grow straight up, daily, weekly, for a prolonged period of time to move beyond $4. But $4 is not the top, $7 and $8 are also possible.
The reason why the action might seen slow, is because this is only the start. Give it time, the market is giving us an opportunity to join. The market is giving everybody the opportunity to buy Cardano while prices are still low. You know how Crypto operates. When it starts moving, it goes so strong and so fast that there is no time to react. Act now and you will reap the reward.
The bullish cycle is confirmed. Just look around, what do you see?
Our sisters and cousins are rising. Our young children are growing; Crypto is going up.
Cardano is one of the main projects in this market and it will not stay behind. You will not be disappointed, you will be happy with the results.
Namaste.
Crypto
Is NEAR NEARing Its Next Explosion? Watch This Perfect Pattern!NEAR is dancing to a powerful rhythm — and it’s all in the cycles 🔁
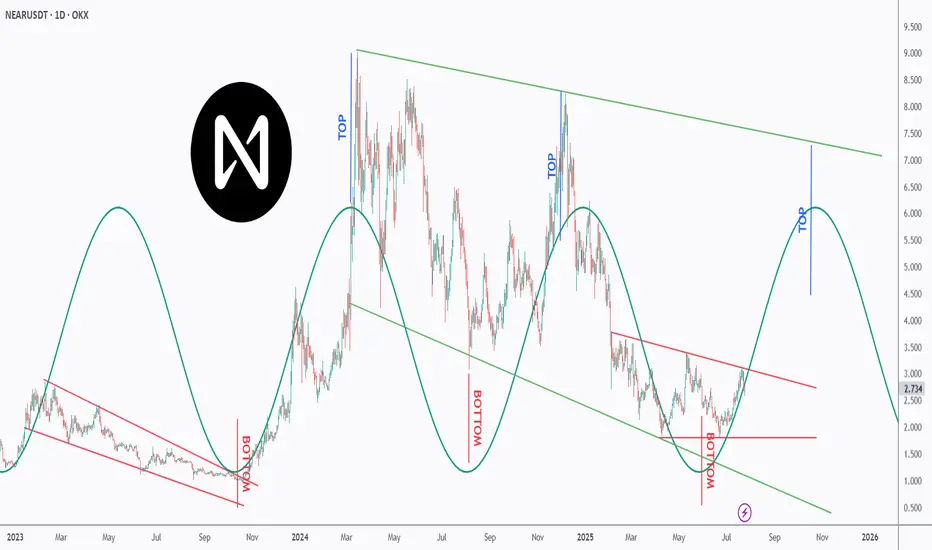
This chart uncovers a repeating top-bottom cycle that has held since early 2023, with precise peaks and valleys emerging every few months 📉📈.
After bouncing off a major bottom at ~$2, NEAR is now approaching the mid-line of the descending red channel, suggesting a potential trend reversal is underway 🔄.
Each previous “BOTTOM” aligned with strong recovery waves 🚀, while the projected “TOP” now points toward the $6–7 zone — aligning perfectly with the upper green trendline resistance 🎯.
If the pattern continues, we could be looking at another macro push before year-end 2025 📆.
📊 Will NEAR ride this wave to new local highs — or is it just another lower high in the making? Either way, the rhythm of this chart is too clean to ignore.
📚 Always follow your trading plan regarding entry, risk management, and trade management.
Good luck!
All Strategies Are Good; If Managed Properly!
~Richard Nasr
League of Kingdoms · Back to Baseline 1,300% Profits TargetLeague of Kingdoms has been dropping since March 2022 vs Bitcoin, LOKABTC. A more than 3 years strong downtrend. The chart is telling me that this downtrend is coming to an end. We have a volume signal, together with price and marketwide action.
Growth potential is huge, it goes beyond 3,700%. For this chart setup, we are going to be focusing only on the "baseline." That is, 1,296% profits potential. This is an easy target.
To get a better picture of this chart you can always disable the log. scale and you will get a better view of reality. LOKABTC is trading at true bottom prices. Once the bottom is in, a reversal can happen any day. The reversal can lead to long-term growth. It will be the first bull market for this pair.
We do not use leverage on this type of setup, very low risk. The strategy is simply to buy and hold. Accumulate long-term as much as you can and want.
Make sure to do your own planning before trading. Market conditions can always change.
Thank you for reading.
Namaste.

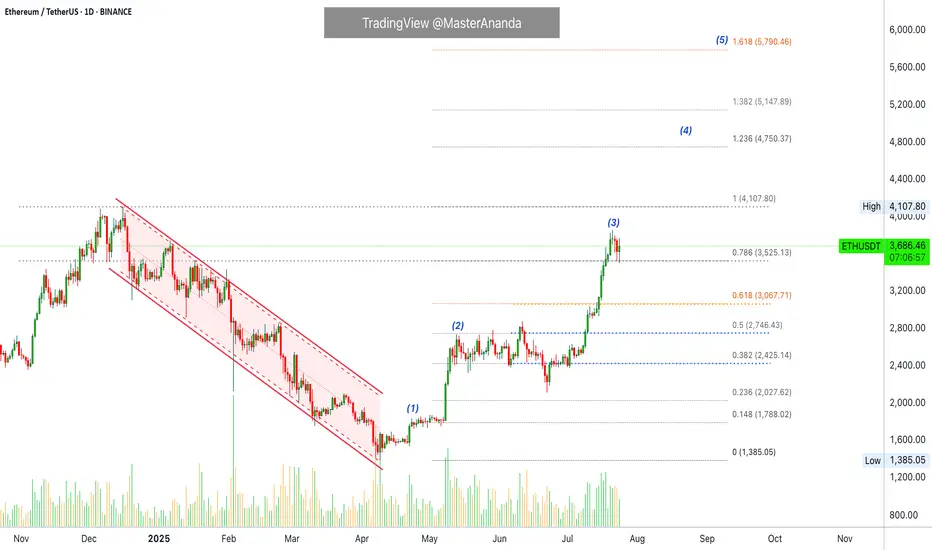
Why Ethereum Will Continue Growing · Trading Above ResistanceEthereum started its latest bullish on the 9th of April. Each advance has been preceded by a period of consolidation.
ETHUSDT (Ether) recovered from its bottom range 23-April, immediately it went sideways for 14 days before moving forward (1). As soon as Ethereum reached $2,700, we have the same pattern but extended, more sideways before moving forward. See this as (2) on the chart. This time the consolidation period lasted 57 days.
The last advance was even stronger (3), Ethereum peaked at $3,860 and we can expect another sideways period, a pause, repeating the same pattern as before. Now, there is an interesting part. The first is a prediction: This consolidation period wont be as long as the second one. The second is related to resistance and support. Notice how ETHUSDT peaked above 0.786 Fib. and this level is being tested as support. The fact that bullish action managed to conquer this level and stop above it, not below, favors the bulls. This means that the market is strong and set to continue growing. There is no significant bearish volume on the red days and the action is neutral so we can expect an advance; the next high will be a new all-time high. We will name it (4) on the chart.
This price pattern should repeat giving us additional growth. After a new all-time high, there will be resistance shy of 6K. And then we expect higher prices with Ethereum peaking around $8,500. Depending on how this level is handled, we can look for $10,000 or even $11,000.
Right now the chart is bullish and points higher.
Continue to hold long-term. It is still too early to fold; it is too early to sell. We are going higher.
Thank you for reading.
Namaste.
Bitcoin Bullish Structure Holds: Focus on Support Entries & Brea__________________________________________________________________________________
Technical Overview – Summary Points
__________________________________________________________________________________
Momentum: Uptrend synchronization on all timeframes (MTFTI Strong Up). Risk On / Risk Off Indicator: strong buy on larger TF, neutral intraday.
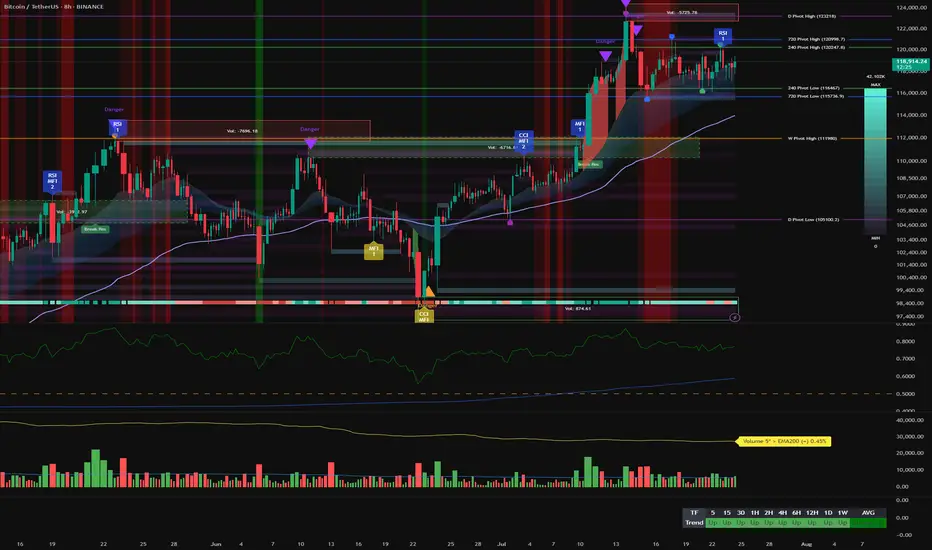
Supports/resistances: Main HTF supports well below current price (115,736–117,000, 111,980). Key resistances to break: 120,998.7 and 122,318.
Volumes: Normal to moderate, no climax, no distribution detected.
Multi-TF behaviour: No behavioural excess, no sell signal, intraday phases are consolidative just below resistance, which is normal.
__________________________________________________________________________________
Strategic Summary
__________________________________________________________________________________
Overall bias: Strong bullish, no end-of-trend alert. Buying retracement towards the Pivot Lows is preferred.
Opportunities: Entries on dips to 115,700–117,000 (2H/4H); breakout above 120,250/122,300.
Risk zones: Return below 115,700 or 111,980 = structural alert. Increased vigilance for macro releases (ECB/PMI/Jobless Claims).
Macro drivers: Fed in focus (no move expected), volatility risk around July 29–30 (FOMC).
Action plan: Entry on retracement, dynamic management. Stop-loss under 115,736 then 111,980. Partial exits on excess or confirmed breakout.
__________________________________________________________________________________
Multi-Timeframe Analysis
__________________________________________________________________________________
1D: Resistances 122,318, 120,998.7; supports 115,736.9, 105,100.2. Risk On / Risk Off Indicator: strong buy, all synchronized bullish, no exhaustion. Daily bias: robust uptrend.
12H/6H/4H: Bullish confluence. Strong momentum, stable volume, validated supports. No ISPD excess, sectoral strength intact.
2H/1H: Consolidation below resistance; healthy structure. Supports to be favored for swing/intraday positioning. Minor intraday hesitation, no reversal.
30min/15min: Behavioural neutrality, lateral movement. Volume normal to mildly elevated, no overheating. Structural risk absent.
Additional indicators:
Risk On / Risk Off Indicator: Strong buy up to 2H; neutral on short TF.
ISPD DIV: Neutral, healthy market, no excess detected.
Volume: No climax or distribution, multi-TF structural support.
Cross-timeframe synthesis: Multi-timeframe bullish alignment, no structural weakness. Opportunities on retracement, breakout plays above all-time highs.
__________________________________________________________________________________
Synthesis & Strategic Bias
__________________________________________________________________________________
BTC trend and momentum remain aligned, sector leadership (Risk On / Risk Off Indicator) intact.
Strong HTF support, major resistances must break for extension.
External risk: macroeconomic catalysts (Fed, ECB, US PMI).
Premium opportunities on dips to supports, dynamic management essential around macro events.
Final bias: as long as supports and indicator alignment hold, bull run continues. Partial exit at resistance; stops below validated pivots.
ETH 1H — Decision Point Ahead
ETH just confirmed a bullish RSI divergence, with price finding support at the 200MA.
MACD supports the move, and the trend structure is clean: MLR > SMA > BB Center.
Now, price is hovering at the 0.236 Fib level.
A few strong closes above it could open the door for more upside.
If rejected, we might revisit the 200MA for another test.
Either way — we’ll find out soon.
Always take profits and manage risk.
Interaction is welcome.

Bitcoin is testing the triangle ┆ HolderStatBINANCE:BTCUSDT is ranging $132K–$137K in a triangle pattern. Breakout above $137K may target $143K. Decision point near.

Ethereum will retest $3,500 ┆ HolderStatOKX:ETHUSDT bounced from $2,875 and is approaching $3,100. Breakout may target $3,250 next. Bullish structure remains.

XRP is heading toward $4 ┆ HolderStatBYBIT:XRPUSDT is testing $3.40 for the third time. A breakout targets $3.60, but rejection risks $3.10 fallback.

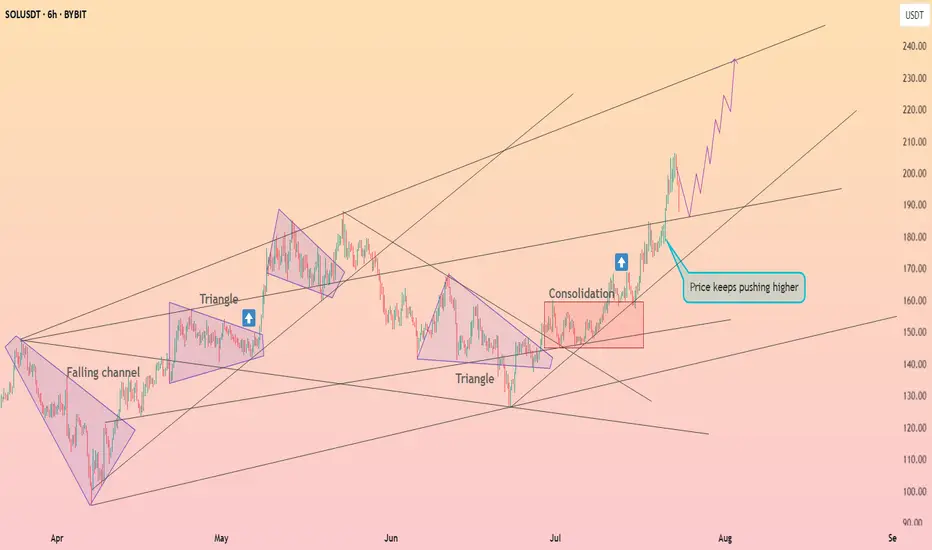
Solana is preparing to breakthrough $200 ┆ HolderStatOKX:SOLUSDT is trapped between $172 and $180. Break above $180 may unlock $188+. Watch for volume breakout.
ETH Dominance – Golden Cross, New Era?This is ETH Dominance on the Daily chart.
A golden cross just printed, and the last time we saw this, at similar levels, was February 2020. Back then, dominance climbed steadily, bouncing off the 200MA repeatedly.
Today, price is approaching the 0.236 Fib level, which could act as short-term resistance and send us back to retest the 200MA as support.
But unlike 2020, everything has changed:
– ETH is getting institutional support via ETF flows
– The SEC confirmed ETH is not a security
– The RWA narrative is gaining serious traction
That’s why this golden cross could mean more than just a signal, it may be the start of a much stronger structural uptrend.
My humble guess?
ETH Dominance continues climbing with the 200MA as support.
It won’t be a smooth ride, but the direction might be set.
Always take profits and manage risk.
Interaction is welcome.

BTC.D in Play! Rejection or Reversal? This is BTC.D on the daily chart
It recently dropped below the 200MA and found support at the 0.382 Fib level
Today price is getting rejected by both the 200MA and the 62.25 Fib level
If it stays below we could see a move back down to 0.382
If it closes above the confluence area more upside is possible
Or it could simply range here for a while
We cant control what happens so best to stay patient and ready
Always take profits and manage risk.
Interaction is welcome.

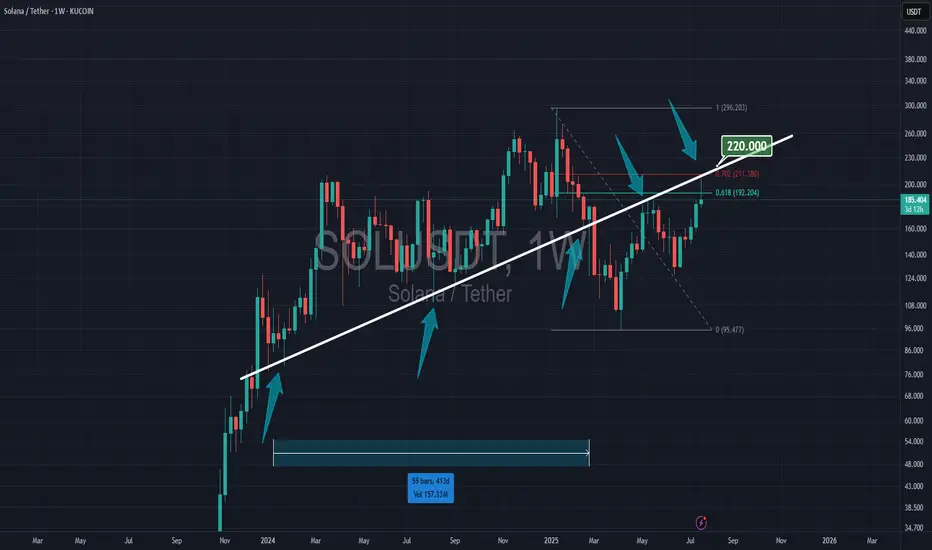
SOLANA & 220 RESISTANCESolana is at 61% of Fibonacci, and the trendline has held since early 2024. To stay in the bull run, Solana must break the 220 resistance.
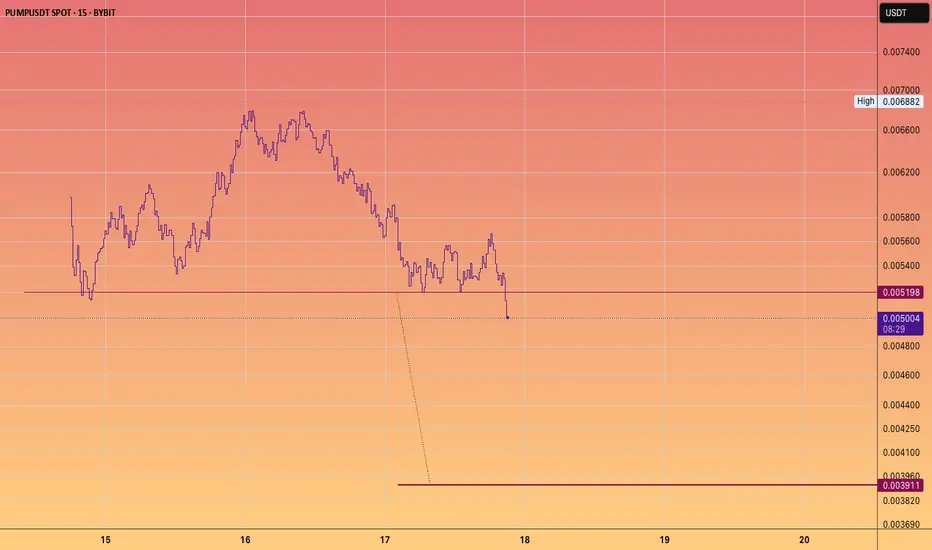
What’s Next? 🚨 $FARTCOIN Cup & Handle Pattern Forming – What’s Next? 📈
$FARTCOIN has formed a bullish Cup & Handle pattern — but is it over?
❌ Not yet. $FARTCOIN hasn’t shown any strong bearish signals for now.
🔍 We’re watching two key green line levels below.
📉 If the price drops toward these zones, we may see buyers step back in — creating a potential entry, but only with confirmation.
✅ Stay patient — no rush to jump in without a setup. Let the chart guide us.

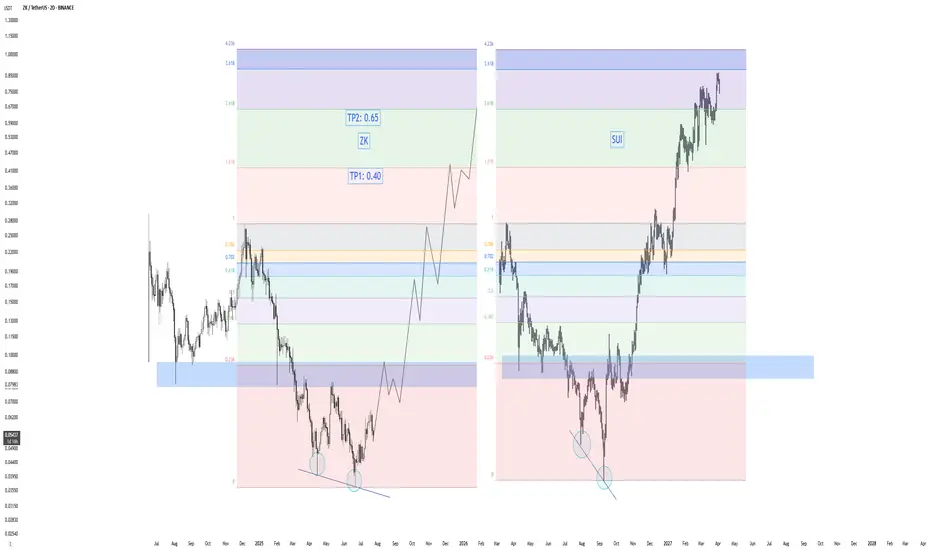
ZK - Golden opportunity? 0.40? Hello everyone, here’s my new analysis on ZK.
Recently, the price surged nearly 80%, followed by an 18% pullback over the last two days. From its all-time high, ZK is currently down about 80%, which in my opinion presents a golden opportunity.
Based on my research, the peaks of altseasons often occur between December–January or April–May. After analyzing the Others Market Cap dominance chart, I believe we’re setting up for a strong altseason in the next 5 months. Over the last few years, BTC has significantly outperformed altcoins—but recently, I’ve noticed a major shift in market dynamics, indicating that capital might be rotating back into alts.
On the chart, ZK is showing a classic crypto crash-recovery pattern. For example, SUI dropped around 80–85% before rallying over 1000% in just 4 months. I see a strong structural similarity between the bottoming pattern of SUI and the current structure of ZK.
If ZK breaks the resistance zone at 0.080–0.095, I expect a rapid move up toward 0.22–0.26. After that, a healthy correction around the previous ATH would be expected—before potentially heading to 0.40 as Take Profit 1 (TP1).
$HBAR Wave 4 finishing soon?CRYPTOCAP:HBAR Hedera appears to have completed wave 4 with the test of the High Volume Node support at the 0.382 Fibonacci retracement.
Wave 5 has an expected target of the High Volume Node resistance at $0.4 before a larger retracement in wave 2 aligning with my summer pump august / September dump view.
Analysis is invalidated below $0.1933 at the 0.5 Fib retracement and will be updated to a wave 2 instead of 4.
Safe trading

$FET local ending Diagonal and wave 2 near completion?NYSE:FET was rejected for the 4th time at the daily 200EMA! Each time the probability of a breakout increases.
I have adjusted the High Volume Nodes for accuracy.
Locally Fetch appears to have completed a motif wave up with an ending diagonal for wave 5. Wave 2 is expected to find support at the daily pivot and .618 Fibonacci retracement before attempting a breakout of the daily 200EMA once more.
A move below wave II will invalidate this analysis.
Safe trading
$ETH Hit Our Targets and was rejectedCRYPTOCAP:ETH hit our signal take profit target at $3820 and was rejected at the High Volume Node EQ to the penny.
That appears to have completed wave 3 of this motif wave. Wave 4 has an expected target of the R2 daily pivot and 0.236-0.382 Fibonacci retracement, $3260 before continuing to the upside in wave 5 with a target of the all time high.
This aligns with my views of a significant pullback at the end of August and September which is typical after a summer rally.
No divergences yet in daily RSI.
Safe trading

Ethereum is Trending HigherSince April trough, Ethereum has risen by 179%, delivering a higher rate of return than Bitcoin at 66%. But most of our attention is on Bitcoin, breaking above the 120,000 level.
Why is Ethereum quietly gaining ground —and what does the future hold for Ethereum?
Mirco Bitcoin Futures and Options
Ticker: MET
Minimum fluctuation:
$0.50 per ether = $0.05 per contract
Disclaimer:
• What presented here is not a recommendation, please consult your licensed broker.
• Our mission is to create lateral thinking skills for every investor and trader, knowing when to take a calculated risk with market uncertainty and a bolder risk when opportunity arises.
CME Real-time Market Data help identify trading set-ups in real-time and express my market views. If you have futures in your trading portfolio, you can check out on CME Group data plans available that suit your trading needs www.tradingview.com

The Edge Of The Fork - The Joker In Your PocketWOW!
\ \ First of all, I want to say THANK YOU for all the boosts, follows, and comments. You guys & gals give me the energy to continue this journey with you.\ \
Today, I want to show you that what we’ve learned with horizontal lines can also be applied to "Medianlines," or Forks.
Listen, I don’t want you to blow your brain with all the rules.
Not at the beginning of this journey, and not later on either.
Don’t ask yourself:
* when to use which Fork
* which swing to measure
* when to trade
* where to set your stop
* what if... bla bla bla
That’s not fun — that’s stress.
I don’t like stress — nobody does.
So let’s just chill and have fun here.
That’s my personal reason for doing all this Trading thing. I want to have fun — the money will take care of itself, just like the destination of a trail takes care of itself, as long as I keep putting one foot in front of the other. And that’s simple, right?
So let’s do it exactly the same way.
Just simple steps, connecting some dots, and BAM! — You’re there before you even know it §8-)
\ Let’s jump to the chart:\
Today, you’ll find out why Medianlines/Forks are a cousin of the horizontal Channel — but NOT the same.
Where are they different?
Forks are different because they’re capable of projecting the most probable path of price. And that’s a HUGE difference.
Yes, you can apply the full rule set of Forks to a horizontal Channel.
But the Channel CANNOT project the most probable path of price.
I hear you, I hear you: "No one and nothing can foresee the future. How is it even possible that Forks can?"
\ Here’s why:\
There’s a thing called "Statistical Importance." And it means that if something happens very often in the same way, we have a higher chance of seeing the same behavior again in the future.
And that’s what the inventor, Allan Andrews, discovered — and he created the rules around his findings.
\ A high probability that price will move in the direction of the projected path, as long as it stays within the boundaries of the Medianlines/Fork.\
That’s the whole "magic" behind Medianlines/Forks.
And the same applies to the "Behavior of Price" within and around Medianlines. That’s really all there is to it.
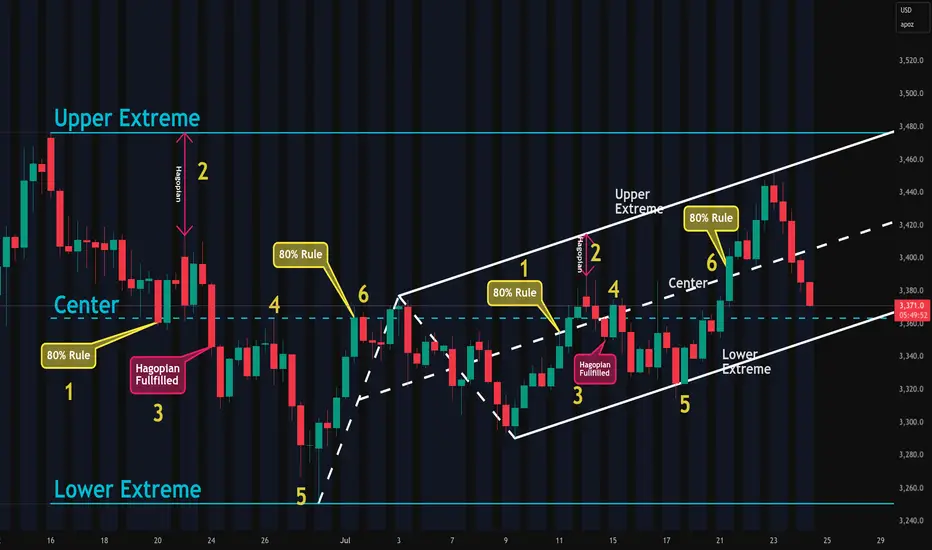
Look at the chart and compare the Channel and the Fork:
1. Price reaches the Centerline about 80% of the time
2. HAGOPIAN → price goes farther in the opposite direction than where it came from
3. HAGOPIAN’s rule fulfilled
4. Price reaches the Centerline again
5. Price reaches the other extreme
6. Price reaches the Centerline about 80% of the time
You’ll see the same behavior inside the Fork!
That’s beautiful, isn’t it? §8-)
And here’s a little Joker in your pocket — if you know the difference between the Channel and the Forks!
Do you know what it is?
Yep! You’d automatically know the direction to trade — giving you another 10% edge right out of the box — LONG TRADES ONLY. Because the Fork projects the most probable path of price to the upside, not down.
That's all folks §8-)
Like this lesson?
With a simple boost and/or a little comment, you load my Battery so I can continue my next step on the trail with you.
Thank you for spending your time with me §8-)
LOOKS CAN ENTER LONG TERM CYCLE AFTER THISLooks seems to make an important trend, which can allow this coin to enter a cycle area.
On the low time frame, it shows breakdown. The main view is that this coin is positive.
$0,035 is an important cycle target, which can be done with time depending on the last confirmations.

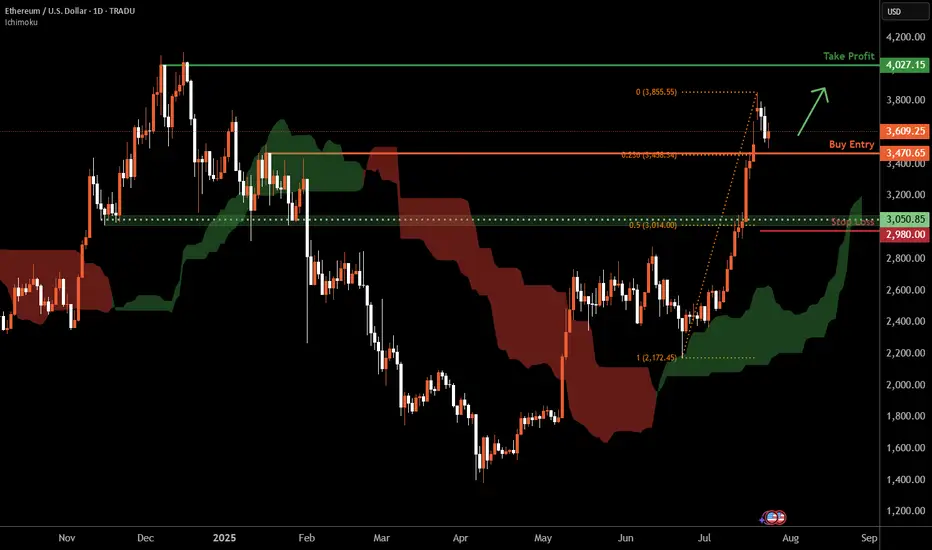
Ethereum D1 | Bullish uptrend to extend higher?Ethereum (ETH/USD) is falling towards a pullback support and could potentially bounce off this level to climb higher.
Buy entry is at 3,470.65 which is a pullback support that aligns with the 23.6% Fibonacci retracement.
Stop loss is at 2,980.00 which is a level that lies underneath a pullback support and the 50% Fibonacci retracement.
Take profit is at 4,027.15 which is a multi-swing-high resistance.
High Risk Investment Warning
Trading Forex/CFDs on margin carries a high level of risk and may not be suitable for all investors. Leverage can work against you.
Stratos Markets Limited (tradu.com ):
CFDs are complex instruments and come with a high risk of losing money rapidly due to leverage. 66% of retail investor accounts lose money when trading CFDs with this provider. You should consider whether you understand how CFDs work and whether you can afford to take the high risk of losing your money.
Stratos Europe Ltd (tradu.com ):
CFDs are complex instruments and come with a high risk of losing money rapidly due to leverage. 66% of retail investor accounts lose money when trading CFDs with this provider. You should consider whether you understand how CFDs work and whether you can afford to take the high risk of losing your money.
Stratos Global LLC (tradu.com ):
Losses can exceed deposits.
Please be advised that the information presented on TradingView is provided to Tradu (‘Company’, ‘we’) by a third-party provider (‘TFA Global Pte Ltd’). Please be reminded that you are solely responsible for the trading decisions on your account. There is a very high degree of risk involved in trading. Any information and/or content is intended entirely for research, educational and informational purposes only and does not constitute investment or consultation advice or investment strategy. The information is not tailored to the investment needs of any specific person and therefore does not involve a consideration of any of the investment objectives, financial situation or needs of any viewer that may receive it. Kindly also note that past performance is not a reliable indicator of future results. Actual results may differ materially from those anticipated in forward-looking or past performance statements. We assume no liability as to the accuracy or completeness of any of the information and/or content provided herein and the Company cannot be held responsible for any omission, mistake nor for any loss or damage including without limitation to any loss of profit which may arise from reliance on any information supplied by TFA Global Pte Ltd.
The speaker(s) is neither an employee, agent nor representative of Tradu and is therefore acting independently. The opinions given are their own, constitute general market commentary, and do not constitute the opinion or advice of Tradu or any form of personal or investment advice. Tradu neither endorses nor guarantees offerings of third-party speakers, nor is Tradu responsible for the content, veracity or opinions of third-party speakers, presenters or participants.