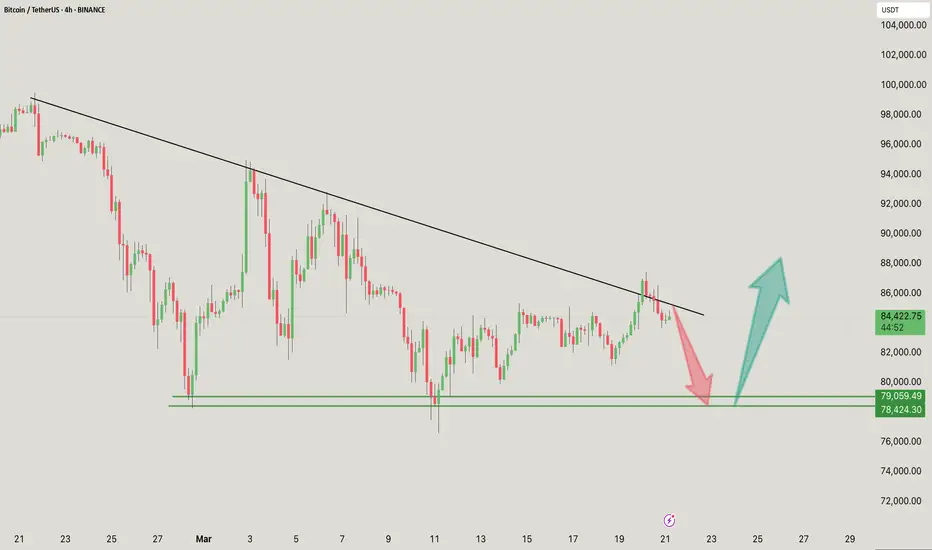
BTC/USDT 4-hour chart update. The Bitcoin (BTC/USDT) 4-hour chart suggests a key decision point near descending trendline resistance.
BTC is testing a key descending trendline, which has acted as resistance multiple times.
Rejection from this level could lead to a retracement towards the $79,000 – $78,400 support area (red arrow).
If BTC breaks above the trendline with strong volume, it could signal a bullish continuation towards $88,000+ (green arrow).
Immediate Resistance: $85,000
Key Support Area: $79,000 – $78,400
Breakout Target: $88,000+
If you found this analysis helpful, hit the Like button and share your thoughts or questions in the comments below. Your feedback matters!
Thanks for your support!
DYOR. NFA
Crypto2025
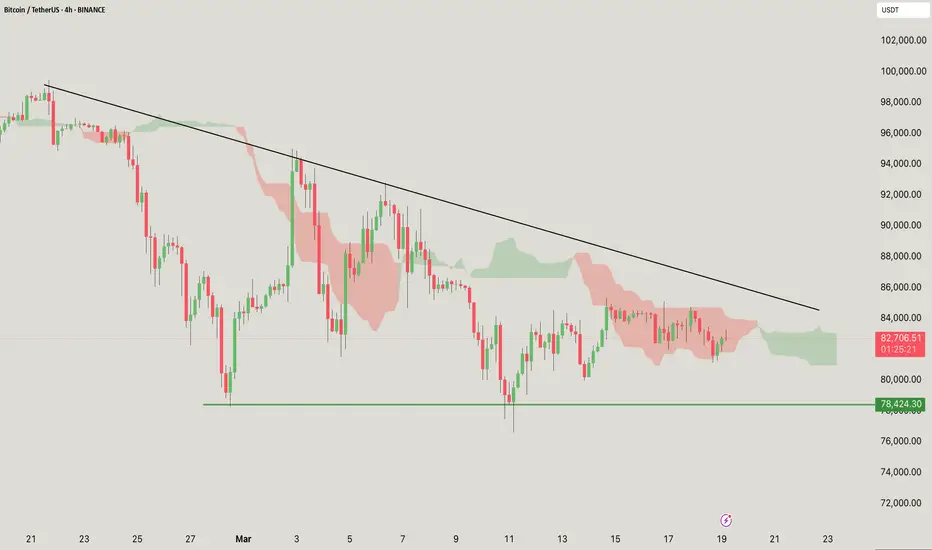
Bitcoin (BTC/USDT) 4-hour chart.
Price: Currently around $82,753.16, showing a slight increase of +0.05%.
Trend line: A descending trend line is visible, indicating potential resistance. If the price breaks above this line, it could signal a bullish reversal.
Support level: There is a strong support level at $78,424.30, which has been tested multiple times.
Indicators: The price is currently in the cloud, indicating a state of indecision. The green cloud above indicates potential resistance, while the red cloud below indicates previous bearish momentum.
Resistance: Keep an eye on the descending trend line and the upper edge of the cloud.
Support: The $78,424 level acts as a crucial support area.
Monitor breakouts: A breakout above the trend line may indicate an uptrend, while a breakdown below the support level may signal a further decline.
Volume analysis: Monitor trading volume to confirm breakouts.
If you found this analysis helpful, hit the Like button and share your thoughts or questions in the comments below. Your feedback matters!
Thanks for your support!
DYOR. NFA
ALTS MARKET CAP ANALYSIS. Altcoin Market Cap Analysis: Potential Rebound or Breakdown?
The altcoin market cap is currently bouncing off the support trendline of its ascending triangle pattern, which indicates a potential bullish continuation.
Ascending Triangle Support:
The market cap is testing a key support trendline within an ascending triangle, which is typically a bullish formation.
Sustaining above this level strengthens the case for a breakout.
Ichimoku Cloud Indicates Bullish Momentum:
The Ichimoku Cloud is turning supportive, which indicates an improving market sentiment.
A move above the cloud could confirm bullish momentum.
Possible Scenario:
If the price sustains above the trendline, the altcoin could see a strong bounce, leading to further gains.
A breakout above the resistance level of the triangle would confirm a larger uptrend.
A break below the support would invalidate the bullish structure.
This could lead to a deeper correction, which indicates increasing risk.
If you found this analysis helpful, hit the Like button and share your thoughts or questions in the comments below. Your feedback matters!
Thanks for your support!
DYOR. NFA

BTC/USDT 4HOUR CHART UPDATE !!The BTC/USDT 4-hour chart suggests a descending channel pattern, indicating a possible continuation of the bearish trend until a breakout occurs.
Descending Channel:
Price activity remains within a downward-sloping channel, with lower highs and lower lows.
The upper trendline acts as resistance, while the lower trendline provides dynamic support.
Resistance: Near $85,000 to $87,500, aligned with the upper trendline.
Support: Around $78,424, the lower limit extending to $72,000 if a breakdown occurs.
(Red Arrow):
If BTC fails to break the resistance, it could drop towards $78,424 and possibly lower.
(Blue Arrow):
A breakout above the descending channel (~$87,500) could trigger a bullish run towards $90,000+.
If you found this analysis helpful, hit the Like button and share your thoughts or questions in the comments below. Your feedback matters!
Thanks for your support!
DYOR. NFA

BTC → Bitcoin Retrace to $69,500? Or Bounce to $150,000?The short version, the probability that Bitcoin tests the breakout price around $69,500 is very high. That's simply the nature of breakouts; bulls take profits (sell orders) until the previous high is reached, at which point the bulls start buying again, and the bears take their profits (buy orders), driving the market up for another leg.
The question is, what is our next move as traders? Or even Bitcoin investors?
How do we trade this? 🤔
Let's zoom out to the Monthly chart. Bitcoin is resting on the 9EMA, a support area we've closed above it since September of 2023. Our current context is we've broken out of the 2021 cycle high of $69,500 and reached a new high just shy of $110,000. It's clear we're in pullback mode right now, so far-reaching down to $78,000.
Fundamentally, there aren't many catalysts for bullish activity. Bulls are simply taking profit at the first 6-figure Bitcoin price, which is both a psychological and technical price for selling. Monetary policy is still in a state of qualitative tightening, inflation has been slowly rising since September 2024, from 2.4% to 3%. Not a dramatic move, which certainly isn't helping Bitcoin move to the upside. Bitcoin seems to respond more to monetary policy than inflation rates and while the rates have steadily climbed, it's not enough to shock the market, while monetary policy has largely stayed the same.
Technical analysis shows TOTAL, TOTAL2, and TOTAL3 crypto market cap charts all were rejected at key resistance areas in early December. Bitcoin broke the 2021 right shoulder around $46,000 to $73,000, then had a measured move up to $109,000, about a 55% move each, give or take. We're simply in a state where we've reached a key resistance level after a breakout while the market as a whole is in a state of uncertainty. I believe that uncertainty will lead to a capitulation down to the high $ 60,000s, even if it's a quick wick. This would likely lead to a $1,500 ETH, $1.50 XRP, it may look ugly. But take a look at past cycles; a 30-40% pullback for Bitcoin is just another Thursday in the crypto market. The alts can pull back as much as 50%-60%.
I think we wait for the buy signal. Look for a pullback to the breakout area at $69,500, and wait for the market to tell us that we found the buy zone with a strong candle close on or near its high on the Daily chart, likely somewhere around $75,000. Then I believe $150,000 is the area for this cycle high based on the Lifetime Resistance and measured move target. The measured move shows a 57% move up after the breakout; if we take that 57% move up and stack it on the mid-price of the current trading range at $91,000, that takes us to right around $150,000. Anything beyond that is a bonus. I think from there, it makes a second attempt to breach the high, followed by our 12-18 month bear market as shown in the chart.
💡 Trade Idea 💡
Long Entry: $75,000
🟥 Stop Loss: $55,000
✅ Take Profit #1: $105,000
✅ Take Profit #2: $135,000
⚖️ Risk/Reward Ratio: 1:3
🔑 Key Takeaways 🔑
1. Breakout above 2021 Cycle High $69,500
2. Psychological and technical high of $100,000 reached
3. Pullback phase has been in motion since December, breakout zone is the buy target
4. Wait for a two-legged pullback toward the Monthly 30EMA (breakout zone), look for strong buy signal, large bull candle closing on or near its high.
5. RSI is near 64.00 and below the Moving Average. Wait for contact and a drop toward 60.00 in concurrence with the price action to enter.
💰 Trading Tip 💰
It's reasonable to take half profits at the first resistance target in a long trade, or the first support target in a short trade. Using a 1:1 Risk/Reward Ratio for your first target, you can move your stop loss up to your entry price, locking in profits. This allows you to watch the rest of the trade execute without worry of losing money. This helps improve trading psychology and the equity in your account.
⚠️ Risk Warning! ⚠️
Past performance is not necessarily indicative of future results. You are solely responsible for your trades. Trade at your own risk!
Like 👍 and Follow to learn more about:
1. Reading Price Action
2. Chart Analysis
3. Trade Management
4. Trading Psychology

BTC/USDT weekly chart shows a classic technical analysis patternThe BTC/USDT weekly chart shows a classic technical analysis pattern
Support and resistance levels:
There is clear horizontal resistance around $83,000, represented by the green line.
The potential support level is marked around $78,000.
The chart shows a “cup and handle” structure, which could indicate bullish potential if the price breaks above the resistance.
An upward trend line is also present, reinforcing bullish sentiment as long as the price remains above it.
Currently trading around $83,436, noticeable price action reflects market sentiment towards potential future highs.
Keep an eye on breakouts above resistance for bullish signals or declines below support levels for potential bearish sentiment.
Always consider market volatility and use risk management strategies when trading.
If you found this analysis helpful, hit the Like button and share your thoughts or questions in the comments below. Your feedback matters!
Thanks for your support!
DYOR. NFA

Here is a brief analysis of the BTC/USDT chart: 92,500 USDT, represented by the black horizontal line.
Support level: Close to 78,254.38 USDT, represented by the green horizontal line.
A descending trend line indicates potential bearish trends.
An ascending trend line suggests the formation of a potential support level.
Bullish recovery: If the price respects the support line, it may reach the resistance level.
Bearish breakdown: A break below the support may lead to further declines.
If you found this analysis helpful, hit the Like button and share your thoughts or questions in the comments below. Your feedback matters!
Thanks for your support!
DYOR. NFA

4-hour Bitcoin (BTC/USDT) chart. Some key points to consider:Descending Triangle Formation: The price action appears to be forming a descending triangle, with lower highs represented by the upper trendline and potential support levels represented by the lower trendline.
Support Level: The green horizontal line around $78,254 acts as a crucial support area. A break below this level could signal further bearish moves.
Resistance Level: The resistance level at $91,205 indicates that the price may face challenges moving higher.
Current Price: The most recent price is around $80,023, indicating some volatility and the possibility of an upward movement or a test of support.
The chart shows the projection of the potential price movement, indicating potential upward movement after bouncing off the support before facing resistance.
Watch for breakouts: Keep an eye on support and resistance levels. A breakout above resistance could lead to a bullish trend, while a breakdown below support could lead to further declines.
Use volume indicators: Consider looking at trading volume for confirmation of price action, especially during key levels.
Stay updated: It is important to monitor market news or important events that impact Bitcoin prices.
If you have specific questions or need further analysis, feel free to ask!
If you found this analysis helpful, hit the Like button and share your thoughts or questions in the comments below. Your feedback matters!
Thanks for your support!
DYOR. NFA

BNB/USDT weekly chart indicates a few key points for analysis:As of the latest update, BNB is trading around $614.87.
Strong resistance is visible around $663.27.
Key support levels are highlighted around $478.30 and $205.25.
The chart shows a potential cup-and-handle formation, suggesting a bullish outlook if the price breaks above the resistance level.
Recent price action indicates a potential consolidation period, with movement occurring between established support and resistance.
For a more detailed analysis, consider factors such as trading volume, market news, and overall trends in the cryptocurrency market. Always exercise caution and do further research before making any trading decisions.
If you found this analysis helpful, hit the Like button and share your thoughts or questions in the comments below. Your feedback matters!
Thanks for your support!
DYOR. NFA

BTC/USDT Chart Update !! BTC/USDT price movement over some time from mid-2020 to early 2025.
Price Action: Prices have experienced significant fluctuations, forming a series of peaks and troughs. The recent price has been around 84,618 USDT.
Resistance Level: The highlighted area around 96,500 USDT indicates a potential resistance level that the price may struggle to break.
Technical Pattern: The chart suggests a “cup and handle” formation, indicating a potential bullish trend if the price breaks through the resistance.
Recent Decline: The current decline of around 12.09% suggests a correction or retracement may be in store after the recent rally.
It would be prudent to monitor market news and technical indicators for the latest updates to anticipate future price movements.
If you found this analysis helpful, hit the Like button and share your thoughts or questions in the comments below. Your feedback matters!
Thanks for your support!
DYOR. NFA

Looking at the BTC/USDT weekly chart,The current price of Bitcoin is around $92,214, which represents a recent decline of around 4.2%. This indicates some selling pressure in the market.
The chart displays a classic cup and handle pattern, which is generally bullish. A consolidation (handle) followed by a rounded bottom (cup) suggests the possibility of a breakout if the price crosses resistance.
There is a significant horizontal resistance near $96,500. A successful breakout above this level could signal a new upward trend.
The price is currently above key support, but a move below $90,000 could be significant. If it stays above this level, it could signal continued bullish sentiment.
The general trend appears upward since early 2023, supporting the bullish outlook until key resistance levels are broken.
Consider monitoring volume and other technical indicators to confirm trend strength, especially during potential breakout attempts.
If you have specific questions or need insight on particular aspects of the charts, let me know!
If you found this analysis helpful, hit the Like button and share your thoughts or questions in the comments below. Your feedback matters!
Thanks for your support!
DYOR. NFA

TOTAL MARKET CHART UPDATE !!The chart shows the total cryptocurrency market capitalization trend. It shows a range-bound movement within parallel lines, indicating potential resistance and support levels.
Here are some key points you may find useful:
Current market capitalization: approximately $3.13 trillion.
Resistance and support: The upper and lower lines indicate levels where the price has historically reversed.
Trend analysis: The price seems to be consolidating, which could lead to a breakout or breakdown.
Keep an eye on the market to see if it breaks out of this range!
If you found this analysis helpful, hit the Like button and share your thoughts or questions in the comments below. Your feedback matters!
Thanks for your support!
DYOR. NFA

BTC/USDT 4HOUR CHART UPDATE !!The BTC/USDT chart shows a symmetrical triangle structure, indicating a period of consolidation. The price is around 99,098.28 USDT, and it appears to be approaching the triangle's upper trendline.
The lower trendline suggests a support level near 94,000 USDT.
The upper trendline acts as resistance, around 100,000 USDT.
Possible Movement: A breakout above the resistance could lead to upward momentum, while a drop below the support could indicate a bearish trend.
Monitor the trading volume during these breakout attempts to confirm the direction!
If you found this analysis helpful, hit the Like button and share your thoughts or questions in the comments below. Your feedback matters!
Thanks for your support!
DYOR. NFA

BTC/USDT weekly chart update, here are some key observations: The price is around $96,063, hovering near the resistance zone slightly below $100,000. This indicates that the market is still testing higher levels.
Potential Head & Shoulders Pattern:
This formation appears to be a head and shoulders pattern, which is often seen as a bearish reversal signal. The left shoulder, head, and right shoulder are recognizable, and a breakdown could indicate downward momentum.
The overhead resistance barrier near $100,000 has proven challenging, and failure to break this level could increase selling pressure.
If the price declines, the chart suggests looking at support around $80,000. This level appears to be crucial for maintaining upward momentum.
Green areas indicate bullish momentum in previous cycles, but if the current pattern persists, some traders may start positioning for a potential decline.
Traders should keep an eye out for a breakout above $100,000 for bullish confirmation or a decline below support levels around $80,000, which could signal entering a bearish trend. Keep an eye on volume and market sentiment as these can significantly influence price movements.
If you found this analysis helpful, hit the Like button and share your thoughts or questions in the comments below. Your feedback matters!
Thanks for your support!
DYOR. NFA

USDT Dominance Weekly Chart Analysis !!The chart shows USDTDominance in the Ukrainian market for several years, indicating distinct trends and patterns.
Trend Line Support:
A visible upward significant line has been established since 2021. This suggests a fundamental base level from which USDT dominance has historically bounced back.
Heads & Shoulders Pattern:
The chart item includes the Heads & Shoulders number, indicating a bearish reversal pattern. This means the upward momentum may slow down, and a downward shift may occur.
Current Dominance Level:
The current level of around 4.53% is significant. A break below this level and a decline may occur, possibly targeting the projected supported area around 2.00% in the long term.
Take a look at the support and resistance separation on the chart. The interaction between Trend Travelers and Heads & Shoulders Trend Travelers will be important in predicting the future of USDT dominance. Anticipating a downward movement may be prudent,
If you found this analysis helpful, hit the Like button and share your thoughts or questions in the comments below. Your feedback matters!
Thanks for your support!
DYOR. NFA

ETHUSDT CHART UPDATE !!ETH/USDT chart on the daily timeframe is currently in a descending channel. It recently bounced off the lower trendline, indicating a potential short-term bullish reversal. The lower boundary of the channel acts as a strong support level around $2,400-$2,500. The upper trendline of the descending channel, near $3,000, is the next potential resistance. If Ethereum continues this bounce, it could head towards the $3,000 resistance area. A breakout above the channel could signal a trend reversal to the upside, while rejection could push ETH back toward lower support. Keep an eye on volume and price action near resistance levels to confirm the next move.
If you found this analysis helpful, hit the Like button and share your thoughts or questions in the comments below. Your feedback matters!
Thanks for your support!
DYOR. NFA

BTC/USDT chart analysis.BTC is hovering around the previous trendline and will be testing it as potential support after the breakout.
So far, it remains above the green demand zone ($92,000 – $95,000), indicating buyers are stepping in.
100-day MA (purple line): BTC bounced off this level, reinforcing its significance as a dynamic support.
BTC remains above it, a bullish sign, but a breakdown could change the momentum.
Support: $92,000 – $95,000 (green zone).
Resistance: $100,000 – $102,500, which has been a selling zone recently.
Do you want a trading strategy based on this setup?
If you found this analysis helpful, hit the Like button and share your thoughts or questions in the comments below. Your feedback matters!
Thanks for your support!
DYOR. NFA

BTC/USDT Chart Analysis.
Bitcoin recently tested the previous trendline resistance (now acting as support) and bounced back.
The price briefly dropped into the green demand zone (support zone around $92,000-$95,000) but quickly recovered.
100-day MA (purple line): Provided strong support.
Holding this level is a bullish signal indicating buyers are coming forward.
BTC is now trading slightly above $97,000 and must stay above the trendline for a confirmed bullish reversal.
A close above $100,000 would strengthen the case for upward continuation.
Support: $92,000 – $95,000 (green zone).
Resistance: $100,000 then $104,000 – $108,000 range.
If you found this analysis helpful, hit the Like button and share your thoughts or questions in the comments below. Your feedback matters!
Thanks for your support!
DYOR. NFA

USDTDOMINANCE CHART UPDATE !The chart highlights USDT dominance (USDT.D), which is used to measure market sentiment and money flow into or out of stablecoins such as USDT
The chart shows a completed “head and shoulders” pattern, which is often considered bearish in technical analysis.
The neckline has been broken, indicating the possibility of further declines.
The price appears to be testing a descending triangle, which could indicate a continuation of the decline.
The green area below (possibly around 2.5%-3%) could act as a crucial support if dominance continues to decline.
The 50-day (red) and 200-day (green) moving averages are plotted.
Dominance is trading below both moving averages, which reinforces bearish momentum.
A breakdown of the current triangle could lead to further declines towards the marked support area.
If you found this analysis helpful, hit the Like button and share your thoughts or questions in the comments below. Your feedback matters!
Thanks for your support!
DYOR. NFA

BTC/USDT CHART UPDATE !!BTC has sustained its move above the descending trendline, indicating a valid breakout with continued bullish momentum.
The green zone between $92,000–$96,000 remains a critical support area. Any pullbacks into this region could present buying opportunities.
The 50-day SMA (red) at $98,596 is trending upwards, providing additional dynamic support.
BTC is trading above key moving averages, reinforcing the positive trend.
The chart suggests a potential pullback followed by a continuation to the upside.
The projected path (orange line) targets the $112,000–$116,000 resistance zone.
Assess volume during pullbacks to ensure strong accumulation support for the upward trend.
If you found this analysis helpful, hit the Like button and share your thoughts or questions in the comments below. Your feedback matters!
Thanks for your support!
DYOR. NFA

AVAX/USDT WEEKLY CHART UPDATE !!AVAX/USDT weekly chart shows a long-term bullish trade setup, indicating significant potential for price expansion.
AVAX/USDT is consolidating within a large symmetrical triangle. The upper trendline acts as resistance, while the lower trendline provides strong support.
The price is near the breakout point, indicating a potential resolution of the pattern.
The red moving average (likely the 50-week MA) is supporting the price, further strengthening the bullish outlook.
The large green arrow suggests a potential breakout towards $140–$160. This aligns with the technical measurement of the height of the triangle added to the breakout point.
Confirmation of the breakout will likely require increased trading volume and sustained momentum above the resistance line.
If the price fails to break out and drops below the lower trendline (around $25–$30), the bullish thesis will be invalidated.
If you found this analysis helpful, hit the Like button and share your thoughts or questions in the comments below. Your feedback matters!
Thanks for your support!

MANTA/USDT CHART UPDATE !! MANTA/USDT daily chart highlights a promising long-term trade setup with a strong bullish potential.
The chart shows an upward-sloping trendline that has been respected since the token’s inception. It serves as a crucial support level around $0.75–$0.80.
The price is consolidating near the trendline support, creating a low-risk entry zone for long positions.
A rapid bounce off this zone could signal the start of a strong upward move.
The chart indicates a large, bullish arrow towards $4.00, suggesting a potential 4x move upon exiting this accumulation phase.
The main resistance zones are near $1.50 and $2.50 before reaching the $4.00 target.
Risk Management:
If the price breaks below the trendline, it will invalidate the bullish setup, indicating caution.
If you found this analysis helpful, hit the Like button and share your thoughts or questions in the comments below. Your feedback matters!
Thanks for your support!
DYOR. NFA

BNB/USDT weekly analysis.The chart shows two rounded bottoms, which resemble an inverted head and shoulders pattern.
This pattern is typically a bullish reversal indicator, suggesting upward price movement.
The horizontal line marks a long-standing resistance level.
A breakout above this resistance would indicate strong bullish momentum, as seen in the recent price rise.
The projected move (indicated by the upward arrow) suggests a target price near $1,100.
This aligns with the measured move of approximately 75.54% calculated from the pattern’s neckline to its lowest point.
BNB is trading at $710.74 with a positive momentum of +2.51% for the current period.
This setup indicates strong bullish sentiment in the market. However, traders should consider a possible retest of the breakout zone (around $600) and manage risk with a stop-loss below the neckline to avoid an unexpected reversal.
Let me know if you’d like further assistance or adjustments!
DYOR. NFA
