Scalping ETH thesis investment Ethereum (ETH) Trading Thesis – Summary
Objective:
Take Profit (TP): $3,500
Stop Loss (SL): $3,440
Overview: Ethereum (ETH), the second-largest cryptocurrency, remains a leading platform for decentralized applications and smart contracts. As of December 24, 2024, ETH shows strong growth potential driven by technological advancements and increased adoption.
Technical Analysis:
Take Profit at $3,500: Identified as a key resistance level based on historical data and Fibonacci retracement, indicating potential bullish momentum.
Stop Loss at $3,440: Placed just below recent support to minimize losses if the price declines.
Indicators:
Moving averages (50-day and 200-day) suggest upward momentum.
RSI nearing overbought levels signals strong buying interest.
Increasing trading volumes support the current trend towards the TP target.
Risk Management:
Risk-Reward Ratio: 1:1, balancing potential gains and losses.
Position Sizing: Limit risk to a small percentage of the portfolio (e.g., 2%) to manage exposure.
Diversification: Maintain a varied portfolio to mitigate overall risk.
Fundamental Catalysts:
Ethereum 2.0 Upgrades: Enhancements in scalability and efficiency bolster ETH’s value.
Growth in DeFi and NFTs: Increased demand from decentralized finance and non-fungible tokens sectors.
Institutional Adoption: Growing interest from institutional investors supports price stability and growth.
Potential Risks:
Regulatory Changes: New regulations could negatively impact ETH’s price and adoption.
Market Volatility: High volatility may trigger stop losses or limit profit potential.
Technological Delays: Setbacks in Ethereum’s development could affect investor confidence.
Conclusion: Ethereum presents a promising trading opportunity with a clear strategy to take profit at $3,500 and limit losses at $3,440. Effective risk management and ongoing monitoring of market and technical indicators are essential for capitalizing on ETH’s potential upward movement.
Disclaimer: This summary is for informational purposes only and does not constitute financial advice. Conduct your own research and consider your financial situation before making investment decisions.
Cryptoanalysis

Big Idea: Swing Trade Setup for SOLUSDT BINANCE:SOLUSDT is showing signs of a bullish reversal backed by the Momentum Reversal Indicator (MRI), along with key technical levels derived from daily, weekly, and monthly charts. This trade setup leverages trendline analysis, Fibonacci retracements, and RSI confirmation to identify an actionable swing long opportunity. BINANCE:SOLUSDT
Key Levels and Signals
Entry Point: Above $195 upon confirmation of a price flip (Green 2 > Green 1 on the daily chart).
Stop-Loss: Below the recent swing low of $180 .
Take-Profit: Target $228.95 , the TI Setup Trend Resistance level.
Risk-Reward Ratio: At least 1:2 , aligning with standard risk management practices.
Technical Analysis
1. MRI Signal Overview
A recent Non-Perfect Red 9 was detected on the daily chart, signaling potential trend exhaustion of the bearish movement.
MRI countdowns confirm that bearish momentum is nearing a conclusion, paving the way for bullish price action.
2. Support and Resistance
Support Level: Recent swing low at $180 , which aligns with local demand zones and key Fibonacci retracement levels.
Resistance Level: $228.95 , identified as the TI Setup Trend Resistance on the daily chart, acting as a natural take-profit target.
3. Confirmation Indicators
RSI: Look for oversold conditions (<30) or bullish divergence to validate the reversal.
Trendline Breakout: A break above $ 195 , coupled with a Green 2 closing above Green 1, confirms upward momentum.
Fibonacci Retracement: The 38.2% retracement level aligns with the identified resistance zone, adding confidence to the take-profit target.
The Trade Plan
Action: Go Long 🚀
Entry Trigger: Enter above $195 , only after confirmation of a price flip (Green 2 > Green 1).
Stop-Loss: Place below the swing low of $180 to manage risk.
Take-Profit: Target the next resistance level at $228.95 , where price may face selling pressure.
Trailing Stop-Loss: Use a trailing stop to lock in profits as price moves favorably.
Risk Management
This trade offers a well-defined risk-reward ratio with clear stop-loss and take-profit levels. Ensure that your total risk does not exceed your portfolio's limits, and adjust position sizing accordingly.
Conclusion
SOLUSDT presents an exciting swing trade opportunity with favorable bullish signals and technical setups. Watch for confirmation before entering, and be prepared to capitalize on this potential reversal.
📉 Let me know your thoughts or if you see additional confluences! 📈
💡 Disclaimer: This idea is for educational purposes only. Always conduct your own analysis before making any financial decisions.

AAVE Breakout Incoming? Altcoin Sentiment Turns Bullish!AAVE/USDT is currently trading around the resistance zone, and we anticipate a breakout as the price has been holding these levels for several hours.
Additionally, the decline in BTC.D and USDT.D indicates a flow of money into altcoins, further supporting the potential for a bullish move in AAVE.
Keep an eye on the breakout for confirmation!

#VETUSDT Ready For a Pullback or Will it Slide Down Further? Yello, Paradisers! Is #VeChain gearing up for a pullback, or are we looking at a potential retracement? Let’s dive into the details of this crucial setup for #VETUSDT:
💎#VET has been trading within a broadening wedge for months, with descending resistance and support lines guiding the structure. Recently, the price broke out of the wedge’s descending resistance, marking a key technical development. However, VET saw a massive profit taking and came back for liquidity capture.
💎The immediate resistance is resting at $0.060. A clean breakout above the $0.06067 resistance, confirmed with a daily close, could trigger an aggressive bullish rally. The possible targets following this move would be $0.08000 and potentially higher. Such a rally could attract fresh buyers and propel #VETUSD into a new bullish trend.
💎On the downside, the immediate support lies at $0.03811. Beneath this level, a strong demand zone exists between $0.03119 and $0.03811, which has previously acted as a reliable area for bullish rebounds. If the price revisits this zone, it could present an excellent opportunity for buyers to step in again.
💎A daily candle close below the $0.03119 demand zone would invalidate the bullish structure. Such a move could lead to further downside pressure, with the price likely targeting the $0.02000–$0.01500 levels. This scenario would also indicate a shift toward bear control.
Stay focused, patient, and disciplined, Paradisers🥂
MyCryptoParadise
iFeel the success🌴

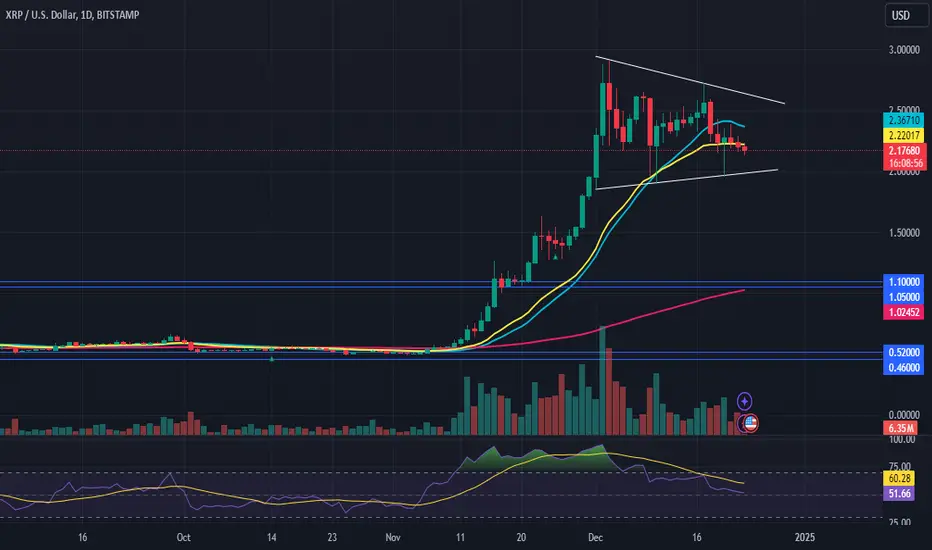
XRP – Bullish Flag Pattern Suggests Further Upside PotentialTechnical Overview:
Bullish Flag Formation: XRP is consolidating within a bullish flag pattern, typically indicative of a continuation of its prior uptrend.
Previous Rally: After surging from $0.60 to nearly $2.80, XRP has demonstrated strength by consistently holding support above $2.40, signaling accumulation rather than distribution.
Key Levels to Watch:
Breakout Point: A breakout above the flag's upper trendline, accompanied by increased volume, could confirm the bullish setup.
Targets:
Initial target: $3.00-$3.20, aligning with measured moves from the flag pattern.
Longer-term potential: Continuation above $3.20 could open doors to further price discovery.
Supporting Factors:
Long-Term Base: XRP’s breakout earlier in 2024 from a long-term base adds strength to the current bullish setup.
Volume Confirmation: Increased trading volume during the breakout would validate buyer interest and bolster the bullish case.
Risk Management:
Key Support: Maintaining support above $2.40 is critical for the bullish thesis. A breakdown below this level could signal invalidation of the pattern.
Conclusion: XRP's bullish flag pattern indicates potential continuation of its prior uptrend. A breakout above the flag's trendline with volume confirmation could set sights on $3.00-$3.20 and beyond, reinforcing Ripple’s strong bullish potential heading into 2024.
WLD ANALYSIS🚀#WLD Analysis : What Next ??💲
✅As we can see that there was a formation of "FALLING WEDGE PATTERN" in #WLD. We are expecting a bullish move in #WLD after a breakout of falling wedge pattern
🔰Current Price: $2.220
🎯 Target Price: $3.080
⚡️What to do ?
👀Keep an eye on #WLD price action. We can trade according to the chart and make some profits. Stay tuned for further analysis and stay updated with market sentiments and news.⚡️⚡️
#WLD #Cryptocurrency #TechnicalAnalysis #DYOR

THETA Long OpportunityMarket Context:
Several altcoins, including THETA, have retraced to their horizontal support levels, presenting a prime opportunity for a long position with favorable risk-to-reward.
Trade Details:
Entry Zone: Between $1.99 – $2.14
Take Profit Targets:
$3.10 – $3.35
$4.00 – $4.40
Stop Loss: Just below $1.70
This setup leverages THETA’s strong support level, providing clear upside potential while managing risk effectively. 📈

USUAL | UNUSUAL PUMPsUSUAL Suspects: The Stablecoin Revolution Nobody Saw Coming!
After 300% pump lets see whats unusual here
USUAL is like the cool kid of stablecoin projects focused on making secure, decentralized fiat stablecoins while letting the community call the shots. The magic happens with the USUAL token, giving users control over governance. Using multi chain tech, USUAL grabs Real World Assets (RWAs) from big league players like BlackRock and Mountain Protocol, turning them into USD0 a stablecoin that’s on-chain, transparent, and way more trustworthy than your flaky ex.
Why Is USUAL "Unusually" Cool?
1.Multi-Chain Mastery: Plays nice with multiple blockchains, so USD0 isn’t stuck on one network like your grandma’s ancient landline.
2.RWA Wizardry: Collects tokenized real-world assets from legit pros and backs the stablecoin like it’s guarding Fort Knox.
3.Power to the People: Governance is decentralized, meaning you (yes, YOU!) help steer the ship with the USUAL token
4.OnChain Transparency: USD0 is like that one friend who overshares—totally transparent and verifiable, plus it’s compatible with your favorite DeFi apps.
5. Community Takeover:It’s all about the users power, value, and decision-making are in your hands. No middlemen allowed.
USUAL’s Price Parade
- Today’s Price: $0.603 (up a spicy +23.8% in the last 24 hours).
- All-Time High: $0.632 (Dec 9, 2024 so close, yet so far at -4.57%).
- Supply Stats: 494.6M tokens circulating, with a max supply of 4B tokens.
- Trading Volume: $52.76M in the last 24 hours, traded across 2 markets and 4 exchanges (Binance being the star)
- Market Cap: $299M, grabbing 0.01% of the crypto market pie.
Basically, USUAL is doing the stablecoin hustle while keeping things unusually exciting

Bitget Token | BGB ( is the next BNB )BGB is 600% up since our first signal so its time to give it another look🔍
So, what’s this Bitget Token again ?
It’s a centralized exchange for crypto derivatives and spot trading. Bitget wants to make crypto trading so easy even your grandma could moonshot her portfolio! Their ultimate goal? Bridging Web2 and Web3, connecting CeFi and DeFi, and being the go-to portal for all things crypto—basically, the digital glue holding it all together. they got BGB token and wen exchange doing good the token will doing great
What Makes Bitget So Special ?
1. Cool Gadgets
- One click copy trading (copy the pros or MoonMaster, not your buddy who lost his private keys)
- Trade without converting tokens because math is hard.
- USDC margin derivatives.
2. Ironclad Security
- Risk control with hot & cold wallet segregation (because mixing wallets is like mixing tequila and milk never a good idea)
- 12 A+ ratings from SSL Labs, and it's backed by big tech names like Suntwin, Qingsong Cloud Security, HEAP, and Armors.
3. Top-notch Customer Service
- 24/7 multilingual support (crypto doesn’t sleep, so neither do they)
- VIP 1on1 support (you’re a big deal here)
- Reward centers, because everyone loves free stuff
Why Should You Care About BGB ?
1. Save on trading fees 15% discount just for using BGB as margin.
2. Flex those BGB tokens and get a 20% fee discount.
3. Collateral? Yep, BGB’s got you covered.
4. Exclusive perks: access to Bitget rewards, private circles, and all the cool-kid crypto stuff.
BGB successfully broke 1.3 and 1.7$ and thanks to BTC and it just showed to all exchanges who is the king of exchanges tokens
If you’re not already checking our signals these days, you might just miss the rocket while you're still tying your shoes 🚀

ROSE Long Spot Trade OpportunityMarket Context:
ROSE is showing renewed strength after rallying into its first resistance at $0.15. The price is now retracing towards the golden zone, with strong confluence at the 200-day EMA near the $0.085 support level. This setup presents a favorable risk-to-reward opportunity for an upward continuation.
Trade Details:
Entry Zone: $0.085 – $0.10
Take Profit Targets:
$0.18
$0.28
$0.42
Stop Loss: Daily close below $0.07
This trade combines a strong support zone with clear upside targets, providing a well-balanced setup for capturing further momentum. 📈

NEAR Long Spot Trade OpportunityMarket Context:
NEAR continues to demonstrate strength, presenting a solid opportunity for a long spot trade. The structure shows clear upward momentum, offering a favorable risk-to-reward ratio for entries within the identified range.
Trade Details:
Entry Zone: $5.85 – $6.50
Take Profit Targets:
First zone: $8.25 – $9.00
Second zone: $10.75 – $12.00
Stop Loss: Just below $5.50
This setup is well-defined, combining strong entry levels with clear profit targets while maintaining disciplined risk management. 🚀

Ethereum (ETH) – Bullish Outlook for 2025Technical Outlook:
Bullish Trend: Ethereum has confirmed a bullish trend across all time frames, indicating strength and continued upward momentum.
Resistance Zones: A breakout above the $4,100-$4,200 zone, forming part of a saucer pattern, could trigger a rally toward the $5,400-$5,600 region. This marks a key resistance level, and clearing it could set Ethereum on a path to new highs.
Long-Term Target: With the $8,000 target in sight for 2025, Ethereum holds substantial upside potential, especially if it continues to maintain bullish momentum in the short term.
Support Levels:
$3,300-$3,500: As long as Ethereum holds support above this range, the bullish momentum remains intact, with potential for further price appreciation.
Key Takeaways:
Bullish Setup: Ethereum's bullish trend is solidifying, and as long as it stays above critical support levels, the outlook remains positive.
Next Target: A breakout above $4,100-$4,200 could signal the start of a significant rally toward $5,400-$5,600, with the potential for even higher levels in 2025.
Long-Term Optimism: Ethereum is poised for strong gains in 2025, with an $8,000 target potentially within reach.
Conclusion: Ethereum's technical setup suggests a strong bullish continuation heading into 2025, with a focus on $4,100-$4,200 as a key breakout point for a rally toward new highs. Holding support above $3,300-$3,500 remains crucial for the bullish outlook.

Compound (COMP)
🔢 COMP Analysis
🔹 Overall Status:
The COMP coin, after following an ascending channel, successfully broke above the channel’s ceiling. At the PRZ zone (which includes the ascending channel ceiling and weekly resistance), selling pressure led to a price correction, pushing the price down to the 0.382 Fibonacci level.
✅ Key Point:
Stabilizing above the PRZ zone can accelerate price growth toward Fibonacci targets.
Trading volume in this area is crucial as it can provide stronger signals about the buyers' or sellers' dominance.
🔹 Support and Resistance Analysis:
1️⃣ Support Levels:
First Support: 0.382 Fibonacci level around $79-$81.
Second Support: 0.5 Fibonacci level around $68-$71.
Third Support: 0.618 Fibonacci level near $60-$62.
2️⃣ Resistance Levels:
PRZ Zone: Weekly resistance and broken ascending channel ceiling (around $92-$103).
Bullish Targets:
First Target: 1.618 Fibonacci level (already achieved).
Second Target: 2.618 Fibonacci level near $300-$330.
Third Target: 3.272 Fibonacci level around $500-$550.
Final Target: 3.618 Fibonacci level near $720-$750.
🔹 Price Movement Prediction:
1️⃣ Bullish Scenario (if price stabilizes above PRZ):
If the price stabilizes above $140 (PRZ zone), it may head toward the 2.618, 3.272, and 3.618 Fibonacci levels.
Increased trading volume above PRZ will confirm buyers' dominance.
2️⃣ Bearish Scenario (if the correction continues):
If the 0.382 Fibonacci level is broken, the price correction could extend to the 0.5 and 0.618 Fibonacci levels.
These levels could offer attractive opportunities for re-entry via laddered buying.
🔹 RSI and Entry Signals:
The RSI indicator on the weekly timeframe is at 72.71 (overbought zone), indicating possible selling pressure.
Positive Note: A bullish divergence between the price and RSI suggests the uptrend may resume after a correction.
The ascending RSI trendline can act as support.
✅ Conclusion and Recommendations:
1️⃣ Key Levels:
Supports: $79-$81 (0.382), $68-$71 (0.5), and $60-$62 (0.618 Fibonacci).
Resistances: $130-$140 (PRZ) and higher targets at $300-$330, $500-$550, and $720-$750.
2️⃣ Entry Strategies:
Laddered buying near 0.5 and 0.618 Fibonacci support levels if the correction continues.
Entry after price stabilizes above the PRZ zone ($130) with rising trading volume.
3️⃣ Risk Management:
Pay close attention to trading volume and price action near critical levels.
Monitor the RSI indicator to assess trend strength and identify potential corrections or continued growth.
💡 Final Recommendation:
In the current conditions, wait for technical confirmations (such as stabilization above resistance or corrections to lower levels) before entering. Prioritize capital management to minimize risks.

Ethereum (ETH)Ethereum Technical Analysis (ETH/USDT)
📊 Timeframe: Weekly and Daily
🔍 Current Status: Ethereum is in a long-term ascending channel and is currently attempting to break through its weekly resistance zone (red area).
📈 Bullish Analysis (Scenario 1)
Weekly Resistance and Price Stabilization:
Ethereum is currently facing weekly resistance (red zone).
Stabilizing above this resistance could pave the way for a new ATH (All-Time High).
Bullish Targets (Fibonacci Levels):
First target after breaking resistance:
Top of the ascending channel
Fibonacci 1.618 zone, which serves as a significant resistance.
If the channel’s top is broken, parabolic moves can be expected.
Further targets include:
Fibonacci 2.272 and 2.618 levels
Reaction to the Trendline:
By connecting the previous two highs of Ethereum, a trendline is formed.
Increased volume could trigger a price reaction to this line.
This trendline overlaps with Fibonacci 3.272 and 3.618 levels.
Achieving these targets will require significant capital inflows due to ETH’s high market cap.
RSI Indicator:
A rising channel is visible on the RSI.
Entry into the overbought zone could trigger a parabolic move towards the RSI channel’s ceiling.
If hype and volume increase, the RSI ceiling may break, extending into the overextended zone.
📉 Bearish Analysis (Scenario 2)
If Ethereum fails to break the weekly resistance:
A correction towards Fibonacci 0.382 and 0.5 levels is likely.
Failing to hold these levels may bring the price down to the lower boundary of the descending channel.
If selling pressure increases:
The price may move towards the weekly blue support zone.
🔗 Conclusion:
Ethereum is at a critical resistance level. Breaking and stabilizing above the weekly resistance could push ETH to higher Fibonacci targets and new ATHs. If the resistance holds, a correction towards Fibonacci support levels is possible.
📌 Key Point: High volume inflows and RSI movement will play a critical role in fulfilling the bullish scenario.
💎 Key Fibonacci Levels:
1.618 🔹 Initial Resistance
2.272 and 2.618 🔹 Higher Targets
3.272 and 3.618 🔹 Final Targets
📊 Daily Timeframe: Watch for potential corrections to Fibonacci 0.382 and 0.5 support levels.

Ethereum (ETH) – Bearish Divergence Signals CautionTechnical Outlook:
Bearish Divergence: Ethereum's daily oscillator continues to show reversal signals, suggesting weakening bullish momentum after recent highs.
Trend Status: Until ETH breaks decisively above recent highs, the current downtrend remains intact, signaling the need for caution among bulls.
Key Levels to Monitor:
Resistance: A breakout and close above $4,000 would signal renewed bullish strength and open new trade opportunities, particularly on any successful retests of this level.
Support: Failure to hold current levels could see ETH revisit $3,400-$3,600, a critical support zone.
Current Strategy for Bulls:
Exercise caution until a decisive break above recent highs confirms momentum reversal.
Watch for a potential buying opportunity on retests of $4,000 if breakout strength materializes.
Conclusion: The market remains at a critical juncture. Bulls need to stay patient and vigilant, awaiting confirmation of renewed upward strength before positioning aggressively.

#CFX Ready For a Massive Move Above Or Not? Key Levels to Watch Yello, Paradisers! Has #Conflux just kicked off its next bullish run or is this a fakeout waiting to trap traders? Let’s dive into the latest move in #CFXUSDT:
💎#CFX has recently broken out above the descending resistance of the broadening wedge—a major technical milestone. This breakout signals potential bullish momentum, with the price now eyeing key resistance zones for confirmation of a sustained move upward.
💎The immediate challenge for #Conflux lies at the $0.26-$0.29 supply wall. A daily candle close above this level would validate the breakout and likely trigger an extended bullish rally. Beyond this, the next target sits at the $0.4500–$0.5500 major resistance zone, where stronger profit-taking and selling pressure are expected.
💎If #CFXUSD manages to conquer the $0.2900 barrier, bullish momentum could carry it toward $0.6500 or even higher, establishing a new trend for long-term traders. Keep an eye on volume—an uptick in buying activity would confirm the strength of this breakout. In case of a pullback, immediate support lies at $0.1720, with a critical demand zone around $0.1356. As long as CFX holds above these levels, the bullish structure remains intact, and any dip into this zone could present an attractive re-entry point for buyers.
💎If #CFX closes below $0.1356, this would invalidate the bullish breakout, signaling potential downside. Such a scenario could drive prices toward $0.1000 or lower, erasing recent gains and catching overleveraged bulls off guard.
Stay focused, patient, and disciplined, Paradisers🥂
MyCryptoParadise
iFeel the success🌴

WIF Long Spot Trade (Consolidation Opportunity)Market Context:
WIF is currently consolidating in a favorable zone, offering an excellent opportunity to ladder into a long spot trade. With proper risk management and a clear upward target, this setup provides strong potential for upside continuation.
Trade Details:
Entry Zone: Around $2.90
Take Profit Targets:
First target: $3.50
Second target: $3.90
Stop Loss: $2.50
This trade setup presents a clear structure with defined risk and reward, aligning with current market conditions.

Can #High Bulls Sustain Current Bullish Momentum? Key Levels Yello, Paradisers! Is #HIGH gearing up for a massive breakout, or could we see a bearish trap unfold? Let’s uncover what’s next for #HIGHUSDT:
💎The breakout of #HighStreet from the descending channel formation marks a significant turning point. After months of being trapped in a bearish structure, the breakout above the descending resistance line signals a potential trend reversal. However, the $2.547 level now acts as a major resistance zone. A decisive close above this level is crucial for confirming bullish momentum and opening the path toward the next resistance target near $4.50–$5.00.
💎If buyers manage to take control and break through the $2.547 barrier, we could see an explosive rally into the $4.50-$5.00 resistance zone, aligning with the key levels of previous price action. This move would confirm the bulls are back in charge and could even set the stage for a larger bullish structure in 2025.
💎On the flip side, the $1.600 support level and $1.266 demand zone are critical areas to watch for potential bearish invalidation. A daily candle close below $1.266 would signal a breakdown of the bullish structure, likely driving the price back into the descending channel. This could trigger further selling pressure, pushing the market toward the $0.94 region or lower.
Stay focused, patient, and disciplined, Paradisers🥂
MyCryptoParadise
iFeel the success🌴

Will AUDIOUSDT Break Free or Collapse? Key Levels to Watch Yello, Paradisers! Is #AUDIOUSDT on the verge of a decisive breakout, or will it plunge below its critical support levels? Let’s dive into the details of #AUDIUS's analysis:
💎#AUDIO has been trading within a well-defined falling wedge pattern throughout 2024. However, recent price action is showing signs of potential bullish momentum. The price has broken above the descending resistance of the channel and is now retesting critical levels that could determine its next significant move above.
💎The key demand zone between $0.1260 and $0.1472 remains critical for maintaining a bullish outlook. As long as the price holds above this region, the chances of a reversal remain strong. Buyers will likely aim to push the price toward the next major level of $0.2492, where significant resistance awaits. A breakout above this resistance could ignite a rally, targeting the $0.3500–$0.4500 range and potentially higher levels.
💎On the flip side, caution is warranted if AUDIO fails to hold the demand zone. A daily candle close below $0.1260 would invalidate the bullish thesis and could lead to a sharp decline, exposing the price to sub-$0.1000 levels. This kind of move would likely shake out weak hands before the market finds stability again.
Stay focused, patient, and disciplined, Paradisers🥂
MyCryptoParadise
iFeel the success🌴

#POWR Ready For a Pullback or Will it Keep Falling? Key LevelsYello, Paradisers! Could #POWRUSDT be gearing up for a breakout, or will it fail to hold critical support levels? Let’s dive into the key areas of #PowerLedger:
💎#POWR has been trading in a descending channel formation for most of 2024, steadily making lower highs and lower lows. However, recent price action suggests a potential shift in momentum, signaling an opportunity for the bulls to step in.
💎The demand zone between $0.1856 and $0.2577 remains the critical level to monitor. This area has consistently provided strong support, and as long as the price stays above this zone, the bullish outlook remains valid. A sustained hold here would strengthen the case for a move higher.
💎If the price holds this demand zone and begins a reversal, the first target is the supply zone around $0.3500–$0.4500, which has acted as a key resistance in the past. A decisive breakout above this level could propel POWR toward its major resistance zone at $0.8000, opening up a potential rally to even higher levels.
💎That said, caution is essential. A daily candle close below $0.1856 would invalidate the bullish thesis and could trigger a sharp correction, exposing the price to further downside risk. In such a scenario, #POWR may revisit sub-$0.1350 levels, potentially shaking out weak hands before finding a new equilibrium.
Stay focused, patient, and disciplined, Paradisers🥂
MyCryptoParadise
iFeel the success🌴

ARB Long Spot Trade (Bullish Momentum with ETH Adoption) Market Context:
ARB is demonstrating bullish momentum in alignment with Ethereum’s adoption surge. A clear structure shift is evident, with ARB printing a higher high and reclaiming its range low. A retest of this range low and the 200-day EMA as support provides an ideal entry point.
Trade Details:
Entry Zone: $0.74 - $0.79
Take Profit Targets:
First target: $1.30
Second target: $1.80
Stop Loss: Daily close below $0.60
This setup combines strong technical confirmation and Ethereum’s broader trend, offering a favorable risk-to-reward opportunity.

#TLMUSDT Analysis: Are Bulls Ready to Take Control?Yello, Paradisers! Could #TLMUSDT be gearing up for a breakout, or will it fail to hold critical support levels? Let’s dive into the key areas of #AlienWorlds:
💎#TLM has been trading within a descending channel formation throughout most of 2024, consistently creating lower highs and lower lows. However, recent price action is showing signs of potential bullish momentum. The price has broken above the descending resistance of the channel and is now retesting critical levels that could determine its next significant move.
💎The demand zone between $0.01017 and $0.01523 remains a crucial area to watch. This region has consistently acted as a strong support, and as long as the price holds above this zone, the bullish narrative remains intact.
💎A strong rejection from this area could propel the price higher, potentially targeting the major resistance zone at $0.02400–$0.02800. This resistance is a key hurdle for bulls, and a confirmed breakout above $0.02800, supported by strong volume, could ignite a rally toward $0.04000 and beyond.
💎On the other hand, caution is warranted. A daily candle close below $0.01017 would invalidate the bullish structure and likely trigger a deeper correction. In such a scenario, the price could revisit lower levels around $0.00720 or even lower, signaling further downside risks and shaking out weaker market participants.
Stay focused, patient, and disciplined, Paradisers🥂
MyCryptoParadise
iFeel the success🌴

Crucial Moment for ETH/BTC- ETH/BTC is approaching the end of a symmetrical triangle formation on the daily chart, which began back in July 2022.
- The CM Williams Vix and Ultimate RSI indicators suggest that the bottom was established in late March 2023.
- Currently, ETH/BTC is testing a significant resistance line that has held strong since July 2017.
Additionally, considering the Bitcoin Dominance nearing a resistance point (see attached analysis below), it wouldn't surprise me if we witness a breakout for ETH/BTC, resulting in a decreasing Bitcoin dominance and Ethereum outperforming BTC at the moment.
I will conduct further analysis below using other timeframes
