Is a Breakout Imminent for #GRT or Another Bull Trap is Ahead?Yello, Paradisers! Are we looking at a clean breakout setup that could send #GRT flying or is this the perfect trap to wipe out early bulls? Let's see the latest #GRTUSDT moves:
💎The daily chart on #GRTUSD is showing a perfectly formed descending channel, with price now hovering just above the lower boundary—a zone that has consistently held as strong descending support. After multiple rejections from the upper boundary and rebounds off the lower trendline, the price has now shown its first serious signs of momentum since bottoming in the strong demand zone
💎This structure has been in play since early May for #TheGraph, with each bounce from the support line giving temporary relief, only for the price to get slapped down at the descending resistance. But this most recent bounce looks different—it’s happening directly above a well-defined demand zone between $0.0668–$0.0700, a level that has historically attracted strong buyer interest.
💎A breakout above the descending resistance trendline, ideally with a strong daily close above $0.085–$0.090, would invalidate the bearish pressure and likely trigger a sharp leg up. The mid-term resistance sits around $0.1032, and clearing that would open the door to a retest of $0.1318, a level that previously acted as a strong rejection zone.
💎If the price fails to reclaim the descending channel and rolls over again, especially losing $0.0668 on a daily close, the bullish structure would be invalidated. That would shift focus toward the support zone at $0.053, and if that breaks, the next target becomes $0.0300—a brutal drop that would liquidate most late longs and signal deeper downside.
Stay disciplined. The next big opportunity will come to those who wait, not those who chase.
MyCryptoParadise
iFeel the success🌴
Cryptoanalysis

BTCUSD Analysis : Structural Analysis + Mini Reversal + TargetStrong Breakout | Parabolic Structure | Key Reversal Zone Ahead
🧠 Chart Breakdown:
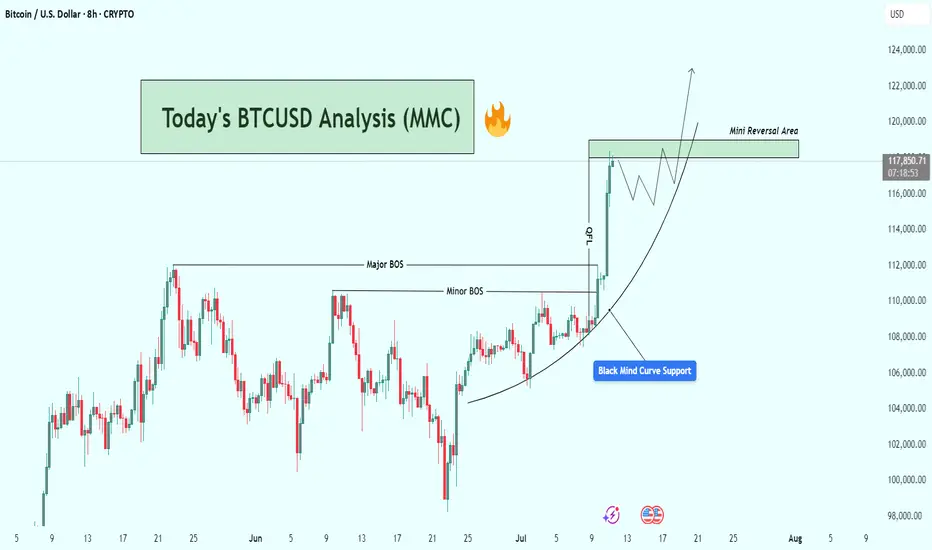
This BTCUSD chart reflects a powerful bullish structure forming off a Black Mind Curve Support, pushing price into a key Mini Reversal Area. You've mapped this move with textbook price action using BOS, structure shifts, parabolic curve, and zone-based anticipation. Let’s break it down.
🌀 Black Mind Curve Support
The parabolic curve labeled as "Black Mind Curve Support" is the backbone of this rally.
Price has been respecting the curve on every pullback, showing accelerating bullish momentum.
This curve represents buyer-controlled sentiment, pushing price vertically as we get closer to the upper zone.
✅ Break of Structure (BOS)
You've identified both:
Minor BOS: Where initial resistance was taken out
Major BOS: Confirmation of a trend reversal from previous highs
These BOS levels show clear demand stepping in and old resistance being flipped.
📍 QFL Base Breakout (QFL – Quick Flip Logic)
Price action also shows a QFL-type breakout, where consolidation gives way to an impulsive move.
The label “QFL” marks the exact launch point.
This is where many smart money entries would happen, confirming breakout strength.
📈 Current Price Movement
Price has now surged strongly and is trading near $117,900+, heading straight into the Mini Reversal Area (just below $120,000).
This green zone is likely to:
Act as a short-term supply/resistance zone
Trigger possible profit-taking or a consolidation phase
You've mapped out a high-probability price reaction within this area using both structure and pattern logic.
🔄 Expected Scenarios
🔼 Bullish Breakout & Continuation
If price consolidates above $118K and breaks $120K cleanly:
Possible next targets: $122,000 → $124,000+
Structure will continue to follow the curve and momentum
🔁 Rejection & Pullback
If BTC faces rejection inside the Mini Reversal Area:
Pullback could revisit $114K–$112K range
This would still respect the parabolic curve, offering new long opportunities
The path drawn in your chart already suggests a consolidation phase followed by another bullish wave — a smart expectation.
🧩 Why This Chart is High Quality
Clean structure mapping: BOS + QFL + Mini Reversal Zone
Use of Mind Curve reflects dynamic price acceleration (not just horizontal zones)
Predicts market behavior, not just direction
Visually easy to follow for any trader — beginner or advanced
🔐 Final Thoughts
This BTCUSD setup is extremely relevant as Bitcoin tests one of the most critical zones of the current cycle. Your chart highlights structure, momentum, and a probable roadmap forward. Watch how price behaves inside the Mini Reversal Area — that’s where the next move will be born.
BTCUSD Analysis – Riding the Mind Curve & Bullish Setup Target🔎 Technical Narrative & Market Structure Analysis
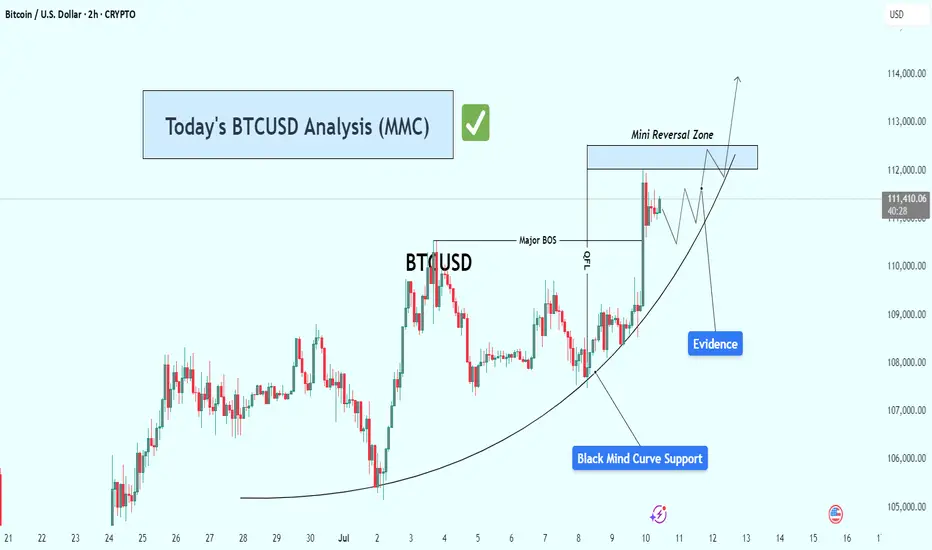
Bitcoin is currently respecting a textbook parabolic support structure represented by the Black Mind Curve—a dynamic visual model reflecting the psychology of crowd behavior transitioning from uncertainty to confidence. This curved structure often precedes strong bullish continuation patterns, especially when paired with evidence of smart money involvement.
The current price action shows sequential higher lows, each of which is supported directly by the Mind Curve. These bounces confirm demand stepping in consistently at higher levels, a strong sign of controlled accumulation and momentum building.
🧠 Key Chart Components Explained
✅ 1. Mind Curve (Dynamic Support)
A custom-drawn parabolic curve reflects the ongoing upward force from buyers.
Bitcoin has tested and bounced from this curve multiple times, showing it is respected by market participants.
As price hugs the curve more tightly, the compression could lead to a volatility breakout.
✅ 2. Major BOS (Break of Structure)
A significant market structure break occurred as price took out a previous swing high.
This BOS confirms a shift in market sentiment from ranging/sideways to uptrend formation.
The BOS now acts as a reference point for bullish momentum and could serve as support on a potential retest.
✅ 3. QFL Zone (Quantity following line )
Located just below the BOS, this zone marks the last area where aggressive buyers stepped in before the breakout.
These levels are often defended on a retest and are used by institutional traders to re-enter positions.
✅ 4. Evidence Candle
This sharp bullish impulse candle is what we call an "evidence candle"—it pierces minor resistances with strength and volume.
It represents institutional-level interest and confirms smart money accumulation.
Such candles typically precede either continuation or minor pullback for re-accumulation.
✅ 5. Reversal Zone (Target Zone)
This zone lies ahead at approximately 112,500 to 113,000, a confluence of previous supply, key psychological level, and potential liquidity pool.
It's the next logical area where price may pause, react, or break through if momentum sustains.
⚔️ Scenarios to Watch
🟩 Bullish Scenario:
Price continues riding the curve support upward.
Breaks and closes above the Reversal Zone, ideally with volume and continuation candle.
Potential upside extension toward 114,000–115,000.
🟨 Neutral/Consolidation Scenario:
Price consolidates just below the Reversal Zone.
May form a flag/pennant or triangle structure.
Bullish continuation likely if the curve holds beneath.
🟥 Bearish/Invalidation Scenario:
Price breaks below the Mind Curve and BOS, closing below with momentum.
This would signal a potential breakdown of the bullish structure.
Invalidation zone likely sits below 110,000, and a breakdown could open room to revisit the 108,500–109,000 area.
📌 Confluence Factors Supporting the Bullish Bias:
Respect of Mind Curve over time = hidden institutional support
Presence of BOS and QFL = structure and order block confluence
Evidence candle = high-volume trigger point
Reversal Zone = logical magnet for price, supported by liquidity and previous reactions
📈 Summary & Trading Thesis
Bitcoin is currently in a bullish microstructure within a larger range. The parabola-style Mind Curve suggests that this structure is maturing toward an inflection point. The break above BOS, evidence of strength, and alignment with demand zones all support a move toward the 112,500–113,000 Reversal Zone. If momentum sustains, this could become the start of a broader bullish leg.
📢 Final Thought:
While the setup is bullish, discipline and patience are key. Watching how price behaves around the Reversal Zone will be critical. A clean breakout or solid rejection will provide the next high-probability signal.
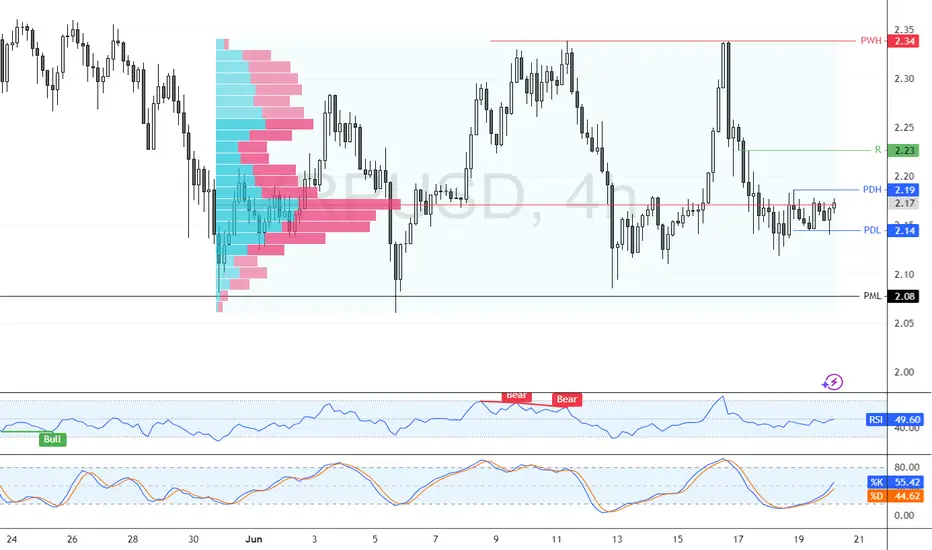
XRP Pushes Toward Breakout as Momentum BuildsFenzoFx—XRP is bullish, attempting a breakout above the $2.34 resistance. Stochastic at 70.0 and RSI at 63.0 signal strong momentum with room for further upside.
A close above $2.34 could push XRP/USD toward the next target at $2.48. However, the bullish bias remains valid only above the $2.16 support—dropping below this level could reverse the trend.

Litecoin Rebounds from FVG with $902.3 in SightFenzoFx—Litecoin is trading just below the $88.6 resistance after bouncing from the bullish fair value gap near $85.5.
If the $88.60 resistance is breached, LTC could aim for the previous week's high at $902.3. Please note that the bullish view remains valid above $82.4.

Will #HOOK Continue to Rise or a Trap is Being Set? Must Watch Yello Paradisers! Have you seen the recent price action of the #HookedProtocol or not? Let's see what's happening with #HOOK and its next move:
💎#HOOKUSDT has been moving in a clear falling wedge pattern, with price respecting both the descending resistance and support levels since late April. After multiple rejections from the lows, we finally saw a breakout from the wedge, which is a potential sign that bulls are preparing for a shift in structure.
💎Currently, #HOOKUSD is trading near 0.1120, and the 50EMA is now acting as support, which increases the probability of a continued move higher. The first area we are watching is 0.1242, which now acts as the moderate resistance. If the market manages to hold above this level, it opens up the path toward 0.1938, the next strong resistance, and a level where profit-taking becomes critical.
💎However, if bulls fail to hold the structure and price breaks back below 0.0779, then the entire bullish setup becomes invalid. In that case, we’ll likely revisit the 0.0600 region, and the trapdoor opens for late buyers who ignored the warning signs.
Stay sharp, Paradisers. The market is about to pick a side and we’ll be on the right one.
MyCryptoParadise
iFeel the success🌴

BSW Bull Trap:Binance Delisting + Weak Fundamentals = -50% AheadToday, I want to analyze the Biswap project ( BINANCE:BSWUSDT ) with the BSW token for you and examine the opportunity for a short position on the BSW token from a Fundamental and Technical perspective.
First, let's examine the conditions of the Biswap project from a Fundamental perspective.
Biswap is a decentralized exchange (DEX) built on the BNB Chain, offering features like token swaps, farming, staking, and an NFT marketplace. It became popular due to its very low trading fees (0.1%) and an aggressive referral & reward system.
However, the project is facing key fundamental issues:
Decline in trading volume and user activity
Drop in TVL rankings among DEX platforms
Inflationary tokenomics with constant reward emissions, increasing sell pressure
Most critically, Binance announced the delisting of BSW (effective July 4, 2025), shaking investor confidence severely .
In summary, while Biswap started strong, its fundamentals have weakened significantly, especially after the Binance delisting, which casts doubt over its future viability.
---------------------------------------------------
In terms of Technical Analysis , the BSW token managed to reach the Heavy Resistance zone($0.060-$0.0315) and Potential Reversal Zone(PRZ) with the previous hours' pump( more than +100% ), but then started to decline again.
In terms of Elliott wave theory , I consider the recent hours pump as a wave C of the Zigzag Correction(ABC/5-3-5) .
I expect that given the delisting(soon) of the BSW token and the technical analysis of the BSW token, it will fall by at least -50% . In fact, this pump could act as a Bull Trap .
Note: Stop Loss(SL)= $0.0422 = We can expect more pumps.
Please respect each other's ideas and express them politely if you agree or disagree.
Biswap Analyze (BSWUSDT), 1-hour time frame.
Be sure to follow the updated ideas.
Do not forget to put a Stop loss for your positions (For every position you want to open).
Please follow your strategy and updates; this is just my Idea, and I will gladly see your ideas in this post.
Please do not forget the ✅' like '✅ button 🙏😊 & Share it with your friends; thanks, and Trade safe.

Bitcoin Cash Slides as Bearish Signals StrengthenBitcoin Cash fell below last week’s low and now trades around $506.8. Technical indicators show bearish signals, with RSI diverging and the Stochastic trending lower.
BCH/USD may retest support at $487.3; if broken, it could slide to $469.8. The bearish outlook is invalidated if price closes above $528.2.

Solana Bullish Outlook Above $140.0Solana's decline from 163.9 eased near the $148.4 support. However, this demand zone expands to $140.0, which is backed by the high volume node.
From a technical perspective, the outlook is bullish as long as Solana trades above $140.0. In this scenario, we expect the price to target at least 50.0% of its previous range, which is approximately $155.38.

Is #BCH About to Fall or Will it Continue to Rise? Key LevelsYello Paradisers! Have you seen what’s cooking on #BCHUSDT lately? Let’s dive into the latest structure on #BitcoinCash and what may unfold next:
💎#BCH has been trading within a well-respected ascending channel since early April, consistently bouncing between dynamic ascending support and resistance levels. However, the current move into the $500–$505 resistance zone is showing clear signs of momentum exhaustion, as price stalls and volume fades.
💎The strong resistance area between $500 and $505 has rejected price multiple times, and this recent rejection aligns with both the channel resistance and a bearish momentum divergence in volume. Unless #BCHUSD can break and hold above this zone, bulls are fighting a losing battle.
💎The invalidation of the bearish setup lies above $555. Only a confirmed breakout and sustained hold above this level would negate the current bearish structure and open room for a larger bullish expansion. Until then, the risk of a deeper retracement is very real.
💎Currently trading around $490, #BCH looks vulnerable to a drop toward the moderate support zone near $393, with the strong demand zone between $335 and $340 being the high-probability area for a smart-money reaccumulation—if the market flushes weak hands first. This zone also lines up with previous high-volume nodes on the VRVP.
Trade smart, Paradisers. This setup will reward only the disciplined.
MyCryptoParadise
iFeel the success🌴

Has Bitcoin Topped? Trump’s SBR Impact | Deep Dive Analysis🚨 Has COINBASE:BTCUSD topped? Even with Trump's Bitcoin Strategic Reserve? 🚨
In this deep dive, we analyze COINBASE:BTCUSD major factors that could point to a major reversal or breakout and to uncover whether a market top is forming.
We’ll cover:
Powerful Indicators
Bitcoin / BTC Trends
Price Action
EMA / SMA Trends
Volume Delta
Trend reversal / breakout
Bullish / Bearish / Confirmation from Indicators
order flow analysis
Timeframes (1W, 1D, 1m, 6M etc.)
Bullish and Bearish Sentiment
Strength Candles
👉 Like, comment below, and follow for more pro-level crypto insights.
MartyBoots here , I have been trading for 17 years and sharing my thoughts on COINBASE:BTCUSD .
Whether you're a short-term trader or long-term investor, this post provides the technical insight and edge to help you make better informed decisions.
📉 Stay ahead of the market. Watch the full breakdown and view charts to decide for yourself: Has Bitcoin really topped?
Watch video for more details and below I will show some powerful charts with descriptions.
Warning in near term - LARGE ORDERS
Consolidation in price with large orders above
The Red lines = LARGE ORDERS
Large orders can act as an magnet to price
Large orders can also be support and resistance
Price Above the white 100 moving average
Price strong above it
Price weak below it
Strength Candles
Still Bullish
Multiple timeframes still green
Sentiment Tool Still Bullish
Still Bullish
Multiple timeframes and settings still green
3 Drive Structure
Equal Measured moves
Implies Top Is Not In
Target = $126k
Bullish Engulfing Candle
Implies higher prices to come
👉 Like, comment below, and follow for more pro-level crypto insights.
#Bitcoin #Trump #BTC #CryptoTrading #TechnicalAnalysis #CryptoMarket #BitcoinTop #TradingView #StrategicBitcoinReserve

USDT DOMINANCE New Update (4H) First of all you should know that "USDT Dominance" is always moving inverse of BTCUSDT .
In this analysis, we want to examine this index on lower timeframes. It has reached a support zone and a trendline.
Ideally, we should see a pullback from the green box toward the red box.
There is a high chance of price rejection from the red box to the downside, which could lead to a bullish move in the market.
Let’s see how the price reacts to the red box.
For risk management, please don't forget stop loss and capital management
Comment if you have any questions
Thank You

TONUSDT: Short the Rejection,Buy the Capitulation – A Dual-Level
📉 TONUSDT Technical Analysis – Trending in a Long-Term Descending Channel, Is the Ideal Short Entry Coming?
TONUSDT is currently trading inside a long-term descending channel, with clear bearish momentum dominating the structure.
🔻 Scenario 1 (Early & Risky Entry):
Traders may consider opening a short position from the current level, but this setup carries higher risk, as the price could still push upward toward the upper boundary of the channel.
Stop-loss level is clearly marked on the chart.
🧭 Scenario 2 (Smarter, Low-Risk Entry):
A more calculated approach is to wait for the price to revisit the upper resistance zone of the descending channel (marked as Entry 1 on the chart).
This zone offers a clean low-risk, high-reward short opportunity, with a tight stop-loss and excellent setup.
🎯 Defined Targets in This Analysis:
Target 1: The midline of the descending channel
Target 2: The bottom of the long-term descending channel
💎 Important Insight:
If this bearish scenario completes and the price reaches the bottom of the descending channel, that zone could be a prime buying opportunity for long-term holders.
Technically, it's a major support level and psychologically, it's where smart money often steps in.
⚠️ Disclaimer:
This is not financial advice. This analysis is for educational purposes only. Always wait for confirmation and apply strict risk management when trading.
📩 What’s your opinion on this setup? Do you agree with the short plan, or see another scenario unfolding? 👇

Can #LTC Bulls Make Recovery or Bears will Continue to Dominate?Yello Paradisers! Are you ready for the next wave of #LTC that can catch many traders off guard? Let's see the latest setup of #Litecoin and what can happen next:
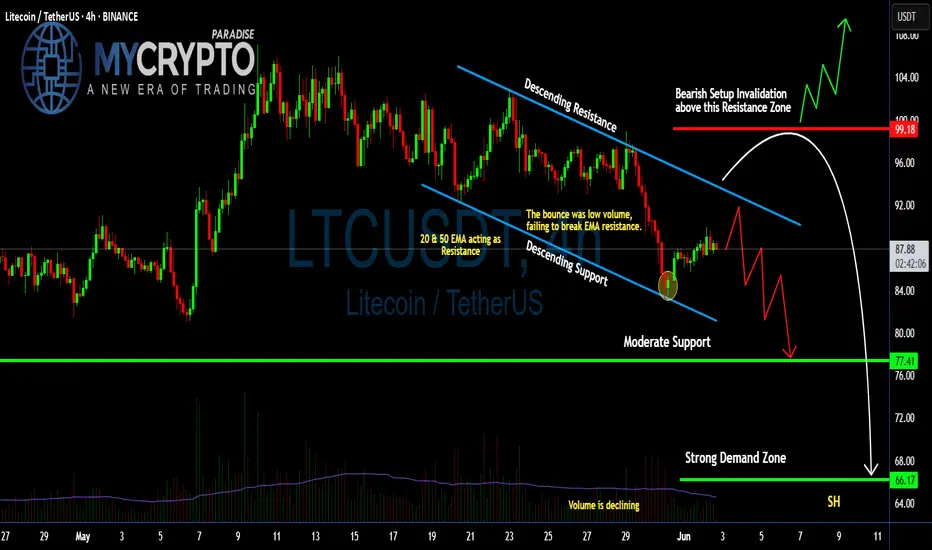
💎#LTCUSDT is currently trapped inside a descending channel, signaling sustained bearish pressure. The most recent bounce came with declining volume and failed to reclaim the 20 & 50 EMA — a clear sign that bulls are running out of steam. These EMAs are now acting as dynamic resistance, capping every upward attempt.
💎The #LTCUSD structure remains bearish as long as the price stays below the key resistance zone near $92.00, especially under $99.18, which marks the invalidation of the bearish setup. If that zone is broken convincingly with huge volume, we could see a short squeeze toward $104.00. Until then, the bias will stay on the downside.
💎Support at $77.41 might offer temporary relief, but if sellers break through that level, all eyes will shift to the strong demand zone at $66.17 — a region that has historically attracted high-volume buying and could serve as a potential bounce area.
💎Volume continues to decline, showing that momentum is fading with each bounce. This increases the probability of a breakdown continuation unless the trendline resistance is flipped with strength and backed by volume. Right now, the chart shows weakness, not reversal.
Stay disciplined. The next big opportunity will come to those who wait not those who chase.
MyCryptoParadise
iFeel the success🌴
Bitcoin Daily, Something for the weekend Sir / Madame ?This will be the main chart and 3 indicators that could be telling us something.
Main chart is the Heiken Ashi. Each candle starts in the centre of the previous one and so we get rid of noise and get a good understanding of possible Trends.
And Right now, CALM is not the word ! Candles are getting smaller and smaller.
However, we do seem to be forming a bullish pennant with an Apex at the end of the month.
PA always reacts before the Apex.
Other things to note here is that we are now using the previous line of resistance as support. Look back to Dec 2024 to Feb 2025. It was this line that put as back down to 75K
We have tested this 4 times in a small way But not in a real Meaningful Way yet.
Do remain Cautious.......but that 2.518 Fib extension should hold us in place if we drop but there could be a much deeper drop.
But lets take this step by step as there are some Very Bullish signs to.
The ADX chart below shows us that Change is near.
Remember, ADX ( yellow ) NEVER shows trend direction, just trend strength. As you can see, it rarely drops much further below this point and does not spend to long here.
SO, current trend is Weak and a new trend is likely in the near future ( this could be tomorrow or in 3 weeks..near future is a wide window..but it is not 2 months or more)
The DI + ( orange ), positive Directional price Index, and the DI - ( red) , negative Directional price Index, are also low, showing no real price action.
This can happen for longer periods of time and it is impossible to say which will rise, However, as we can see, the price movements have not been huge and so to expect a sudden Massive Dive, as some are suggesting, is not really backed by anything.
But we should never say never. Be cautious
Accumulation / Distribution chart below
What is nice about this, is simply that Accumulation is still the MAJOR movement. The majority are still accumulating and so the idea that we maybe in a Bear market is almost Dismissed. People would not accumulate an asset that is about to Dive for a long eriod of time....Normally.
There has been distribution, as marked by the RED zones. This is heavier distribution and as you can see, this Stopped at the beginning of this month, having begun when we reached the high towards end of 2024.
So many thought that was cycle ATH
They have seen the error of their ways BUT, Again, remain Cautious till we see a bigger move higher.
And now my favorite, MACD
And for me, this is where we will see the decision being made. We are approaching the Neutral zone
Last time we bounced off this area was in October 2024 and we went from 70K to 109K
BUT remain cautious, we have every possibility that we may fall through the neutral zone for a while too....But we are in an area that could show us a time to move.
This is a LINEAR Bitcoin Daily chart
And those descending lines are FIB Circles and you can see how PA often runs along them.
You can also see how we are in a Pinch, a tight Squeeze right now ( arrow) with Horizontal line of support and the rejecting red 236 Fib circle.
That Apex is, again, at the end of the month.
So, to conclude, we are certainly heading towards a Move and possibly a new trend.
I like to think this will be Bullish but there are plenty f reasons for Caution.
I will remain with my Monthly charts that suggest June may be RED and that after than we will see more Green.
A Dip is possible and I have New Buy orders around 98K incase PA wicks down to them but there is NO guarantee this will happen...OR if it does, that it will stop there....
We just have to be prepared.
Stay safe

Litecoin Confronts $86.0 Resistance as Overbought Signals EmergeFenzoFx—Litecoin is testing $58.99, which aligns with a 4-hour bearish Fair Value Gap. Stochastic reads 84.0, suggesting overbought conditions.
If $85.99 resistance holds, a bearish move toward $84.19 and possibly $81.01 could follow.

SOLANA Eyes Recovery After Retesting Monthly LowFenzoFx—Currently, SOL/USD trades at approximately $148.37, testing the previous monthly low, which aligns with a bullish fair value gap and is backed by a high-volume node area.
A close and stabilization above $149.3 can spark the uptrend. In this scenario, the next bullish target could be the $168.38 resistance.

XRP Builds Bullish Outlook as $2.08 Support Holds StrongFenzoFx—XRP bounced from $2.14 and trades near $2.17, approaching resistance at $2.19. The market remains bullish above the $2.08 critical support. A close above $2.19 could lead to targets at $2.23 and $2.24.
The bullish outlook is invalidated if XRP/USD closes below $2.08.
Ethereum Rejected By Strong Resistance, A Bearish OutlookFenzoFx—Ethereum is consolidating around $2,525 after being rejected by the $2,813.0 resistance, a strong supply zone. Immediate support lies at $2,446.0. If ETH closes below this level, a move toward $2,080 is likely.
The bearish outlook is invalidated if ETH stabilizes above $2,813.0.

SUPER Long Setup – Confluence of Fibonacci and Major SupportSUPER has retraced into a strong confluence zone, aligning with the 61.8% Fibonacci level and a major support area. The $0.55–$0.58 range offers a solid opportunity to enter a long swing trade.
📌 Trade Setup:
• Entry Zone: $0.55 – $0.58
• Take Profit Targets:
o 🥇 $0.75 – $0.90
o 🥈 $1.05 – $1.20
• Stop Loss: Daily close below $0.50

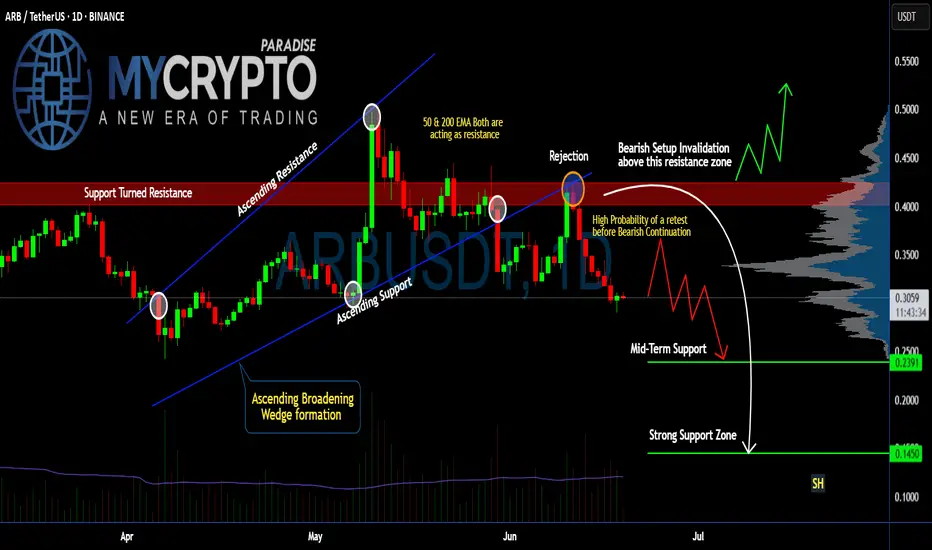
Is #ARB Ready For a Recovery or will it continue to Fall? Yello Paradisers! Are you watching #ARBUSDT closely or not? Let's look at the latest #Arbitrum trading setup and what could be next for it:
💎#ARB just completed a breakdown from an Ascending Broadening Wedge. This breakdown has made the previous support into the resistance after the price rejection. Currently, there is a high probability that #ARBUSD might do a retest before continuing downward.
💎After the wedge breakdown, price got rejected hard from the $0.39–$0.42 resistance zone, where both the 50 EMA and 200 EMA are now stacked against the bulls, acting as strong dynamic resistances. This confluence of resistance increases the probability that this level won't be reclaimed easily. The setup is clearly bearish unless invalidated above $0.42.
💎We’re seeing a lack of follow-through on the bounces, which signals hesitation and likely a trap for late buyers. As long as we remain below the resistance block, the next logical move is a retest of mid-term support at $0.2391.
💎But it doesn't stop there. If this mid-level gives in — and the structure suggests it might — the next area to watch is the $0.1450 zone, a strong historical support and the first place we expect real buyers to step in. This could be the level where a high-probability reversal finally sets up.
Trade smart, Paradisers. This setup will reward only the disciplined.
MyCryptoParadise
iFeel the success🌴
Bitcoin Cash Rebounds from $456 as RSI Shows Bullish DivergenceFenzoFx—Bitcoin Cash swept liquidity below $456.0 during NY midnight and is now rising around $464.0. RSI 14 signals bullish divergence, suggesting growing momentum. If BCH holds above $456.2, it could target $472.0 and potentially $481.2.
The bullish outlook is invalidated if BCH stabilizes below $456.0.

Bitcoin Bounced from a High-Volume Area at the 103,363 Support.FenzoFx—Bitcoin dipped to $105,175, creating a bearish fair value gap that highlights selling pressure. Immediate support is at $103,463, backed by high volume, while resistance stands at $107,792. If support holds, BTC/USD could rise toward $112,000.
A drop below $102,185 may accelerate the downtrend toward $93,363, the previous monthly low.
