ALERT: ALT SEASON INCOMING? 🚨 ALERT: ALT SEASON INCOMING? 🚨
Take a close look at the BTC/ETH chart — we’re seeing early signs of a major rotation out of Bitcoin and into Ethereum and altcoins. Historically, when the BTC/ETH ratio starts to fall, it's a clear signal that capital is flowing into altcoins, marking the beginning of alt season.
🔍 The ratio is showing bearish divergence and approaching a key support zone. If this level breaks, ETH is likely to outperform BTC significantly — and we all know what follows: altcoins explode.
📉 BTC dominance is stalling, ETH gaining strength, and altcoins are waking up. The market is shifting. Don't get caught late.
🚀 Get ready. The alt season might just be starting now.
#AltSeason #Crypto #BTC #ETH #TradingView #CryptoTrends
Cryptoanalysis

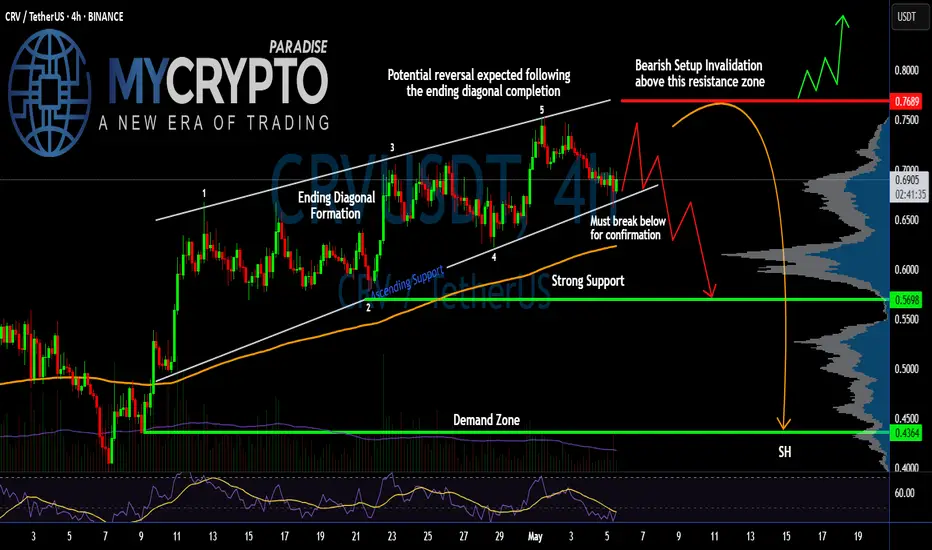
Is #CRV Ready for a Reversal or Not? Key Levels to Watch Yello Paradisers! Are we about to witness another brutal trap as #CRV finishes its final leg up and prepares to flush all late longs? Let’s break down the setup for #CurveDAOToken:
💎#CRVUSDT is currently trading around $0.6948, and what we’re seeing here is a classic Ending Diagonal Formation, a pattern well-known for luring in unsuspecting bulls before reversing violently. The structure has completed its five-wave sequence, and the price is now teetering just above key support.
💎The resistance zone near $0.7689 is where the whole game flips. This level has been clearly rejected before, and it now marks the invalidation point for any bearish outlook. A sustained move above this region with solid momentum would invalidate the diagonal and potentially send the price toward the $0.80+ mark. However, without that breakout, the bearish reversal remains the dominant scenario.
💎#CRVUSD is holding above rising trendline support, but this support is critical. A break below it confirms the end of the diagonal and should trigger a strong sell-off. The first target on a breakdown is the $0.5698 area, a zone previously respected and backed by significant volume profile interest.
💎If sellers gain traction and that level breaks down too, we’re watching for a move toward the demand zone at $0.4364, which aligns with the lower volume shelf—this is where the real pain could begin for over-leveraged traders caught on the wrong side.
Play it safe, respect the structure, and let the market come to you!
MyCryptoParadise
iFeel the success🌴
ORDIUSDT — channel, high risks, high rewards.ORDI is the first BRC-20 token based on the Ordinals protocol on Bitcoin. Since its launch in March 2023, the token quickly gained popularity and a significant market cap, being integrated into the Bitcoin blockchain. This integration is made possible through the Ordinals protocol developed by Casey Rodarmor. The protocol allows inscriptions - text, images, audio, or video - to be made directly on satoshis, the smallest unit of Bitcoin, giving Bitcoin new functionality that was not originally envisioned. You can now create NFTs and other digital assets and trade them directly on the blockchain.
____________
The token was listed at a fortunate time - late 2023 - amid overall market growth and positive sentiment. At the time, everything looked promising, but now the price has dropped by 94% from the zones where “hype was being sold.”
🔻 Structure:
The token is moving within a large descending channel. Recently, the price tested the outer support of this channel.
A local downtrend channel was also broken - its retest and a rise within the main trend are possible.
📊 Scenarios:
Retest and upward movement as part of a correction.
Consolidation in the current zone with a possible breakout to the upside.
Further decline amid overall negative market sentiment.
💥 Risks:
The token is traded on all major exchanges, including Binance. However, if it gets delisted (which has been happening more often recently), this is the main risk: loss of liquidity!
🎯 Approach:
With such tokens, it’s crucial to distribute volume wisely and accept risk in advance. I mark out interesting zones and place limit orders accordingly.
Considering the overall market and news backdrop, the token does have bounce potential, especially now that faith in the project is nearly lost.
💭 Opinion:
From my years of experience, I’ll say it again: the goal isn’t to guess where the price will go - it’s to be ready for it. Not everyone will understand that, but then again, not everyone consistently makes money in this market.
_________
📌 Not financial advice. This material reflects personal observations and a risk management approach.

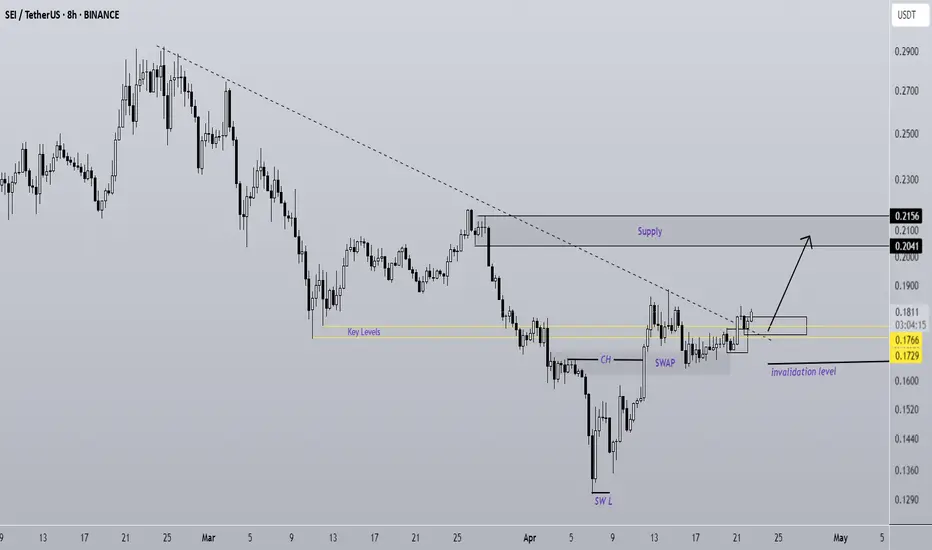
SEI Is A Rocket (8H)SEI has started a strong move from the bottom.
After breaking through a resistance zone with little to no reaction, it has now formed a SWAP zone.
Buy orders have been effectively transferred from the SWAP area into the candles, and the price shows strong momentum to push toward higher levels.
As long as the demand zone holds, SEI has the potential to reach the marked target area | or even go beyond it.
However, a daily candle closing below the invalidation level would invalidate this analysis.
Do not enter the position without capital management and stop setting
Comment if you have any questions
thank you
"Bitcoin traders... The real money is made BEFORE the breakout"🚨 Bitcoin (BTCUSD) Showing Smart Money Blueprint in Action!
Let's break it down clearly:
📈 Context:
After a period of compression, we got a strong liquidity sweep at the highs.
Price quickly rejected, causing a sharp market structure break.
📉 Downward Trendline + Liquidity Build-Up:
Notice how price has been hugging a descending line while leaving clear liquidity pockets ($$$) above.
This means Smart Money is trapping buyers into bad longs before the expansion.
📍 Critical Level: CRT Low (Current Range Low)
Price has aggressively returned to mitigate near the CRT Low area (marked red).
Perfect zone for Smart Money to reload before the next expansion.
📍 Entry Confirmation:
Watch for bullish reaction signs off the CRT Low.
If price holds above, we are likely to witness an explosive upside move targeting the previous liquidity pools.
🎯 Target Zones:
Immediate liquidity above (around $94,700 - $95,000).
Secondary target at CRT High area ($95,400+).
🧠 Market Psychology at Play:
CRT Low is a beautiful example of engineered liquidity, where emotional sellers are stopped out and Smart Money absorbs entries.
The goal is to trap the impatient and reward the patient.
⚡ Game Plan:
Be reactive, not predictive: Wait for bullish price action confirmation.
Partial profits at first liquidity zone, trail stop for extended targets.
R:R ratio on this setup is beautifully in our favor.
🚀 Risk Management Tip:
Risk only what you're willing to lose.
Even the best setups can fail — it’s part of the game.
Good trading is consistent execution, not perfection.
✍️ To sum up:
This BTCUSD chart is textbook Smart Money play:
Liquidity sweep ➡️ Break of structure ➡️ Mitigation ➡️ Expansion
If you time your entry well, this could be one of the cleanest setups into the weekly close! 🔥
➡️ Comment "BTC READY" if you're eyeing this move with me!
➡️ Save this post for future Smart Money analysis references!

#Near Ready For a Major Breakdown? Let's Breakdown Key Levels Yello Paradisers! Is #NEAR about to trap thousands of traders chasing this last move up, only to reverse and flush hard? Let’s take a closer look at the #NearProtocol setup:
💎#NEARUSD is trading at $2.585, slowly grinding higher within a clearly defined Ending Diagonal structure. This textbook formation often tricks even experienced traders into entering too early. The current wave count suggests we’re in the final leg, Wave 5 is still in play, but it’s unfolding suspiciously close to a heavy resistance zone, one that previously acted as strong resistance and rejected it.
💎This zone, sitting around the $2.80–$2.90 area, is the key pivot for this entire setup. The bearish structure would be invalidated if #NEAR manages to break and close above this resistance with conviction, especially backed by strong volume. That kind of breakout would suggest the market still has bullish momentum and could drive the price toward the $3.00 region or higher. However, without a convincing breakout, the odds are still skewed to the downside.
💎As long as the price remains under this critical resistance zone, the Ending Diagonal pattern remains valid, and history has shown how brutal the reversal from this structure can be. A failure to break out cleanly is likely to lead to a sharp and rapid decline. The first area of interest on the way down would be the $2.153 level, an important support that the price has reacted to in the past.
💎Should this level break, the door opens to a deeper correction targeting $1.819, where the Volume Profile begins to rise again and buyers have previously stepped in. Momentum indicators are also not aligning with the bullish case. The RSI is showing clear signs of weakening strength, failing to keep up with the price as the move extends into the final wave.
Play it safe, respect the structure, and let the market come to you!
MyCryptoParadise
iFeel the success🌴

INIT buy/Long Setup (4H)On INIT chart we do not yet have a bearish CH on the chart, and within the substructure, we can look for potential buy/long positions.
There is an unmitigated POI zone, and once the price reaches this area, we can look for buy/long setups.
The targets are marked on the chart.
A daily candle close below the invalidation level will invalidate this analysis
Do not enter the position without capital management and stop setting
Comment if you have any questions
thank you

XRP Can Potentially Target $2.50FenzoFx—Ripple found support at $2.12 and began a bullish move, currently trading near $2.197.
Technically, the next target is $2.355, provided the price holds above $2.120. A break above $2.355 could open the way to $2.500.
Bearish Scenario : If XRP/USD falls and stabilizes below $2.120, the next support is at $2.034. A drop below this level may trigger a decline toward $1.924.
***
>>> No Deposit Bonus
>>> %100 Deposit Bonus
>>> Forex Analysis Contest
All at FenzoFx Decentralized Forex Broker

LTC Holds Key Support, Eyes ResistanceFenzoFx—Litecoin bounced from the $81.80 support level and is currently trading around $84.60, just below the 50-period simple moving average. As long as LTC stays above $81.80, the outlook remains bullish, with potential to retest the $88.50 resistance.
A drop below $81.80 would invalidate the bullish view and could trigger a move toward the $77.40 support.
***
>>> No Deposit Bonus
>>> %100 Deposit Bonus
>>> Forex Analysis Contest
All at FenzoFx Decentralized Forex Broker

Ethereum Consolidates Near the 50-SMAFenzoFx—Ethereum remains in a bull market above the 50-period simple moving average, though momentum slowed after testing resistance at $1,857.0. At the time of writing, it trades around $1,812.0, consolidating near the 50-SMA.
As long as the price stays above $1,690, the outlook remains bullish. A close above $1,857.0 could push ETH/USD toward the next resistance at $1,957.0.
Bearish Scenario: A break below $1,690.0 would invalidate the bullish outlook and could trigger a drop toward $1,538.0.
***
>>> No Deposit Bonus
>>> %100 Deposit Bonus
>>> Forex Analysis Contest
All at FenzoFx Decentralized Forex Broker

Bull Trap – The Real Drop May Just Be Starting! (Crash Ahead?)The market appears to be gaining bullish momentum, giving the impression that the bear market is over—but what if it’s just getting started?
On this CRYPTOCAP:TOTAL chart, the current price action seems to mirror the 2021–2022 bear market cycle: a rally to new highs, a sharp drop, a deceptive recovery (bull trap), followed by a deeper correction and eventual accumulation.
If this pattern plays out again, we could be in the bull trap phase—right before a significant and unexpected drop.
What do you think?
Will history repeat itself, or are we heading to new highs?
Drop your thoughts in the comments!
Please support this idea with a LIKE👍 if you find it useful🥳
Happy Trading💰🥳🤗

HYPER Analysis (4H)From where we placed the red arrow on the chart, the HYPER correction has started.
This corrective pattern might be diametric, with wave E near completion.
By maintaining the green box, it could move toward the targets, which are marked on the chart.
A daily candle closing below the invalidation level will invalidate this analysis.
For risk management, please don't forget stop loss and capital management
When we reach the first target, save some profit and then change the stop to entry
Comment if you have any questions
Thank You

Is #LTC on the Edge of a Major Breakdown? Watch Key Levels Yello Paradisers! Is #Litecoin about to collapse after completing a suspicious Ending Diagonal pattern? Let’s dive into this critical setup on #LTCUSDT:
💎#LTC is currently trading around $87, sitting just below a major resistance zone between $92 and $97. Price has been moving inside a textbook Ending Diagonal formation, and based on the current structure, the 5th wave of this diagonal appears to still be unfolding—but the clock is ticking.
💎Volume has been fading even as price attempts to push higher, a classic warning sign deep inside a wedge. At the same time, momentum indicators are showing bearish divergence, hinting that the strength behind this up-move is running out of steam.
💎The red Resistance Zone above is absolutely critical. If #LTCUSD manages to break and hold above $96, the bearish setup would be invalidated, opening the path for a strong impulsive move toward $104 and beyond. However, unless that breakout happens with convincing volume, the odds strongly favor the downside.
💎If price fails to push higher, the first sign of confirmation will be a break below the ascending support trendline near $86–$84. A decisive move below this support would likely trigger a fast drop toward the next major support around $76. If that fails to hold, a full breakdown into the $64 region becomes very likely, as that's where strong historical demand exists according to the Volume Profile.
Play it safe, respect the structure, and let the market come to you!
MyCryptoParadise
iFeel the success🌴

Ethereum is Overbought at $1,835FenzoFx—Ethereum remains bullish, trading near $1,800 after a momentum slowdown at this level. A long-wick bearish candle has formed on the 4-hour chart, though resistance here is limited. Overbought readings on the Stochastic and RSI 14 suggest short-term saturation.
ETH is holding above key support at $1,755. Caution is advised—buying into an overextended market isn't ideal. A pullback toward $1,755 or $1,690 may offer better entry points if bullish signals appear.
The trend stays intact above the 50-SMA, with potential to reach $1,950. However, a drop below $1,565 could shift the bias to bearish, eyeing $1,470 and $1,370 next.

#HBAR Current Setup Showing Warning Signs | What's Next?Yello Paradisers! Is #HBAR teasing one last move up before everything collapses? Let’s break down what this suspicious structure on #Hedera is telling us:
💎#HBAR is currently trading at $0.183, sitting just beneath a heavy resistance zone around $0.190–$0.200. Price has been unfolding inside a clear Ending Diagonal structure—one of the most deceptive patterns in technical analysis. Wave 5 is still technically in play, but momentum indicators and volume behavior are telling a different story.
💎Volume has been steadily declining even as the price has been climbing, which is never a good sign this deep into a wedge pattern. On top of that, the RSI is pushing into overbought territory, showing that buyers are pushing the market higher, but with weakening strength behind them.
💎The resistance zone above current price is absolutely key. If #HBARUSD manages to break above the red zone and sustain momentum above $0.200, this would invalidate the current bearish setup and could open the door for an impulsive extension toward $0.220 and even higher. However, that scenario currently remains the less likely one unless we see a clear and strong breakout above the zone backed by volume.
💎Until then, bears are in control of the probabilities. The market structure favors a reversal from the Ending Diagonal, and if that plays out, the move could unfold quickly. First, we’ll be watching how price reacts at $0.142, which is the first major support and likely target if the wedge breaks down. A confirmed close below that level would likely lead to a continuation of the drop, with the next strong support zone near $0.125. This area has acted as a solid demand level previously and is also the region where the Volume Profile starts to spike again.
Play it safe, respect the structure, and let the market come to you!
MyCryptoParadise
iFeel the success🌴

BTCUSDT – Absorption in progress...📊 BTCUSDT – Absorption in progress, swing high targeted before a potential dump?
Price is moving in a clean bullish structure with a confirmed Break of Structure (BOS),
but under the surface, we can clearly see signs of absorption, which could signal an upcoming reversal.
📈 Open Interest is rising sharply
🟢 CVD Futures & Spot are both rising → real buying pressure
🔴 Funding remains negative
📊 85% of open positions are longs
🐋 Top traders are massively short
🧱 ➤ Clear absorption: price goes up… but someone is selling into it hard
🎯 Current hypothesis:
🧠 Longs are being absorbed,
suggesting a short-term rejection is likely,
but before that, price might push higher toward the swing high (92.5–93.5k) to:
Hunt liquidity
Trigger stop losses
Finalize the short trap
📌 Trade plan:
✅ Spike above the swing high
✅ Final absorption / wick trap
✅ Dump back into the Reload Zone (FIB 61.8–78.6%)
❗ Rule: don’t front-run – wait for confirmation:
Sharp rejection after the spike
Spot CVD divergence
Loss of structure + drop in OI
⚖️ The market is tense.
We are likely between the top of absorption… and the beginning of the flush.
Stay patient. Watch closely. Only act on clear confirmation.
🔽Fr🔽
📊 BTCUSDT – Absorption en cours
Le prix évolue dans une structure haussière propre avec un Break of Structure (BOS) validé,
mais les dessous du marché révèlent une absorption nette, qui pourrait annoncer un retournement.
📈 Open Interest en forte hausse
🟢 CVD Futures & Spot haussiers → pression acheteuse réelle
🔴 Funding négatif persistant
📊 85 % de longues sur le marché (Kingfisher)
🐋 Top traders en short massif
🧱 ➤ Absorption claire : le prix monte… mais la contrepartie absorbe tout
🎯 Hypothèse actuelle :
🧠 Une absorption des longs est en cours,
ce qui laisse penser qu’un rejet est probable à court terme,
mais avant cela, le marché pourrait encore pousser vers le swing high (92.5–93.5k) pour :
Chercher la liquidité
Déclencher les stops vendeurs
Finir le short trap
📌 Plan envisagé :
✅ Spike au-dessus du swing high
✅ Absorption finale / mèche piégeuse
✅ Dump en direction de la Reload Zone (FIB 61.8–78.6 %)
❗ Règle : ne pas anticiper – attendre confirmation :
Rejet brutal après le spike
Divergence CVD Spot
Perte de structure + chute OI
⚖️ Le marché est tendu.
On est probablement entre le haut de l’absorption… et le début de la purge.
Rester patient. Observer. Agir sur signal propre.

BTC/USD Rallies Above $82,140FenzoFx—Bitcoin has surged past $82,140 resistance and is now trading near $86,800, correcting 1.0% of its recent gains.
The bullish trend persists above the 50-period simple moving average, with immediate support at $86,140 offering a potential entry point for buyers. If this level holds, the uptrend could target $89,000.
Conversely, a dip below $86,140 might push prices toward $84,000 or $82,811.
>>> No Deposit Bonus
>>> %100 Deposit Bonus
>>> Forex Analysis Contest
All at FenzoFx Decentralized Forex Broker

BMT is a rockt ! (2H)It seems that a double bottom is forming, the previous bottom has been preserved, and an order block has formed, which has been broken to the upside. Additionally, a key level passes through this area.
On the chart, we also have a bullish CH (Change of Character). If the trigger line is broken, it will provide further confirmation for a bullish move.
As long as the demand zone holds, the price can move toward the targets.
However, the closure of a 4-hour candle below the invalidation level would invalidate this analysis.
Do not enter the position without capital management and stop setting
Comment if you have any questions
thank you

MEW Sell/Short Setup (4H)We have a supply zone from which a strong drop has previously formed. This zone has been tested once already, but with only minimal penetration. Given this shallow penetration and the price’s inability to make a lower low, we are once again expecting a potential short position from this zone.
We’re looking for a short position because the larger market structure is bearish.
If the price reaches the supply area, we’ll be looking to enter a position. We expect the liquidity pool below the chart to be swept, leading price to hit our targets.
However, if a daily candle closes above the invalidation level, this outlook will no longer be valid.
Do not enter the position without capital management and stop setting
Comment if you have any questions
thank you

Is #BNB About to Break Down or Not? Don't Get Caught Yello, Paradisers! Is #BNB teasing one last move up before the trapdoor opens? Let’s break down what this suspicious structure of #BinanceCoin is really telling us:
💎#BNBUSDT is currently trading around $589, which is right under 200 EMA resistance. The price has been developing inside a clear Leading Diagonal Formation. Here’s the twist: Wave 5 is still in progress, and there’s growing evidence that the move might fail before it even completes.
💎We’re seeing Bearish Divergence flashing on the MACD histogram, which historically signals fading momentum. This divergence could drag #BNBUSD down before Wave 5 finishes, causing an early breakdown of the entire structure. This would completely shift the market bias in favor of the bears.
💎Key resistance levels are stacked around $599, right under the 200 EMA. A confirmed breakout and hold above this zone would invalidate the bearish setup and open the door for a potential bullish extension above $620, but that scenario remains the less probable one for now.
💎Until then, all eyes are on support zones at $533 and the critical swing low at $471. If price closes below the diagonal’s lower boundary and drops beneath $533, it’s likely to trigger a heavy selloff toward the next major demand level at $471, which could form the next Swing Low.
Play it safe, respect the structure, and let the market come to you!
MyCryptoParadise
iFeel the success🌴

KAS ANALYSIS (12H)A significant trendline has been broken on the chart, and a bullish iCH formation has also formed. Additionally, a liquidity pool is visible above the chart, which is expected to be swept soon.
The demand zone is our entry area. If the price reaches this zone before touching Supply 2, we can consider entering a position.
A daily candle close below the invalidation level will invalidate this analysis.
Do not enter the position without capital management and stop setting
Comment if you have any questions
thank you

#PARTIUSDT is showing signs of a reversal🚀 The price BYBIT:PARTIUSDT.P is showing signs of a reversal after a prolonged downtrend.
🚀 The scenario becomes more likely if the price holds above $0.1520 with increasing volume.
🚀 Watch for a breakout and confirmation above the $0.1500–$0.1520 zone — this would strengthen the bullish setup.
🚀 If volume picks up during the continuation of the move, a quick push toward $0.18 is possible.
📈 LONG BYBIT:PARTIUSDT.P from $0.1533
🛡 Stop loss: $0.1492
🕒 Timeframe: 1H
✅ Overview:
➡️ The price has broken out above the Bearish Flag, confirming a break in the downtrend structure.
➡️ The Double Bottom formation increases the likelihood of an upward move.
➡️ Entry at $0.1533 is just above the resistance zone and confirms the breakout.
➡️ The upward potential remains toward $0.1600 and beyond, aiming for the POC volume area.
🎯 TP Targets:
💎 TP 1: $0.1555
💎 TP 2: $0.1575
💎 TP 3: $0.1600
📢 Support zone: $0.1500–$0.1510 — must hold to maintain the bullish structure.
📢 If price consolidates above $0.1555, expect a potential acceleration toward $0.1600.
📢 A drop below $0.1492 invalidates the scenario — stop is mandatory.
🚀 BYBIT:PARTIUSDT.P breaks key level — bullish signal confirmed! Watch for continuation!

BTCUSDT – Big Move Incoming, Key Level To watch!Bitcoin is approaching a key decision area after a few months of downward pressure. The chart shows a clear bearish structure with lower highs and lower lows. Recently, a possible double top has formed just below the major resistance near 88.668, which could suggest a short-term pullback if buyers don't step in.
If the double top plays out, a retest of the support zone between 78.576 and 82.000 is likely. This zone has held well in the past and could act as a strong base again.
However, if price manages to break and hold above 88668, that would be a strong signal of strength. It could mark a shift back to a bullish trend, with the next major target being the all-time high area around 108.360.
Key areas to watch:
Support: 78.576 to 82.000
Resistance: 88.668 and 108.360
Right now, Bitcoin is at a make-or-break point. A breakout could trigger a strong rally, while rejection may lead to another dip. Stay patient, watch how price reacts at these levels, and let the market confirm the next move.
