Can #AAVE Bulls Sustain the Current Momentum? Key Levels Yello, Paradisers! #AAVE looks bullish on the surface—but is this setup quietly setting up for a brutal dump? Here's the key level that will trigger the next big move:
💎#AAVEUSD is currently trading around $143.66, holding inside a clear ascending channel on the 4H timeframe. The price action of #AAVE has been respecting both the ascending support and resistance trendlines, forming higher lows and higher highs—but momentum is fading.
💎A bearish divergence on the momentum oscillator is signaling early weakness despite the price climbing higher. This divergence usually marks the beginning of a bull trap, where the price appears strong just before a sharp reversal.
💎The immediate resistance to watch is in the $156. This is where price was recently rejected, near the upper channel trendline. Above that, $156 remains the key Bearish Setup Invalidation level. A breakout and hold above this would invalidate any bearish structure and could lead to a push toward $170+.
💎However, if AAVE breaks below the ascending support, currently near $140, it opens the door for a sharp drop. The first target is the $126.10 support zone, followed by the $114.35 level, which aligns with a strong historical demand area.
Play it safe, respect the structure, and let the market come to you. Discipline, patience, and strategy are what separate long-term winners from short-term gamblers
MyCryptoParadise
iFeel the success🌴
Cryptoanalysis

Back to the Box — Classic Range Play on ATOMATOM has been moving within a well-defined sideways range between $4.03 and $5.08 for over two months now. Every time price touches the lower boundary, we’ve seen strong bullish reactions — and right now, we’re sitting right at that key support zone again.
I'm entering a long position around $4.281
💡 The idea here is simple: classic range trading setup with a clean invalidation point and an R:R close to 1:4.
📍 Entry: $4.281
🎯 Targets:
→ $4.325
→ $4.369
→ $4.426
→ $4.497
→ $4.569
❌ Stop: $4.029
More thoughts in my profile @93balaclava
Personally I trade on a platform that offers low fees and strong execution. DM me if you're interested.

PROMPT is still bullish (30M)This is a newly launched cryptocurrency, and it’s crucial to apply proper risk management due to its high volatility.
Currently, the coin is showing a bullish market structure, maintaining consistent higher lows, which indicates ongoing buying pressure. We've identified a demand zone labeled as a Spike Kink area, which serves as a strategic rebuy opportunity.
There’s a possibility of forming a new all-time high (ATH) if the bullish momentum continues. All price targets are clearly marked on the chart for easy reference.
Note: If a 1-hour candle closes below the defined invalidation level, this setup will be considered invalid, and a shift in market structure should be expected.
For risk management, please don't forget stop loss and capital management
When we reach the first target, save some profit and then change the stop to entry
Comment if you have any questions
Thank You

FARTCOIN/USDT – HIGH PROBABILITY SHORT FROM PREMIUM ZONEMarket structure shift confirmed with CHoCH, signaling bearish intent.
Price is retracing to fill the Fair Value Gap (FVG) — a premium zone where institutions are likely to re-enter shorts.
Entry: 0.8971 – 0.9010
Target: 0.8571 – 0.8264 – 0.7689
Stop: 0.9254
This is a high-RR setup with clean structure, imbalance, and trend alignment.
Entry in FVG with confirmation = sniper entry.
Targeting downside liquidity zones with ~1:3.5 RR.
Always do your own research, manage your risk, and use proper confirmation before entering any position. Trade responsibly.

ORCA/USDT – Futures Setup: Potential Short OpportunityORCA is currently testing a resistance zone at 2.940 USDT, an area where selling pressure has historically emerged. Price action indicates a potential rejection, setting up a possible short trade targeting lower support levels.
📌 Futures Trading Levels:
Entry Zone: 2.920 - 2.940 – short positions could be considered upon confirmation of rejection.
Stop-Loss: 3.075 – placed above resistance to limit risk exposure.
Take-Profit Targets:
First TP: 2.79
Second TP: 2.665
Third TP: 2.51
This structure aligns with futures trading principles while maintaining risk management. Let me know if you’d like further refinements! 🚀📊

RNDR/USDT – Double Bottom Formation Signals Reversal PotentialRender (RNDR) is currently forming a Double Bottom pattern, signaling a potential bullish reversal from recent lows. The pattern is validated if the price breaks above the Resistance Neckline at 4.200, confirming strength from buyers.
📌 Key Technical Levels:
Key Support: 3.235 – a critical level where price previously found buying interest.
Order Block (OB) Zone: 3.400 - 3.484 – potential demand area for renewed bullish momentum.
Strong Resistance Zone: 5.800 - 6.200 – historical selling pressure likely to be met if price continues upward.
A decisive break above the neckline could trigger a rally toward the Strong Resistance Zone, aligning with prior structural reactions. However, failure to sustain momentum might see retests of Key Support and the OB zone for liquidity gathering. Traders should monitor volume confirmation and price reaction at these critical levels.

TAO/USDT – Bullish Reversal Setup Taking Shape#TAOUSDT is showing early signs of a potential trend reversal following a prolonged downtrend. Price has recently rebounded from a key major support zone between $164 and $192, where a bullish divergence with the RSI has emerged—indicating a possible shift in momentum.
A well-defined descending trendline has been acting as dynamic resistance since the November 2024 high. Currently, price is approaching a critical resistance level around $284.7. A confirmed breakout above this area would be a strong signal that the market structure is beginning to shift in favor of the bulls.
If price breaks and holds above this resistance, the next upside targets are:
$468
$480
$495.9, in line with previous supply zones and structural highs.
Momentum is also improving, with RSI crossing back above the 50 level, supporting the bullish case. However, a clean breakout with sustained volume will be key to validating this setup.
Levels to Watch:
Support: $192.8 and $164.1
Resistance: $284.7, followed by $468–$495.9
Until we see a confirmed breakout, caution is warranted. Failure to clear the trendline may lead to another retest of support.
Summary:
#TAO is setting up for a potential bullish reversal, but confirmation above $284.7 is critical. A move beyond that level could open the door for a significant upside continuation. As always, manage risk accordingly and wait for confirmation.

MATIC/POL buyers beware; bearish signals in the mid-term (1W)The MATIC/POL pair has been dropping for over 1200 days from its peak price, but the structure suggests that a new bullish pattern may have started from the point where we placed the red arrow on the chart.
We’ve marked a supply zone on the chart that could reject the price downwards.
The minimum expectation is for the price to drop to TP1.
The best buying zone for MATIC/POL is the green zone at the bottom of the chart, which could push the price upwards by more than 500%. In fact, it is expected that wave A of the bearish pattern or X wave will end in this area, and the price will enter a mid-term or even long-term bullish phase.
A weekly candle closing above the invalidation level will invalidate this analysis.
For risk management, please don't forget stop loss and capital management
When we reach the first target, save some profit and then change the stop to entry
Comment if you have any questions
Thank You

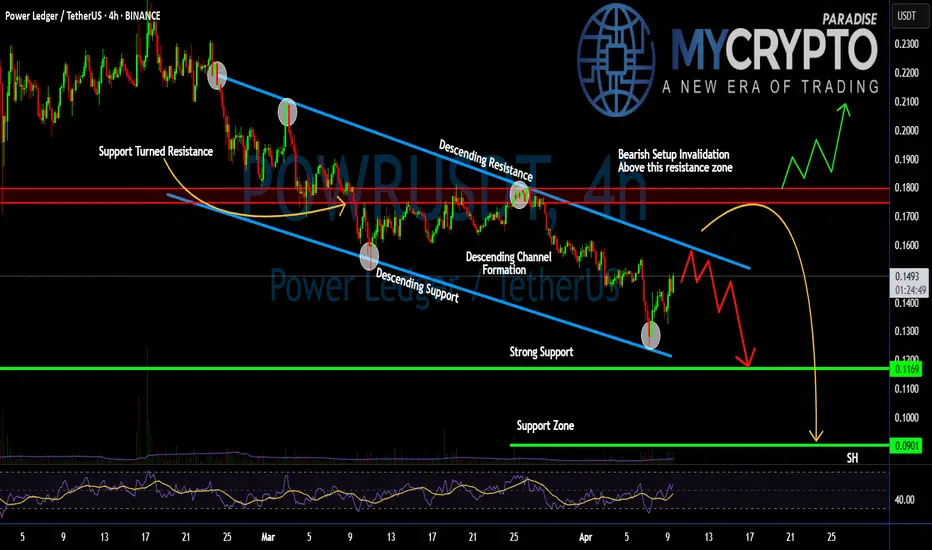
Is #POWR Bouncing Before the Breakdown? Don’t Get Caught Yello, Paradisers. Have you spotted how quietly #POWR is building up a sneaky trap? This move by #PowerLedger could wipe out impatient bulls and overly confident bears in one go:
💎#POWRUSDT is currently trading inside a clean descending channel structure, where both resistance and support levels have been perfectly respected over the past few weeks. The most recent bounce from the lower boundary (around 0.1169) was anticipated, but let’s be clear — this move is still within a bearish market structure.
💎The price is approaching a key resistance level near 0.155–0.160, which also aligns with the descending trendline. A temporary spike higher to test this area — even up to 0.179 — is likely, but don’t get fooled. These types of moves are often engineered to liquidate early short positions before the true direction resumes. Classic bull trap behavior.
💎As long as #POWR remains below the critical resistance zone at 0.180, there is no bullish market shift. This is the invalidation point for any bearish setup — and the price must close and hold above this level to suggest a sustained trend reversal. Until then, this is just another lower high in a broader downtrend.
💎On the downside, the key support levels to monitor are 0.1169, and then 0.0901 — where the strong historical support lies. If the price fails to hold 0.1169, a sharper markdown move into the 0.09 zone becomes increasingly likely. Volume remains muted and momentum indicators are not showing any strong reversal signals yet. Until we see a breakout and confirmation, every bounce is just an opportunity for the market to trap late longs.
Patience and precision are key in these conditions wait for strong confirmation before making your moves.
MyCryptoParadise
iFeel the success🌴
#VOXELUSDT is in an uncertain zone📊 BYBIT:VOXELUSDT.P Scenario – Potential for Movement in Both Directions!
🚀 BYBIT:VOXELUSDT.P is forming a bullish Falling Wedge pattern — a breakout to the upside could provide a great risk/reward long opportunity!
At the current stage, the BYBIT:VOXELUSDT.P market is shaping a scenario where both directions — long or short — are possible, depending on the reaction to key levels.
✅ Overview
➡️ The chart shows two key formations:
🔻 Bearish Pennant – a bearish continuation pattern, which has already played out to the downside.
🔻 Falling Wedge – a potentially bullish pattern, and price is now near the lower boundary of the wedge.
➡️ A weak bounce on volume is visible, and price is approaching a key resistance zone — a potential target if the wedge breaks out upward.
➡️ If the wedge plays out, a bullish impulse is expected.
Timeframe: 1H
📈 LONG BYBIT:VOXELUSDT.P from $0.03406
🛡 Stop loss: $0.03322
🎯 TP Targets:
💎 TP 1: $0.03456
💎 TP 2: $0.03526
💎 TP 3: $0.03586
➡️ This scenario becomes viable if price breaks and consolidates above the $0.03126–$0.03200 zone, opening the path toward the POC zone at $0.03676.
➡️ Volume should increase on the breakout to confirm momentum.
📉 SHORT #VOXELUSDT from $0.03016
🛡 Stop loss: $0.03126
🎯 TP Targets:
💎 TP 1: $0.02960
💎 TP 2: $0.02900
💎 TP 3: $0.02860
➡️ This scenario activates if the price fails to rise and pulls back below $0.03000.
➡️ Volume should confirm seller pressure.
➡️ The chart shows lower highs — risk of further decline remains.
📍 The price is currently in a critical decision zone , between the short entry level and the potential breakout zone for a long.
📍 The support below is strong — it has held the price several times already. No clean breakdown has occurred yet, which increases the chances of the wedge breaking upward.
📍 Avoid rushing into a position — wait for a clear confirmation in either direction (e.g., strong impulse on volume and consolidation above/below key levels).
📢 General advice on this asset:
📢 Wait for direction confirmation — both long and short setups are valid.
📢 Stay flexible and adjust to the move.
📢 Manage your risk carefully — do not enter without a signal.
🚀 BYBIT:VOXELUSDT.P is in an uncertain zone — the signal could play out in either direction. Watch the key levels and enter only after confirmation!

Bitcoin Signal for Short Lets Make Some Real GameThis is an educational trading setup for Bitcoin (BTC/USD), focusing on a short position opportunity between the $82,000 and $80,000 price levels. The analysis is based on technical indicators, price action strategies, and current market sentiment. Please note: this is not financial advice, strictly for learning purposes!
📉 Trade Concept:
Entry Zone: $82,000
Target Zone: $80,000
Setup Type: Short / Sell
Timeframe: Short-term / Intraday
Market Context: After an extended bullish rally, BTC/USD is showing signs of exhaustion near key resistance. High probability retracement expected towards the $80,000 support area.
🔍 Educational Insights:
Technical Indicators: Overbought RSI levels, bearish divergence, and candlestick reversal patterns around $82,000 zone.
Psychological Levels: $80,000 is a major psychological number where buyers may step in.
Risk Management: Always use stop-losses and proper risk-reward ratios in live trades.
💡 Purpose of Sharing:
This setup is shared purely for educational purposes to help traders understand how to spot potential short opportunities in volatile markets like Bitcoin. Learn how to analyze resistance zones, manage risk, and read price action effectively.
📢 Disclaimer:
This is not financial advice. For educational purposes only. Always do your own research and consult with a professional before making financial decisions.
#Bitcoin #BTCUSD #CryptoAnalysis #ShortTrade #BitcoinSignal #PriceAction #Educational #TradingStrategy #TechnicalAnalysis #CryptoEducation #LearnTrading #RiskManagement

Will #SHIB Continue Pumping or a Bull Trap is Waiting for Bulls?Yello, Paradisers! Will #SHIBUSDT continue flying, or are we about to witness a brutal rejection straight into the demand abyss? Let’s break it down.
💎#SHIB has recently broken out of a Descending Broadening Wedge Formation on the 4H chart, a pattern that historically signals potential bullish reversals. This breakout was strong, but the price has now hit a critical Supply Zone between 0.00001530 – 0.00001650, and has already shown signs of rejection from this area.
💎The structure shows #SHIBUSD facing Strong Resistance just below 0.00001711—a level that acts as Bearish Setup Invalidation. If the price closes decisively above this zone, bears will lose control, and we could see a sharp squeeze up toward 0.00001900.
💎However, the more probable scenario for now is a retest and rejection from the supply zone, followed by a deeper pullback. Based on volume profile and historical price behavior, the Support Zone around 0.00001181 is a key level to watch for a possible bounce. If this level is lost, SHIB could fall to sweep the swing low (SH) at 0.00001081 to complete a liquidity grab before resuming any bullish trend.
💎RSI is currently near overbought territory, suggesting SHIB may be due for a short-term correction or consolidation. This lines up with the visual expectation of a potential ABC correction back into support, where Wave A has started and Wave B might complete soon.
Patience and precision are key in these conditions wait for strong confirmation before making your moves.
MyCryptoParadise
iFeel the success🌴

#FILUSDT remains under bearish pressure📉 SHORT BYBIT:FILUSDT.P from $2.616
🛡 Stop loss $2.645
🕒 1H Timeframe
⚡️ Overview:
➡️ The POC (Point of Control) BYBIT:FILUSDT.P is located at $2.766, far above the current price — this highlights strong historical selling pressure.
➡️ Price is forming lower highs and lower lows, confirming a bearish trend.
➡️ The breakdown below $2.616 triggered the short setup with further downside potential.
➡️ Volume spikes during red candles indicate continued seller activity.
🎯 TP Targets:
💎 TP 1: $2.605
💎 TP 2: $2.584
💎 TP 3: $2.570
📢 Watch the $2.616 zone — holding below increases downside probability.
📢 If price moves above $2.645, the setup becomes invalid.
BYBIT:FILUSDT.P remains under bearish pressure — short bias stays valid under current structure.

#LAYERUSDT setup remains active 📉 LONG MEXC:LAYERUSDT.P from $1.5722
🛡 Stop loss: $1.5440
🕒 Timeframe: 1H
✅ Market Overview:
➡️ The coin is showing "its own game" — price action is independent of #BTC and #ETH, reacting to internal volume dynamics.
➡️ Ascending triangle breakout with a confirmed close above the key $1.5440 zone.
➡️ Empty space ahead — no major resistance levels until $1.6060–$1.6210.
➡️ Accumulation is forming between $1.5440–$1.5700 — a breakout may follow.
➡️ Important: candles must close above $1.5440 to confirm the long scenario.
🎯 TP Targets:
💎 TP1: $1.5880
💎 TP2: $1.6060
💎 TP3: $1.6210 (full measured move from triangle pattern)
📢 Recommendations:
If volume MEXC:LAYERUSDT.P increases during a breakout above $1.5722 — expect a rapid move.
If price pulls back — the $1.5254 area could offer a second entry opportunity.
The coin looks strong but slightly overbought — partial take profit at TP1 is advised.
📢 A strong breakout above $1.5700 may lead to a sharp move due to lack of resistance.
📢 Avoid 1H candle close below $1.5440 — scenario invalidation.
📢 If the move occurs on weak volume — watch for a potential reversal near TP1.
🚀 MEXC:LAYERUSDT.P setup remains active — holding the key level could lead to a move toward TP2–TP3!

#ATOMUSDT shows a strong bullish impulse 📈 LONG BYBIT:ATOMUSDT.P from $5.100
🛡 Stop loss $4.948
🕒 4H Timeframe
⚡️ Overview:
➡️ The POC (Point of Control) BYBIT:ATOMUSDT.P is at $4.628, which marks the high-volume area from which the current bullish move started.
➡️ A breakout above the $5.00 resistance occurred with strong volume, confirming bullish strength.
➡️ The upward move is supported by large green candles and rising trading activity.
➡️ The $5.100 entry level aligns with previous consolidations and acts as a flipped support.
🎯 TP Targets:
💎 TP 1: $5.188
💎 TP 2: $5.280
💎 TP 3: $5.350
📢 Watch for price holding above $5.00 — it’s key for continued upside.
📢 If price drops below $4.948, the long setup becomes invalid.
BYBIT:ATOMUSDT.P shows a strong bullish impulse — confirmation via volume and breakout supports the continuation scenario.

#TRUMPUSDT — Breakdown or Reversal Confirmation🚀 BYBIT:TRUMPUSDT.P — Breakdown or Reversal Confirmation? Full Breakdown on 1H & 4H!
Let’s start by analyzing the charts on different timeframes:
✅ On the 1H chart , we clearly see a reversal pattern — Inverted Head & Shoulders — and the neckline breakout has already occurred. The volume on the breakout is high, which confirms the strength of the signal.
➡️ The target for this pattern is around $10.75–$10.80, which also aligns with the upper VPOC level from the previous range.
➡️ The POC level for BYBIT:TRUMPUSDT.P is $10.159, which may now act as support — this can be a potential entry zone.
➡️ Nearest resistance is at $10.40. A breakout above this level could trigger an impulse move towards $10.75–$10.80.
✅ On the 4H chart , a bearish flag is forming, which could potentially push the price lower — but this scenario hasn't played out yet.
➡️ There's also a local double bottom, confirmed by a price bounce. A retest of the flag’s lower boundary will be a key moment.
Let’s break down the patterns:
✅ 1. Inverted Head & Shoulders (1H) – A classic bottom reversal formation.
➡️ The neckline breakout occurred on increased volume — a key confirmation for a long setup.
✅ 2. Volume (Volume Profile & Bars) – Strong volume spike during the breakout confirms buyer interest.
✅ 3. Price broke out of consolidation – We’ve seen an impulsive breakout and the price is holding above the neckline.
✅ 4. Local Market Structure Break (MSB) – A shift from local downtrend to an emerging uptrend.
📍 Key Point: If the price holds above $10.40, this confirms a breakout from the descending channel, increasing the chance of reaching $10.75–$11.00.
📍 Price must also stay above $10.15 and not fall back into the previous range. A retest and bounce from this level would serve as further confirmation.
📢 If the price drops back below $10.15 and breaks $9.87, the “Inverted Head & Shoulders” pattern will be invalidated. In that case, a bearish trend will likely resume and a short toward $9.50–$9.00 could be considered.
📢 On the 4H chart, the risk of the bearish flag playing out still remains. We are monitoring the structure closely — a sharp pullback is possible.
📢 The volume zone around $10.15–$10.20 is key. As long as the price stays above it — the long scenario remains dominant.
🚀 As of now, BYBIT:TRUMPUSDT.P has strong technical reasons to support a long bias, especially if it holds above $10.40 — that would open the door to $10.75–$11.00.
Risks remain — particularly around the 4H bearish flag — but for now, bullish momentum prevails.
🚀 BYBIT:TRUMPUSDT.P still holds upside reversal potential — LONG scenario remains the priority!

TIAUSDT - analysis of the downtrend phase and potentialProject :
Celestia is one of the key players in the new generation of modular blockchain architecture. Unlike traditional monolithic solutions, it separates the execution and consensus layers. This provides flexibility, scalability, and creates the infrastructure for rollup and L2 ecosystems.
📍 CoinMarketCap: #47
📍 Twitter (X): 397.7K
____________________________________________________________
🔎 Technical picture :
I marked the Seed / Series A / Series B zones on the chart — it's clear how early investors locked in massive profits: from listing, the price skyrocketed +634%, and their returns are many times higher!)
From the current levels, the price is down ~87% from its all-time high.
Formation: the price is moving inside a large descending channel. At the same time, a potential “cup” structure and a possibly emerging ascending channel are forming.
We are close to the lower boundary of these formations — it's an interesting zone.
A final sweep/fakeout toward the lower boundary of the descending channel is possible — keep this in mind when calculating risk.
Key level: the orange trendline marks the boundary of the secondary trend. A confident breakout and hold above it would be one of the reversal signals.
____________________________________________________________
💡 General conclusions :
Liquidity — solid.
The coin is traded on major exchanges.
Trend potential is marked on the chart.
As always — everything depends on your strategy and patience.
____________________________________________________________
📌 This review is not financial advice but my personal analysis and observations on the project.

#ETHUSDT is showing a reversal pattern📊 BYBIT:ETHUSDT.P is showing a reversal pattern — we expect the uptrend to continue if the breakout level holds!
🕒 Timeframe: 4H
➡️ BYBIT:ETHUSDT.P has formed a potential Double Bottom (Bottom 1 and Bottom 2) around $1,785–$1,809, indicating a possible trend reversal.
➡️ The key trading range (POC — Point of Control) is at $1,881.71, making it a major resistance level.
➡️ The price is also bouncing off the support zone, which aligns with the previous consolidation area.
➡️ Volume is increasing during the bounce, confirming buyers’ interest.
⚡️ Considering a potential long entry
⚡️ Maximum target based on the pattern — $2,522
📍 A breakout and hold above $1,849.71 will confirm the bullish scenario and attract more long liquidity.
📢 If the price drops below $1,785, the setup will be invalidated — high chance of a continued downtrend.
📢 The rise of BYBIT:ETHUSDT.P is possible due to reactions to the strong support zone and the forming Double Bottom pattern.
🕒 Timeframe: 1H
➡️ BYBIT:ETHUSDT.P has formed a Falling Wedge , which is a bullish pattern.
➡️ A second bottom ( Bottom 2 ) has formed, confirming a potential reversal.
➡️ The upper boundary of the wedge has already been broken, accompanied by a spike in volume.
➡️ A strong consolidation zone exists around $1,808–$1,820 — a retest could confirm a long entry.
⚡️ Holding above the wedge breakout is a signal for further upside.
📢 If the price falls back below $1,800 and buying momentum weakens — the scenario should be reconsidered.
📉 LONG BYBIT:ETHUSDT.P from $1851.0
🛡 Stop loss: $1835.00
🕒 Timeframe: 1H
🎯 Targets (TP):
💎 TP 1: $1860.00
💎 TP 2: $1871.00
💎 TP 3: $1882.00
💎 TP 4 (long-term target): $1890.00
🚀 BYBIT:ETHUSDT.P is maintaining a potential reversal pattern — we expect upward movement if volume confirms!

#AUCTIONUSDT shows continued buyer weakness📉 Short BYBIT:AUCTIONUSDT.P from $16.370
⚡️ Stop loss $16.735
🕒 1H Timeframe
⚡️ Overview:
➡️ The POC (Point of Control) is located at $17.734, indicating the highest volume area and now acting as a strong resistance.
➡️ Price BYBIT:AUCTIONUSDT.P continues to trade below the accumulation zone, confirming sellers' control.
➡️ After a local bounce, the chart shows a breakdown below $16.370 — this triggers a potential short setup.
➡️ Target zones are set near previous reaction levels, making them suitable for profit-taking.
🎯 TP Targets:
💎 TP 1: $16.165
💎 TP 2: $16.040
💎 TP 3: $15.850
📢 Watch for solid confirmation below $16.370 — this would strengthen the case for downside continuation.
📢 If price moves back above $16.735, the short setup is invalidated.
BYBIT:AUCTIONUSDT.P shows continued buyer weakness — downside movement is expected if pressure remains.

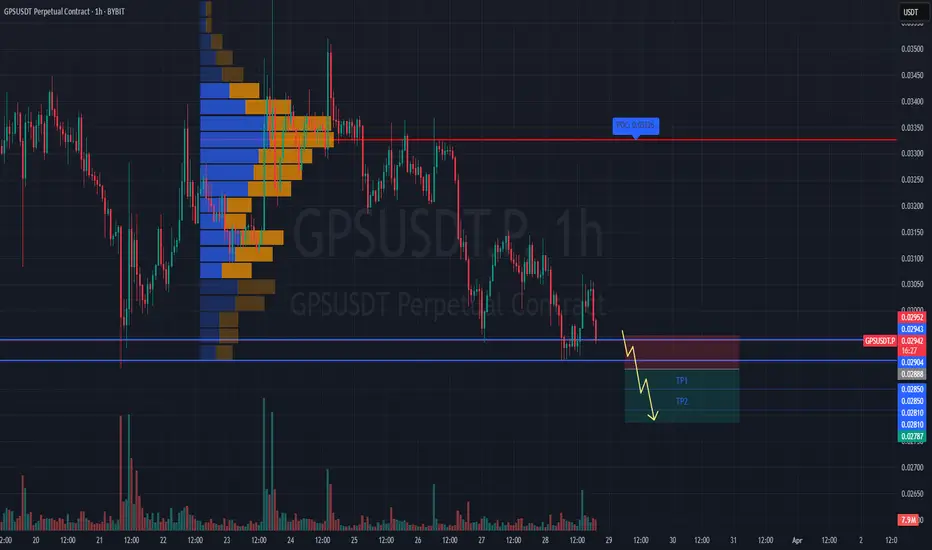
#GPSUSDT is forming a bearish structure📉 Short BYBIT:GPSUSDT.P from $0.02888
🛡 Stop loss $0.02952
🕒 1H Timeframe
⚡️ Overview:
➡️ The main POC (Point of Control) is at 0.03326, marking the highest volume zone and a major resistance above the current price.
➡️ The 0.02952 level acts as local resistance and an ideal stop placement.
➡️ Price BYBIT:GPSUSDT.P has already tested the $0.02888 support — a confirmed breakdown could trigger stronger downward momentum.
➡️ Volume is increasing on the decline, supporting the sellers' pressure.
🎯 TP Targets:
💎 TP 1: $0.02850
💎 TP 2: $0.02810
💎 TP 3: $0.02787
📢 Watch for a clean break of the $0.02888 level — it could be the entry trigger for this short setup.
📢 If price pulls back above $0.02952, the short scenario becomes invalid.
BYBIT:GPSUSDT.P is forming a bearish structure — continuation to the downside is expected if support fails.
Alternatively, Bitcoin just Drops to 73K in the near future In a slight contradiction to my previous post - as I like to consider ALL options and present them to you, so YOU can make up your own mind.
I saya SLight contradiction, as 73K is Still the target here.
See this channel AP is in? The descending channel we been in for a while.
We seem to be getting rejected off the upper trend line.
The lower line crosses the 1 Fib extension and Hits the rising Long term support around 73K
We do have Support just below the Current PA position on the POC ( Point of control) of the VRVP
So, Hang on and we wait to see what happens.
If PA returns to 78K and then 73K - DO NOT PANIC
This would be SUPERB buying opportunities
So, Consider all the possibilities I have sugested today, Make up your own minds and, if you want to, please do leave a comment

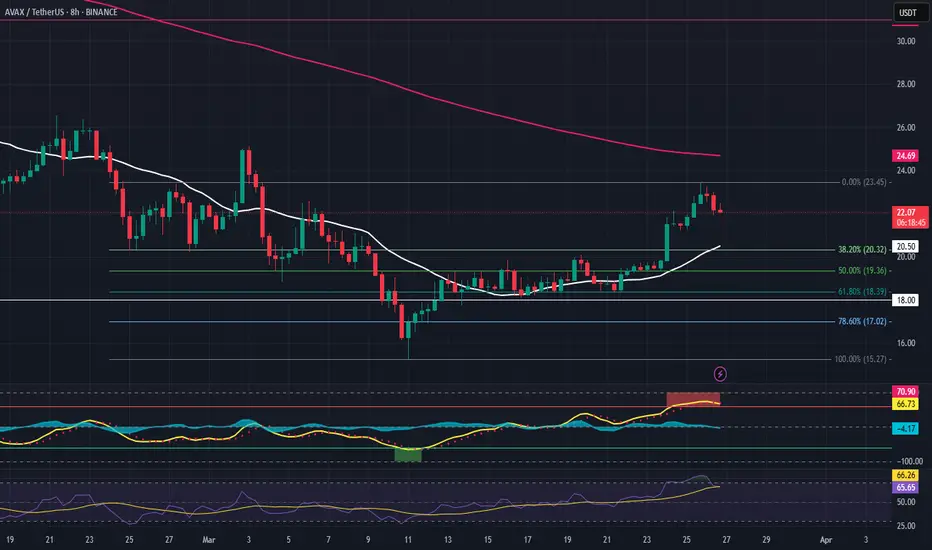
AVAX Trade Setup - Waiting for Retrace to SupportAVAX has had a strong run over the last two weeks. Now, we're waiting for a retrace to key support before entering a long spot trade.
🛠 Trade Details:
Entry: Around $20.00
Take Profit Targets:
$23.50 (First Target)
$31.00 (Extended Target)
Stop Loss: Just below $18.00
Watching for buying pressure at the support level before confirming the move! 📈🔥
LINK Trade Setup - Higher Low ConfirmationLINK is showing early signs of reversal from a key higher timeframe support zone. We anticipate a short-term dip into the buy zone before shifting into an expansion phase.
🛠 Trade Details:
Entry: $13 – $14 (Buy Zone)
Take Profit Targets:
$17.00 - $17.70 (Initial Resistance)
$21.70 - $22.40 (Breakout Target)
Stop Loss: Daily close below $12
Looking for higher low confirmation before the move up. 📈🚀
