Altseason Loading?BTC Dominance chart has once again respected the long-term descending trendline resistance, showing a sharp monthly rejection. Historically, similar rejections have marked the beginning of ALT seasons, where capital flows out of Bitcoin into altcoins, boosting their performance significantly.
Chart Highlights:
-Major triangle pattern since 2017
-Clear rejections from the upper trendline coincide with previous ALT seasons (2018, 2021)
-Current rejection resembles those past cycles
-A move down in dominance could fuel strong altcoin rallies
If BTC dominance continues to decline, we could be entering another powerful altcoin season in the coming months.
Cheers
Hexa🧘♀️
CRYPTOCAP:BTC.D BINANCE:BTCUSDT
Cryptocurrency

BTCUSDTHello Traders! 👋
What are your thoughts on BITCOIN?
Bitcoin has recently posted a new all-time high and is now undergoing a healthy correction. This pullback is expected to extend toward a key support zone, which aligns with both the previous breakout level and the bottom of the ascending channel.
Once the correction is completed near the channel support / previous high, we anticipate a bullish continuation.
The next leg higher could take Bitcoin toward the upper boundary of the current channel.
As long as price remains above the key support area, the overall structure stays bullish and this correction is likely to be a buy-the-dip opportunity within a broader uptrend.
Will Bitcoin use this pullback as a launchpad for new highs? Share your view in the comments! 🤔👇
Don’t forget to like and share your thoughts in the comments! ❤️

BITCOIN Accumulation Phase almost completed. Higher from here?Bitcoin (BTCUSD) is making a strong rebound on the bottom of its 1-month Channel Up and this analysis is in direct response to the one we published last week (July 15, see chart below), where we called this one-week consolidation:
We won't be going into too much detail then, as you can see the price made the Accumulation 2 Phase, after an identical +25.9% Bullish Leg, same as April's and by breaking below the 4H MA50 (blue trend-line), it hit the 0.236 Fibonacci retracement level.
As per the May 05 fractal hit, as long as the 4H MA100 (green trend-line) supports this Channel Up, the market should start Bullish Leg 3 towards Accumulation Phase 3 and eventually peak at around +43% from its start at $140000.
Do you think the pattern will continue to be repeated in the exact same order? Feel free to let us know in the comments section below!
-------------------------------------------------------------------------------
** Please LIKE 👍, FOLLOW ✅, SHARE 🙌 and COMMENT ✍ if you enjoy this idea! Also share your ideas and charts in the comments section below! This is best way to keep it relevant, support us, keep the content here free and allow the idea to reach as many people as possible. **
-------------------------------------------------------------------------------
💸💸💸💸💸💸
👇 👇 👇 👇 👇 👇

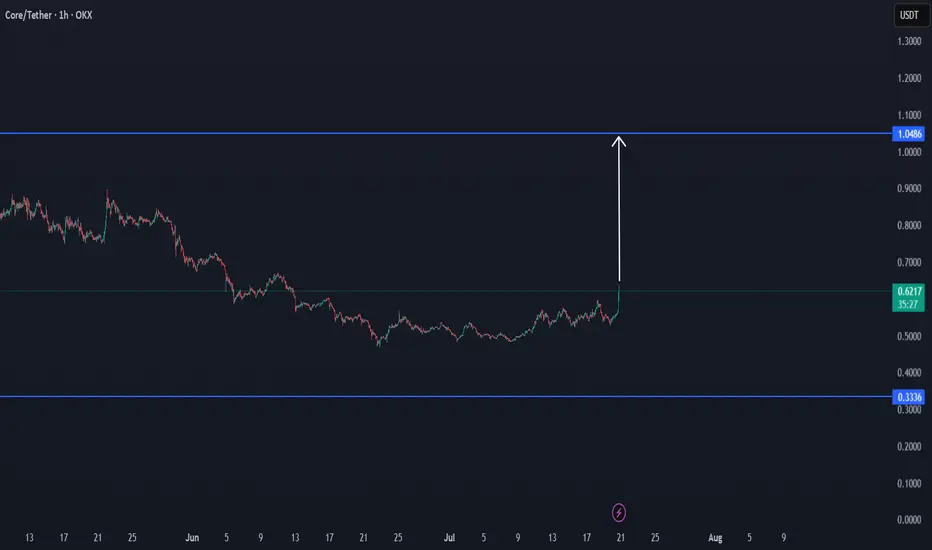
CORE/USDT NEW CYCLE STARTING TO $1CORE looks to enter a new cycle trend, which can confirm an important area, and can be also the reason to enter a new target to $1 with time.
Following this coin, with the upcoming confirmations.
More data?
Check this update for new confirmations.
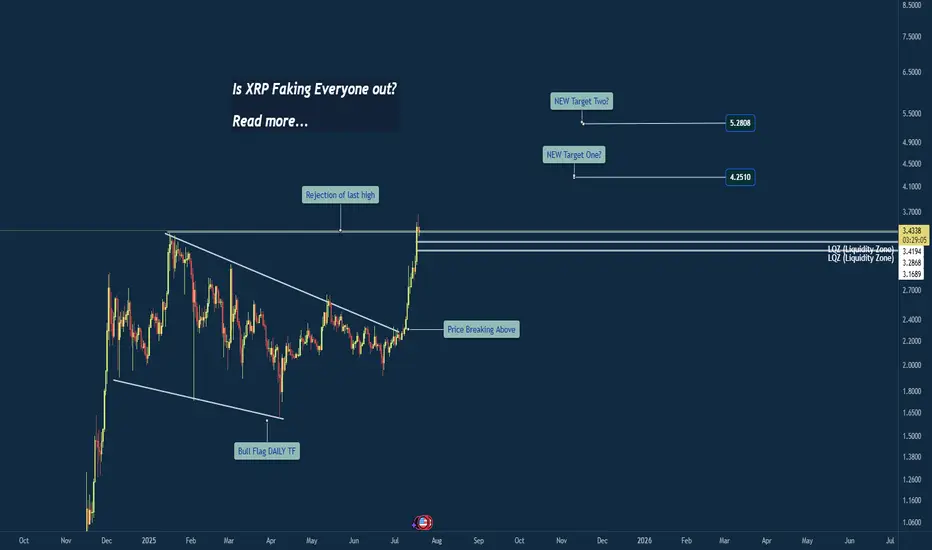
Breakout or Bull Trap? XRP at Critical Weekly LevelWeekly Chart Insight: XRP Closing Above Previous High
XRP has just closed above its previous weekly high—a significant development that could signal a shift in market sentiment. Historically, when price closes above such a critical level on the weekly timeframe, it often leads to continuation, unless a sharp rejection quickly follows.
At this stage, the focus shifts to the 4-hour timeframe for confirmation. An impulsive move above the current consolidation zone could indicate that this breakout is legitimate, potentially leading to another bullish weekly candle.
However, caution is warranted. If the next two daily candles close weakly or fail to maintain structure above the breakout level, it could hint at a fakeout or liquidity grab before a deeper correction.
My Current Bias:
I remain neutral-to-bullish, contingent on:
An impulsive continuation on the 4HR
Strong daily closes above the key range
Price not falling back and closing below the weekly breakout level
If price begins to consolidate and hold this level, that would reinforce the bullish case. But if we see immediate selling pressure and a re-entrance below the breakout, I’ll reconsider the bias based on developing structure.
20:1 R:R for SolanaTaking a chance on this super high-risk setup with a 20:1 R:R before it takes off.
Entry: 177.78
Stop Loss: 173
Target: 260

WILL POPCAT HAVE A NEW WHALE VOLUME?POPCAT seems interesting then never before, even with the last correction, are we going to see a new increase round by POPCAT? The time will show, the interest is here.
If this coin is able to make new confirmations, the updates will be below.

12R setup forming on SUITime to send it after that big channel retest? Clean 12R setup
Entry: 4.0
SL: 3.9
Target: 5.2

FLOKI Headed to $0.01. Cents Floki to the upside after break out from bullish triangle pattern. Target is the 141.00%

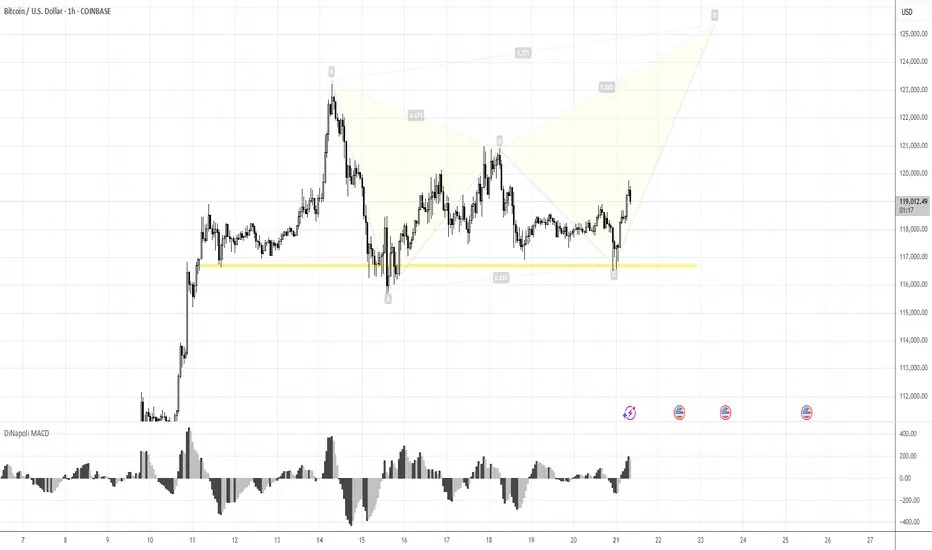
Risk 116. Target 123-125KMorning folks,
Prior 1H H&S was done, we were watching on 120K resistance area, as we said last time. Now, on 1H chart H&S is showing signs of failure - too extended right arm, no downside breakout. Price is taking the shape of triangle . All these signs are bullish. Because butterflies very often appear on a ruins of H&S, we suggest that this one could be formed here...
The risk level for this scenario is 116K lows - BTC has to stay above it to keep butterfly (and triangle) valid, otherwise, deeper retracement to 112K area could start.
Upside target starts from 123K top and up to 125K butterfly target.
Bitcoin monthly RSI CYCLEEvery time Bitcoin peaked in previous cycles, its monthly RSI exceeded 90. In this cycle, the RSI hasn't surpassed 75, but I expect a breakout through 75 to at least 86 in the coming months.

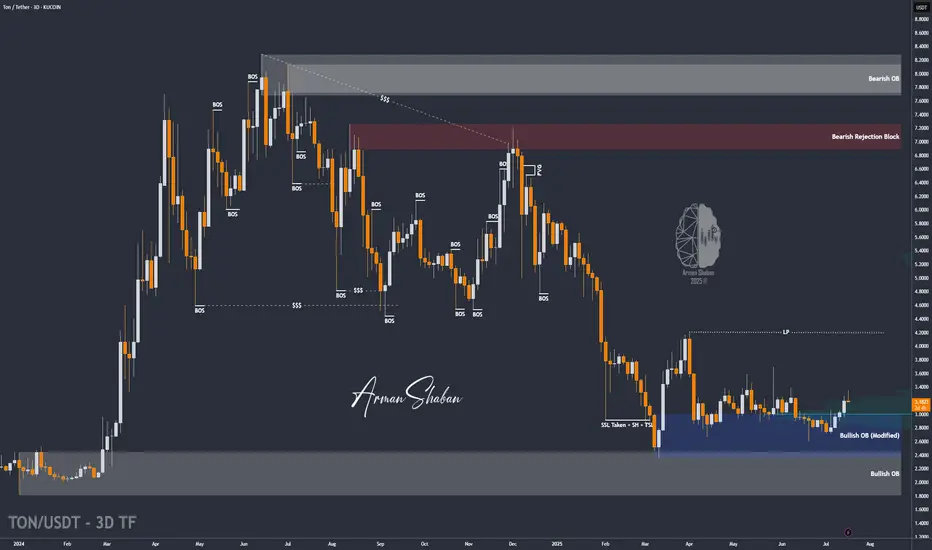
TON/USDT | Another Bullish Move Ahead? (READ THE CAPTION)By analyzing the Toncoin chart on the 3-day timeframe, we can see that, as per yesterday’s analysis, the price climbed to $3.36 before facing a slight correction — which is perfectly normal since every strong bullish trend needs a healthy pullback. The $3.05–$3.20 zone could serve as a good accumulation area for buyers, and we may soon witness another impressive rally from Toncoin! Based on the previous analysis, the next targets are $3.63, $4.20, and $4.68.
Please support me with your likes and comments to motivate me to share more analysis with you and share your opinion about the possible trend of this chart with me !
Best Regards , Arman Shaban
The Critical Blue Line – Will Bitcoin Soar or Sink
🔹 Bitcoin Technical Analysis – Key Blue Line, Bear Trap Possibility & Long-Term Scenario
On the Bitcoin chart, the blue horizontal level has acted multiple times as both support and resistance. The price has broken it several times but failed to sustain above, indicating high-volume decision-making zones by institutions and large players.
📉 Why this pattern keeps repeating:
Strong supply and demand concentration at this level.
Inability to break and hold shows market indecision.
Repeated fakeouts are likely used to shake out weak hands.
🔍 Important hidden scenario: Bear Trap Potential
If the price dips below the blue line but quickly reclaims it, it may form a bear trap, tricking short sellers into entering prematurely. This move could ignite strong bullish momentum from trapped sellers and renewed buyers.
🔮 If price holds above the blue line:
Signals market strength and potential bullish structure shift.
Targets:
109,800
117,200
120,000+ (Long-term)
📛 If support fails again:
Retracement toward the lower channel near 101,000 or lower is possible.
📊 Conclusion:
This zone is one of the most critical decision points in the current market. Traders should combine volume, candlestick behavior, and confirmation signals to avoid getting trapped by fake breaks

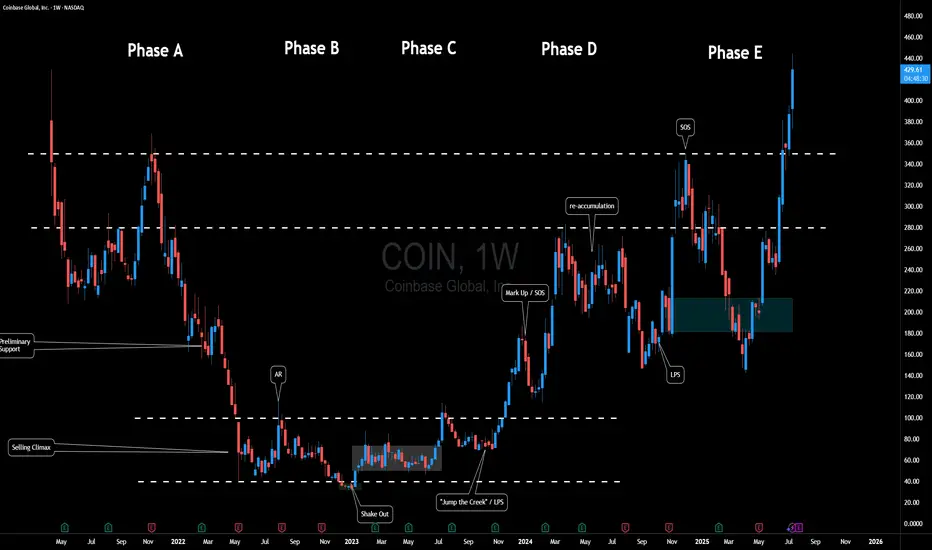
$COIN Fun Wyckoff InterpretationHere's a fun Wyckoff-inspired take on Coinbase Global ( NASDAQ:COIN ) over the past few years, mapping its weekly chart to the classic Accumulation Schematic. Wyckoff's method, envisioning the "Composite Man" quietly scooping up shares during weakness before blasting off... fits COIN perfectly, especially in crypto's wild swings.
We can see a textbook multi-year accumulation from mid 2022, a breakout into markup in 2024, and even a cheeky re-accumulation mid-2024 to fuel the latest highs.
Phase A: Stopping the Downtrend
After the initial IPO Coinbase experienced quite a bit of downside pressure.
Eventually price began to range between $40 and $100.
Phase B: Building Cause
Months of boring sideways chop.
Sellers exhausted because let's think for a moment... If crypto was truly going to stick around - how much lower could this thing go?
Smart money absorbs.
Phase C: The Trap
That shakeout low at ~$32 in early 2023. If you study Wyckoff, this is Schematic #1 vibes.
Phase D: Demand Dominates
Explosive rally (SOS) to ~$280 in early 2024, breaking the range on surging volume.
Mid-2024 pullback to ~$150 acts as a mini Re-Accumulation with its own LPS at the low. Higher lows / mitigation confirm no real distribution yet. Another SOS post-re-accumulation, pushing toward $400+.
Phase E: Markup Phase
Where will the composite man be eyeing for the next target?
Overall, Crypto adoption's heating up (BTC ETF flows, regulatory, etc), and the chart's still in a strong uptrend. But remember, Wyckoff's not crystal ball... it can however be used as a roadmap to navigate the chart.
Fun fact: COIN often mirrors BTC, so keep an eye out for correlation.
What's your opinion - accumulation complete or more shakeouts ahead? 🚀📈
Disclaimer: Not financial advice; DYOR! Chart based on weekly data up to July 2025.
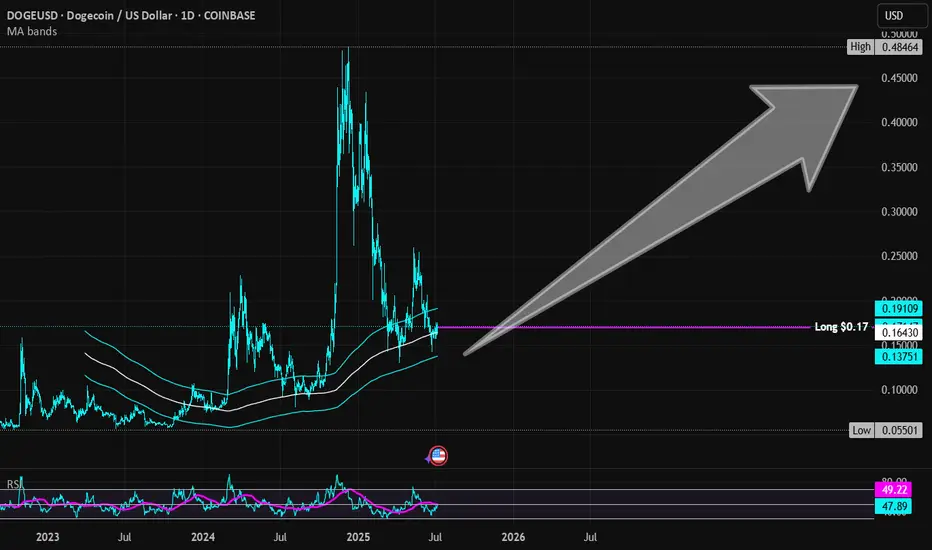
Dogecoin | DOGE | Long at $0.17Currently within my historical simple moving average area and consolidating. I suspect a move up is imminent, but 100% speculation. Crypto "bros" know more than I do.
Targets into 2028:
$0.25 (+47.1%)
$0.45 (+164.7%)
BITCOIN Entering Cyclical Profit Zone. Risk should be limited.Bitcoin (BTCUSD) has just entered the first level of the Logarithmic Growth Curve (LGC) Resistance Zone, which is the light pink band. The Top of the previous Cycle was priced at the top of the band just above this.
In fact every BTC Cycle had this as the 'Profit taking Zone'. The market marginally touched that also within December 2024 - January 2025 but got rejected, almost in similar fashion as January 2021, which was a Double Top approach of the peak formation during the previous Cycle.
This Cycle Top is expected to be within October - November 2025, so we call this the 'Profit Taking Zone' for a reason. Risk exposure from now on should be getting more and more limited. Peak range (depending of the nature of aggression of potential Rate Cuts in September) could be anywhere within $140 - 200k.
Do you think this is the time to start limiting BTC exposure, perhaps moving some of the huge profits to alts? Feel free to let us know in the comments section below!
-------------------------------------------------------------------------------
** Please LIKE 👍, FOLLOW ✅, SHARE 🙌 and COMMENT ✍ if you enjoy this idea! Also share your ideas and charts in the comments section below! This is best way to keep it relevant, support us, keep the content here free and allow the idea to reach as many people as possible. **
-------------------------------------------------------------------------------
💸💸💸💸💸💸
👇 👇 👇 👇 👇 👇

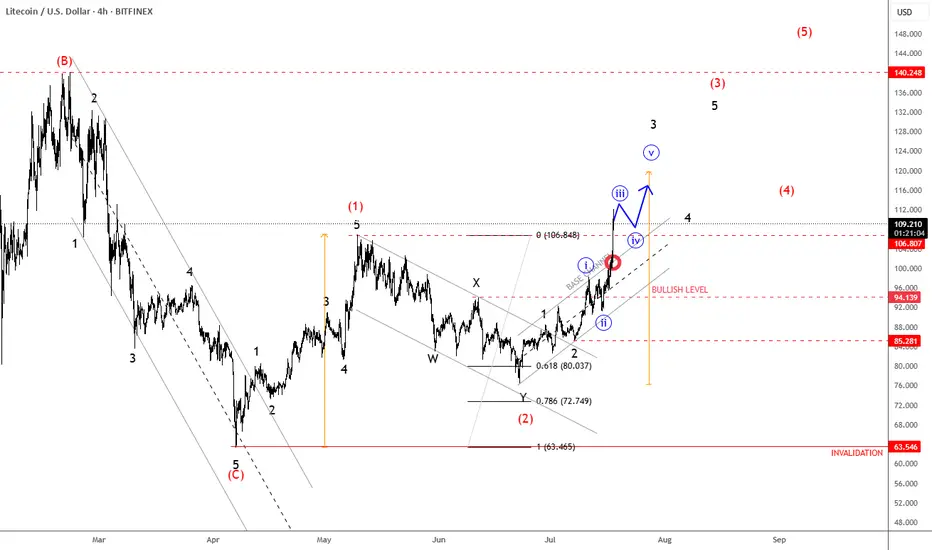
Litecoin Continues Its Bullish Cycle As ExpectedLitecoin Continues Its Bullish Cycle As Expected, which can send the price even higher from technical point of view and by Elliott wave theory.
We talked about Litecoin back on May 30, when we spotted a bullish setup formation with waves (1) and (2) that can extend the rally within wave (3) of a five-wave bullish impulse.
As you can see today on July 18, Litecoin with ticker LTCUSD is now breaking strongly back above May highs after we noticed a complex W-X-Y correction in wave (2). Now that ALTcoin dominance is stepping strongly in, we may easily see more gains within a projected five-wave bullish cycle during the ALTseason, just be aware of short-term pullbacks.
TOTAL3 exc BTCÐTOTAL3 is at the all-time high again and pushing to break that.
according to previous cycles the 1.414% of Fibonacci retracement at $1.98T is the top & timing of before the end of November 2025

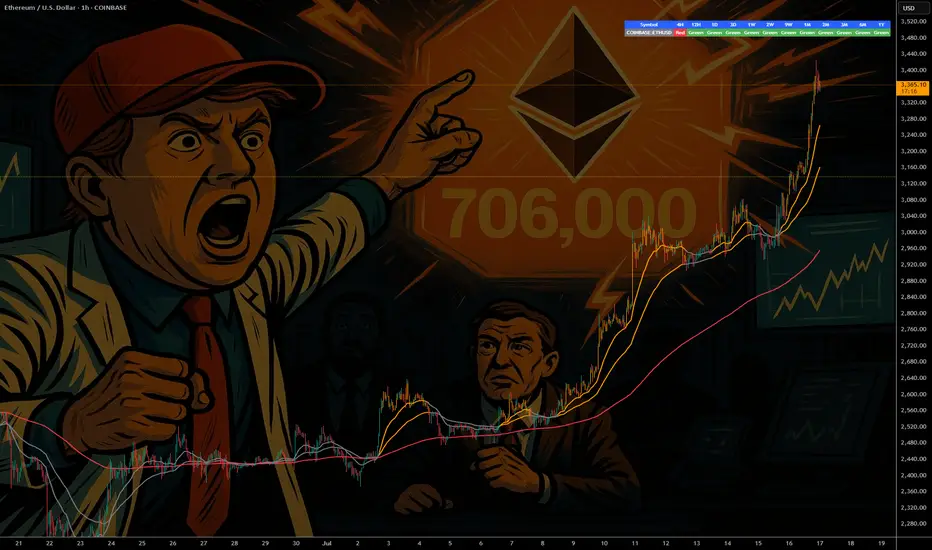
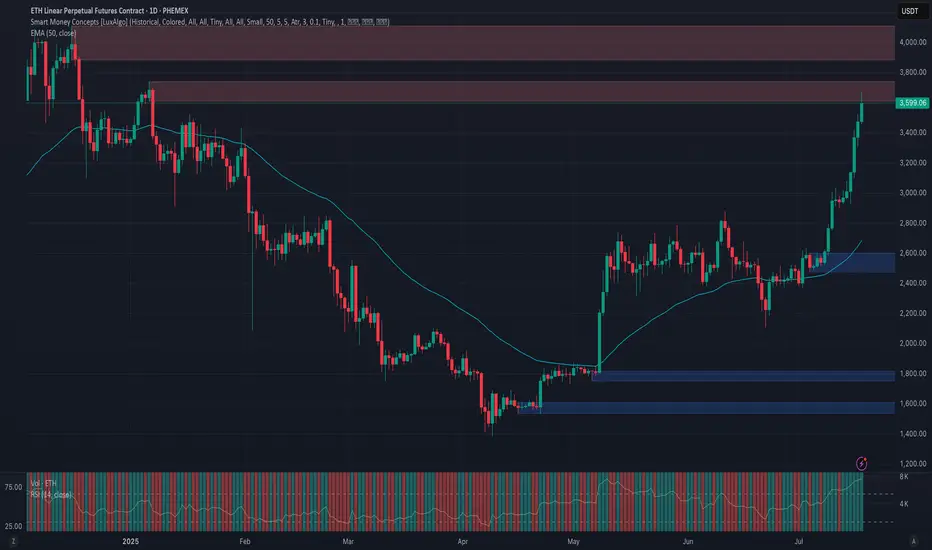
Phemex Analysis #98: ETH Price Explodes— Is $5,000 Finally Next?Ethereum ( PHEMEX:ETHUSDT.P ) has recently shown impressive strength, surging past significant resistance levels and stirring excitement in the crypto market. After an extended consolidation, ETH decisively broke through the crucial $3,300 resistance level, rallying more than 15% in just three days, and is now trading confidently around $3,500.
This renewed bullish momentum has traders and investors eagerly speculating: Could this be the start of Ethereum's next major run? Or should caution prevail amid ongoing market uncertainty? To help navigate this critical period, let's explore several key trading scenarios.
Possible Scenarios
1. Bullish Continuation – Targeting New Highs
Ethereum’s recent breakout above the $3,300 resistance signals strong bullish sentiment. If buying volume continues increasing, ETH could swiftly move towards higher resistance levels at $3,800 and potentially challenge the psychological milestone of $4,100.
Pro Tips:
Profit Targets: Consider locking in partial profits as ETH approaches strong resistance zones around $3,800 and $4,100.
Risk Management: Place tight stop-loss orders on recent lows, approximately around $2,902 to minimize downside risks.
2. Short-term Retracement – Healthy Pullback
Given ETH’s rapid surge, a short-term pullback to retest the recently broken resistance zone at $3,300 to $3,000 (now acting as strong support zone) is plausible. A successful retest would strengthen the bullish case, signaling healthy consolidation before further upward momentum.
Pro Tips:
Buying the Dip: If ETH holds above $3,000 with declining volume, consider cautiously adding to your positions or initiating new longs.
Volume Confirmation: Closely watch trading volume; lower volume during pullbacks typically indicates a healthy retracement rather than a bearish reversal.
3. Bearish Reversal – Breaking Below Critical Support
If Ethereum’s price experiences heavy selling pressure and breaks below the key support at $3,000, bearish sentiment could escalate, potentially driving ETH towards lower support levels near $2,470 and possibly even $2,110.
Pro Tips:
Short Positions: Experienced traders might consider initiating short positions if ETH decisively breaks below the crucial $3,000 support zone on increasing selling volume.
Long-term Accumulation: Long-term investors may strategically accumulate ETH near stronger support areas at $2,470 and $2,110, after clear signs of price stabilization.
Conclusion
Ethereum (ETH) currently offers attractive opportunities, propelled by recent bullish momentum yet balanced by market uncertainties. Traders must closely observe key resistance at $4,000, critical support around $3,000, and carefully analyze trading volumes for confirmation of market direction. By maintaining disciplined risk management and strategically capitalizing on outlined scenarios, investors can effectively navigate ETH’s price action in the weeks ahead.
🔥 Tips:
Armed Your Trading Arsenal with advanced tools like multiple watchlists, basket orders, and real-time strategy adjustments at Phemex. Our USDT-based scaled orders give you precise control over your risk, while iceberg orders provide stealthy execution.
Disclaimer: This is NOT financial or investment advice. Please conduct your own research (DYOR). Phemex is not responsible, directly or indirectly, for any damage or loss incurred or claimed to be caused by or in association with the use of or reliance on any content, goods, or services mentioned in this article.
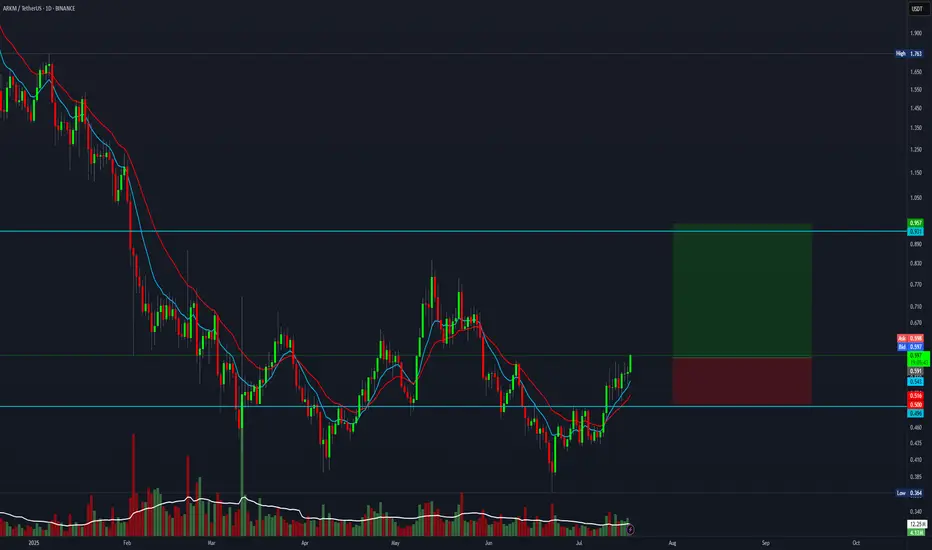
4:1 R:R trade setup for ARKMEverything is pumping right now, and this one also offers a 4:1 R:R setup.
Entry: 0.596
Stop Loss: 0.500
Target: 0.950
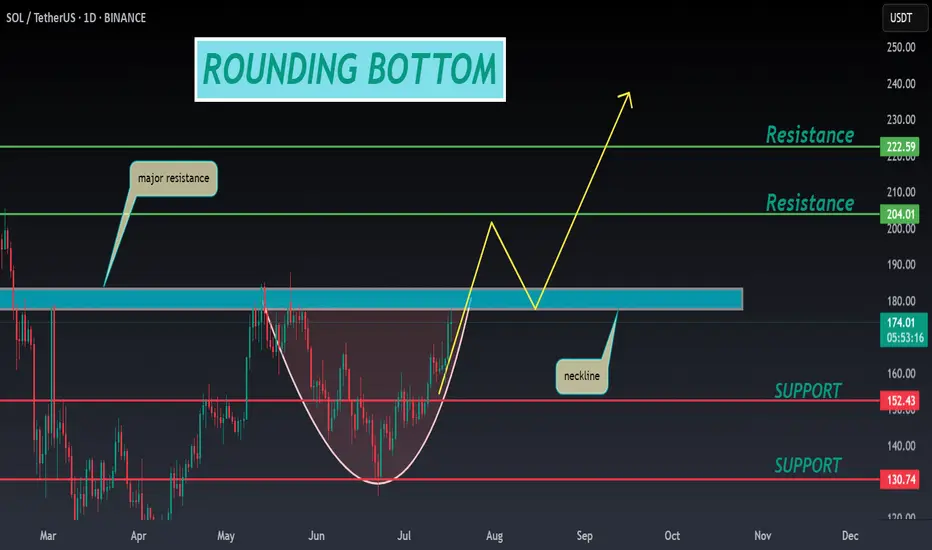
SOL ANALYSIS🔮 #SOL Analysis 💰💰
📊 #SOL is making perfect and huge rounding bottom pattern in daily time frame, indicating a potential bullish move. If #SOL retests little bit and breakout the pattern with high volume then we will get a bullish move📈
🔖 Current Price: $173.75
⏳ Target Price: $204.00
⁉️ What to do?
- We have marked crucial levels in the chart . We can trade according to the chart and make some profits. 🚀💸
#SOL #Cryptocurrency #Pump #DYOR
Solana - The Cup is Almost FullSolana is printing a textbook cup & handle formation on the daily, and price is now pressing against the neckline resistance near $185, just below the psychological $200 zone.
This structure reflects months of accumulation and rising momentum. A confirmed breakout above the $185–$199 resistance would likely trigger the next upward leg.
This setup signals trend reversal continuation, and if SOL closes above $199 on high volume, momentum traders may pile in quickly.
📌 Invalidation below $150 = pattern risk-off.

ETH - If You Know ...... You Know whats Coming
NYSE:BLK $BUIDL tokenized U.S.-Treasury fund launched on COINBASE:ETHUSD in Mar 2024—Wall Street is already settling real dollars on-chain.
NYSE:JPM JPMD stablecoin just went live on Base (an COINBASE:ETHUSD L2), piping wholesale payments from a $4 T balance-sheet straight through COINBASE:ETHUSD rails.
COINBASE:ETHUSD isn’t just riding the next crypto cycle—it’s becoming Wall Street’s settlement layer. From BlackRock’s on-chain Treasury fund to JPMorgan’s and soon Bank of America’s dollar tokens, a tidal wave of institutional stable-coin flows is lining up behind ETH. Fewer coins, more real-world volume—if you know, you know what’s coming.
NYSE:BAC CEO says they’ll issue a dollar-backed token the moment regulators nod—another tier-1 bank boarding the Ethereum train.
Stablecoin cap has blasted past $230 B , with 80 %+ of all on-chain transfers riding Ethereum (plus BSC) blocks.
Corporate settlements via stablecoins grew 25 % YoY in 2024 as multinationals replaced SWIFT with instant on-chain clearing.
Daily stablecoin throughput averages $7 B—each hop burning ETH and tightening supply.
BCG projects tokenized real-world assets to exceed $16 T by 2030 , with EVM chains as the default plumbing.
Over 500 M wallets already interact with stablecoins , a 30 % YoY surge led by emerging-market demand.
L2s like BINANCE:ARBUSDT & BINANCE:OPUSDT cut transaction fees 35 % yet still settle back to mainnet—meaning ETH captures the fee stream and the burn.
Bottom line: a tidal wave of bank-grade stablecoins + tokenized assets is lining up behind ETH; supply shrinks, demand soars—if you know, you know what’s coming.
quote] Marty Boots | 17-Year Trader — smash that , hit LIKE & SUBSCRIBE, and share your views in the comments below so we can make better trades & grow together!