BITCOIN Do you really want to miss this rally???Bitcoin / BTCUSD remains supported by the 1week MA50 just like it has been through the whole 2020/21 period after the COVID crash.
In spite of the massive bearish pressure of the polical developments (tariffs), the fact that the market is holding the 1week MA50, means that it is respective Bitcoin's Cycles.
In fact this is like the May-June 2021 accumulation on the 1week MA50, following the first Bitcoin Top of April 2021.
Similarly, we've had a peak formation in December 2024- January 2025 and the market corrected.
In addition to that, the 1week RSI is testing the 42.00, which isn't just where the August 2024 and September 2023 bottoms were priced, but more importantly the June 2021 one.
The symmetry between the last two Cycles is uncanny, both trading inside the long term Channel Up, with identical Bear Cycle and (so far) Bull Cycle ranges.
If all ends up repeating themselves, expect a value of at least $160000 by September.
Follow us, like the idea and leave a comment below!!
Cryptocurrency

CARDANO 1week MA50 holding. Sky is the limit.Cardano / ADAUSD is holding its 1week MA50 for the 6th straight week.
The pattern is almost identical to the previous Cycle's:
A Channel Up (that breaks once to the downside for a short time) is used as a guide through the whole Bull Cycle. The final consolidation on the 1week MA50 intiates the final and most aggressive rally of the Cycle.
The previous one in 2021 hit the 3.0 Fibonacci extension.
Based on that, we can expect to see $9 on ADA by the end of the year.
Previous chart:
Follow us, like the idea and leave a comment below!!

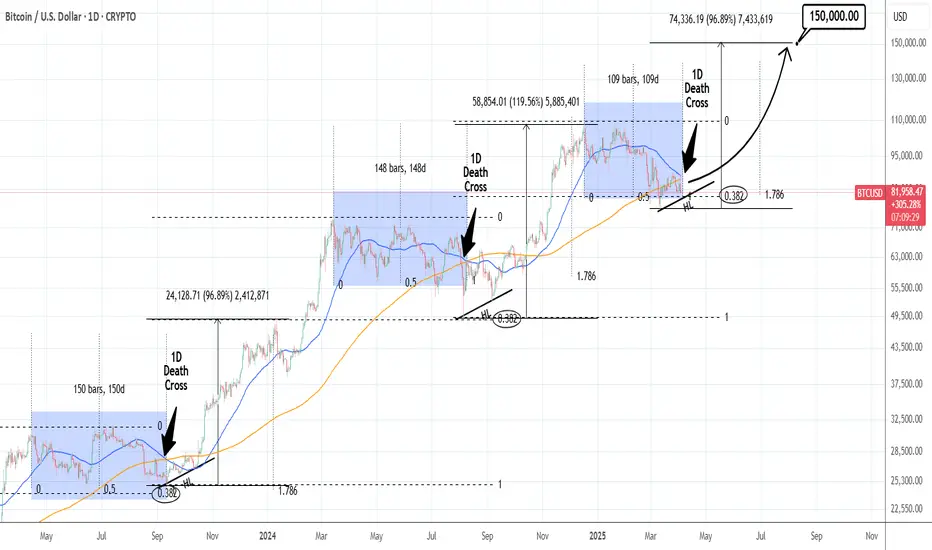
BTCUSD: 1D Death Cross can push it to $150k by August.Bitcoin turned bearish again on its 1D technical outlook (RSI = 43.071, MACD = -1375.000, ADX = 26.965) showcasing the high volatility that yesterday's tariffs announcement inflicted. 1W remains marginally neutral though (RSI = 45.519), highlighting the long term buy opportunity the current levels present.
The market is about to form the first 1D Death Cross, which occurs when the 1D MA50 crosses under the 1D MA200, since August 9th 2024. Even though that's technically a bearish formation, it has worked only as a bottom market during the current Bull Cycle. Both the Aug 9th 2024 and September 11th 2023 1D Death Crosses were formed exactly when BTC bottomed. In symmetric fashion the first two were formed 150 days after the previous high and rose by at least +96.86% by the 1.786 Time Fibonacci extension. Also both bottoms held the 0.382 Fibonacci retracement level.
This time the 1D Death Cross will be formed approximately 109 days after the previous high, which means that this phase is more aggressive than the others and may equally be more aggresive on the bullish wave too. Still, if it 'just' repeats the previous ones, we estimate to reach $150,000 by this August.
## If you like our free content follow our profile to get more daily ideas. ##
## Comments and likes are greatly appreciated. ##
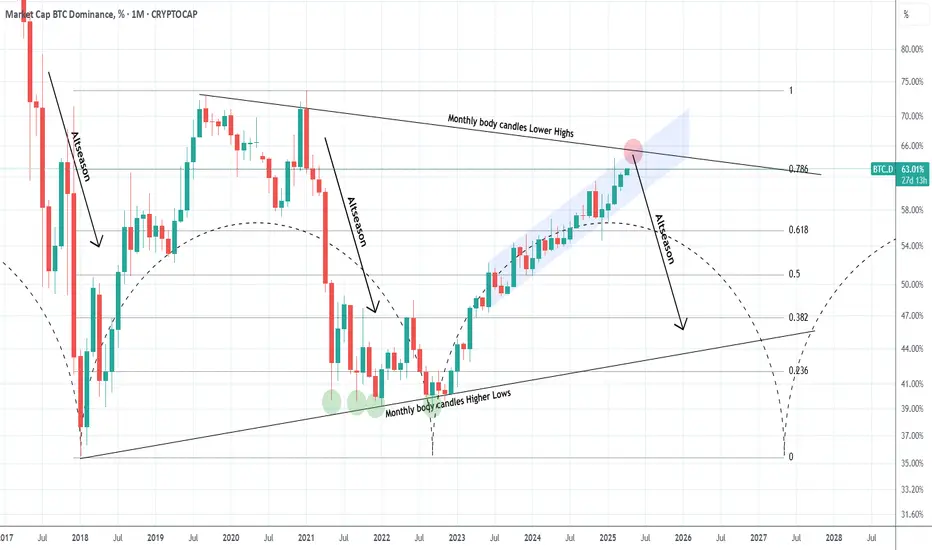
Is BTC Dominance about to reverse and start an Altseason?Well its undoubtedly what the crypto investor wants and what the market would have technically given in February if it wasn't for the tariffs trade war. Bitcoin's Dominance (BTC.D) is trading within a Triangle and February's test of the 0.786 Fibonacci retracement level was the technical level that should have given a rejection.
That rejection technically starts the Altseason which was dominant via a Bearish Leg both in 2017 and 2021. So far though both February's and March's 1M candles closed below the 0.786 Fib and April has an opportunity to even test the monthly body candles Lower Highs, which is the top of the Triangle. This is the last level that a rejection can be technically given.
Can this start an Altseason?
-------------------------------------------------------------------------------
** Please LIKE 👍, FOLLOW ✅, SHARE 🙌 and COMMENT ✍ if you enjoy this idea! Also share your ideas and charts in the comments section below! This is best way to keep it relevant, support us, keep the content here free and allow the idea to reach as many people as possible. **
-------------------------------------------------------------------------------
💸💸💸💸💸💸
👇 👇 👇 👇 👇 👇

86K for another short sellMorning folks,
So, not occasionally we said in previous 2-3 updates that BTC action doesn't look bullish and we suggest a new nosedive. Now we have bearish engulfing pattern on weekly chart . And consider these two Fib levels for another short entry attempt. Of course, 86K would be just perfect, but it could start earlier. One of the possible shapes we consider a downside butterfly.
In general, re-test of 70-73K area on average fits to our long-term view.
In a case if 86K will be broken, it could mean that market is tending to 93.5K target, based on daily AB=CD pattern . But we consider this scenario as less probable due on overall BTC heavy performance in a recent few weeks.
Thus, for now, if you want to make a scalp long trade, you could try, but better to set initial target not higher than 86K.
Our major scenario is bearish and we consider 84K and 86K Fib levels for accumulation of a bearish position, unless something extraordinary will happen.
Profit to everybody, Peace.

BITCOIN is exactly where it's supposed to be.Bitcoin (BTCUSD) is under heavy pressure lately due to the trade tariffs but as long-term investors, we shouldn't let this volatility affect us.
The MVRV has been one of the most consistent cyclical Top (sell high) and Bottom (buy low) indicators giving only a maximum of two optimal signals in each Cycle and it shows that the market is nowhere near a Top.
On the contrary the MVRV has spend the first 3 months of the year correcting from the 0.382 Fibonacci level to the 0.236. This is the exact same score it had i March 2017. Even in the other two Cycles that wasn't this low on Fibonacci levels, it still made a correction, flashing a red signal.
As the 1W MA50 (blue trend-line) continues to support, there are far more greater probabilities that the market will recover, turning the recent trade volatility into the best buy opportunity of 2025.
As far as a Cycle Top is concerned, it has always been an excellent exit signal when the MVRV hit the 0.786 Fib.
So do you think that will be the case? Feel free to let us know in the comments section below!
-------------------------------------------------------------------------------
** Please LIKE 👍, FOLLOW ✅, SHARE 🙌 and COMMENT ✍ if you enjoy this idea! Also share your ideas and charts in the comments section below! This is best way to keep it relevant, support us, keep the content here free and allow the idea to reach as many people as possible. **
-------------------------------------------------------------------------------
💸💸💸💸💸💸
👇 👇 👇 👇 👇 👇

ETHUSDFrankly, it has a very bad chart... The purple support area, $1,500, is the last stronghold for the bulls, and if it doesn't hold, we've officially entered a bear market and are headed towards $800-$1,000.

ETHEREUM Huge bullish divergence targets $4000Ethereum / ETHUSD formed a Double Bottom while the 1day RSI was on a Rising Support.
This is a similar bottom formation like the September 6th 2024 Double Bottom.
Technically once the Falling Resistance breaks, the new bullish wave begins.
Target the bottom of the Resistance Zone at $4000.
Follow us, like the idea and leave a comment below!!

ALTCOINS has already started the new parabolic rally.Altcoins (excluding top 10) are repeating the 2015-2017 market structure.
Based on the 1week RSI we are at levels similar to July 2017 when the market kickstarted the final parabolic rally of the Cycle.
We expect the market to reach the $1 Trillion market cap mark before the end of 2025 and peak the Cycle there.
Follow us, like the idea and leave a comment below!!

DOTUSD: There is no better buy entry than this.Polkadot has been inside a huge Rectangle pattern since the October 19th 2023 Low that created the S1 Zone, a wide consolidation pattern whose top is the R1 Zone. The 1D RSI is already on a HL bullish divergence, identical to both prior bottom formations on the S1 Zone. Since the 1D MA50 has already been breached, we estimate that the price will start the new bullish wave soon. There is no better buy entry than the current level. Aim for the bottom of the R1 Zone (TP = 11.500).
## If you like our free content follow our profile to get more daily ideas. ##
## Comments and likes are greatly appreciated. ##

BTCUSD: We are nowhere near the top.Bitcoin has turned neutral again on its 1D technical outlook (RSI = 52.405, MACD = -937.300, ADX = 31.574) and should turn bullish once it crosses above its 1D MA50, which is now a 2 month Resistance. This simple illustration of cyclical tops and bottoms shows that the market is nowhere near a top and we will not consider selling until we enter October (2025).
## If you like our free content follow our profile to get more daily ideas. ##
## Comments and likes are greatly appreciated. ##

BITCOIN This is where the most aggressive part begins.Bitcoin (BTCUSD) has turned sideways amidst the tariffs implementation today and on the longer picture (1W time-frame) it remains supported just above the 1W MA50 (blue trend-line). On this chart we display our Parabolic Growth Channel (PGC), which is the long-term Zone where BTC is a buy opportunity.
Throughout the market's historic Cycles, the time when BTC was supported above the 1W MA50 but still within its PGC was known as an Accumulation Phase (blue ellipse) before the final parabolic rally of the Cycle and its eventual Top (green Arc).
Based on this model, so far we haven't seen any such rally, despite the undoubtedly strong rallies of October 2023 - March 2024 and October 2024 - December 2024. Only the March 2024 and then the recent Tops can be counted as marginal breaches above the PGC and it's been no surprise that the market corrected back inside the Buy Zone but remained supported by the 1W MA50.
As long as it does, the probabilities of that final, most aggressive Cycle rally get stronger. On the last Cycle the peak was priced just above the 1.618 Fibonacci extension. That is currently a little below $170k and that is why our final Target is just below at $160000. Also right now we are marginally below the 0.618 Cycle top-to-top Fib, which is in line to where all previous final Cycle parabolic rallies started.
So do you think the 1W MA50 will now push BTC to its final Cycle rally? Feel free to let us know in the comments section below!
-------------------------------------------------------------------------------
** Please LIKE 👍, FOLLOW ✅, SHARE 🙌 and COMMENT ✍ if you enjoy this idea! Also share your ideas and charts in the comments section below! This is best way to keep it relevant, support us, keep the content here free and allow the idea to reach as many people as possible. **
-------------------------------------------------------------------------------
💸💸💸💸💸💸
👇 👇 👇 👇 👇 👇

RENDER ANALYSIS📊 #RENDER Analysis
✅There is a formation of Falling Wedge Pattern on daily chart with a good breakout and currently retests from the major resistance zone🧐
Pattern signals potential bullish movement incoming after a breakout of major resistance zone
👀Current Price: $3.455
🚀 Target Price: $4.4-6.0
⚡️What to do ?
👀Keep an eye on #RENDER price action and volume. We can trade according to the chart and make some profits⚡️⚡️
#RENDER #Cryptocurrency #TechnicalAnalysis #DYOR

Bitcoin first HLIt looks like after a long time bitcoin is making its first higher low on daily time frame above the trendline.

XRPUSD Falling Wedge bullish break out. Target 2.3700XRP broke above its Falling Wedge pattern. Being under the MA50 (4h) means that this is still a good short term buy opportunity.
Last time it had a break out like today's (March 11th), it hit the 0.786 Fibonacci retracement level.
Trading Plan:
1. Buy on the current market price.
Targets:
1. 2.3700 (the 0.786 Fibonacci retracement level).
Tips:
1. The RSI (4h) has been on a Rising Support while the price was on a Falling Support. This is a bullish divergence signal that prompted early today's break out.
Please like, follow and comment!!
Notes:
Past trading plan:

BITCOIN Will it finally break the 2 month Resistance?Bitcoin / BTCUSD is having an impressive 1day candle,recovering the losses of the last 3 days and with the 1day RSI bouncing on its Rising Support.
Now it faces the most important Resistance of all, the Falling trend line that started on the January 20th ATH.
This is just under the 1day MA50 and this will be the 5th test.
If successful, it will be an early validation that the trend has finally shifted to long term bullish again.
The first technical target will be the 2.0 Fibonacci extension. Aim a little bit lower at the top of February's Resistance Zone at $100000.
Follow us, like the idea and leave a comment below!!

DOGE The only chart that matters. $5 final target.Dogecoin / DOGEUSD is about to start the final and most aggressive rally of its Cycle.
As this ultimate historic chart shows, we are on DOGE's 3rd Cycle and with the Rising Support that's been supporting since the Bear Cycle bottom making its 3rd low, this is going to kickstart the rally.
This is whar happened on both previous Cycles with the rallies extending fairly close to the top of the Cycle.
This tells us that $5.000 is a very achievable target by the end of this year, if not higher.
Follow us, like the idea and leave a comment below!!

EOSUSD: Channel Up bottomed. Starting bullish leg to 1.500.EOS is about to turn overbought on its 1D technical outlook (RSI = 69.362, MACD = 0.013, ADX = 39.380) indicating a strong bullish momentum that shouldn't go away anytime soon as the 1W RSI is only neutral (RSI = 51.171). This is because just today it managed to cross over the 1D MA200 on a technical rebound that started at the bottom of the 1 year Channel Up. Essentially we've initiated the new bullish wave. Our estimate for the next HH and most likely Cycle peak is 1.500.
## If you like our free content follow our profile to get more daily ideas. ##
## Comments and likes are greatly appreciated. ##

BTCUSDT BEARISH RISING WEDGE PATTERN IN 15-MI Created This BTCUSDT Chart Analysis In 15-M Tf
Entry: SELL from 83800
Resistance zone : 83800 / 84100
Target Will Be : 82200
BINANCE:BTCUSDT Make Rising wedge, Probably BTC going downtrend.

FXAN & Heikin Ashi TradeBINANCE:XRPUSD
In this video, I’ll be sharing my analysis of XRPUSD, using FXAN's proprietary algo indicators with my unique Heikin Ashi strategy. I’ll walk you through the reasoning behind my trade setup and highlight key areas where I’m anticipating potential opportunities.
I’m always happy to receive any feedback.
Like, share and comment! ❤️
Thank you for watching my videos! 🙏

XRPUSD starting the parabolic rally to $6.000Ripple (XRPUSD) has been trading within a 5-year Channel Up since the March 2020 COVID flash crash. That COVID bottom initiated the first Bullish Leg of XRP, which was the previous Cycle's Bull run.
XRP has started the second Bullish Leg after the July 2024 Channel Up bottom and since basically December, the market has been under heavy volatility, entering a consolidation period similar to December - March 2021.
That was XRP's last accumulation phase before the 2021 Cycle Top. The 1W RSI patterns between the two Bullish Leg fractals are also similar, indicating that even though the current Bullish Leg has been more aggressive since November 2024, it is being harmonized now inside the parabolic growth Channel.
We expect a symmetrical +1668% rise in total for this Bullish Leg, similar to 2021, with our Target being marginally lower at $6.000, expecting it within July - October 2025.
-------------------------------------------------------------------------------
** Please LIKE 👍, FOLLOW ✅, SHARE 🙌 and COMMENT ✍ if you enjoy this idea! Also share your ideas and charts in the comments section below! This is best way to keep it relevant, support us, keep the content here free and allow the idea to reach as many people as possible. **
-------------------------------------------------------------------------------
💸💸💸💸💸💸
👇 👇 👇 👇 👇 👇

BTC Short Setup – Targeting 78,320Looking for a sell opportunity at the daily Fair Value Gap (FVG), aiming for a profit target of 78,320, with a stop-loss set at 87,617. Monitoring price action for confirmation before execution. Let’s see how it plays out! 🚀📉 #BTC #Crypto #Trading
