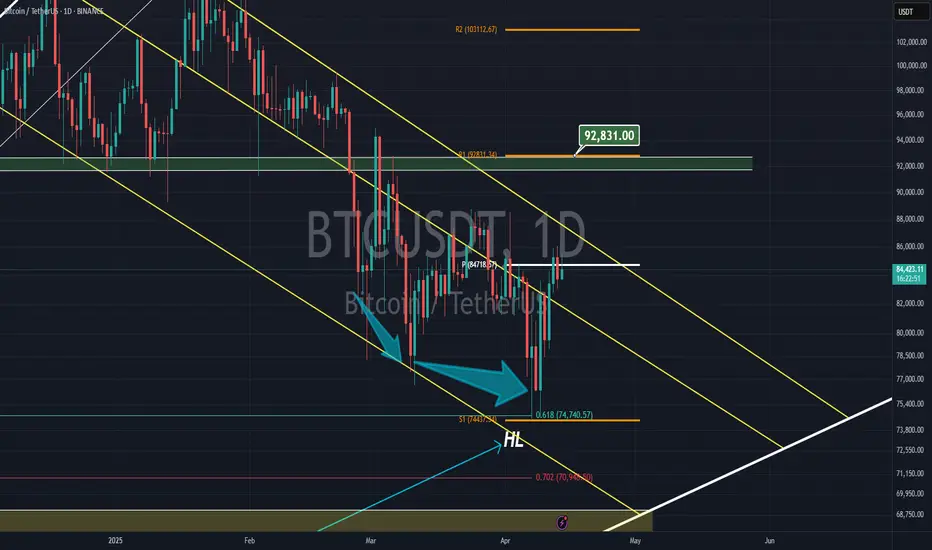
BTC has upside chances until it holds above 81K areaMorning folks,
So, picture barely has changes since our last discussion. Right now we do not see any ready-to-trade setups. But suggest some bullish support to the market. After major XOP target has been reached - BTC has not dropped but remains in tight consolidation. This is more a bullish sign.
In general, we could suggest here a kind of reverse H&S shape. It makes us think that until BTC price is above ~ 81K area, it keeps chances on upside breakout. Drop below 81K will lead BTC back to the previous lows.
So, if you would like to buy - try to do this as closer to the lows of consolidation as possible. We consider no shorts by far.
Cryptocurrency

Is This The End of Pullback?BINANCE:SUPERUSDT has entered the support zone between 0.5142 – 0.4754 after a strong impulsive move to the upside.
This support zone is considered valid due to multiple rejections that occurred within this area in the past—indicating strong buyer interest.
Ideally, this is where we expect price to bounce and resume the bullish trend. The first sign of confirmation would be a break above 0.5272, which may open the path toward higher targets.
However, the bullish scenario remains valid only if the price stays above 0.4983—a key invalidation level.
Note:
If this level is breached before a clear candlestick confirmation, the candle pattern being used to validate the move becomes invalid.
Even if the price breaks below the invalidation level, as long as it remains within the support zone, the support is still valid — but it would require the formation of a new bullish candlestick pattern to re-confirm the potential for an upward move.

(JASMY) jasmy "cycle-phase-wave"According to an enhanced MACD indicator that follows three layers of information I found the peak MACD green to line up with the yellow lines on the chart that are assigned with the next alternative colored line to be aligned with the most recent improvement in the otherwise losing price for the last months of time. Although an elliott wave is not seen I figured it would be possible to create a measurement like wave using an indicator to guide where those points should be.

TradeCityPro | MANAUSDT Fake Breakout Trigger Activated!👋 Welcome to TradeCityPro Channel!
Let’s dive into the analysis of one of the metaverse coins and quickly check the trigger and the action unfolding on its chart together!
🌐 Overview Bitcoin
Before starting the analysis, I want to remind you again that we moved the Bitcoin analysis section from the analysis section to a separate analysis at your request, so that we can discuss the status of Bitcoin in more detail every day and analyze its charts and dominances together.
This is the general analysis of Bitcoin dominance, which we promised you in the analysis to analyze separately and analyze it for you in longer time frames.
📊 Weekly Timeframe
On the weekly timeframe, MANA is one of those coins still oscillating within its range box. After a rejection from the key ceiling at 0.7679, we moved back toward the lower end and continued to fluctuate within our range box.
The candle from two weeks ago attempted to close below the critical support at 0.2484—and it did close below this box’s floor. However, this didn’t trigger a sharp drop; instead, we saw a fake breakout!
A fake breakout occurs when a support or resistance level is breached, but the next candle reverses back above the support or below the resistance. This is often called a fake breakout, and it typically signals a trend reversal or the start of a new trend.
That’s exactly what happened here. After the break, the next candle closed as a strong green candle, returning MANA to its box. This could mark the start of a new trend. You can take this trigger with a stop loss at 0.1722 and capitalize on the potential move!
📉 Daily Timeframe
In the daily timeframe, MANA has continued to show the aftermath of the fake breakout. After the failed attempt to break below 0.2484, the price quickly recovered, with buyers stepping in to push it back into the range box.
The strong green candle that followed the fake breakout confirms the buying pressure, and the price is now testing the upper boundaries of the box. If we see a break above 0.7679, it could signal a strong bullish move. However, caution is needed—failure to break this resistance could lead to another rejection.
For buying, the fake breakout trigger at 0.2484 is active, and you can enter with a stop loss at 0.1722. Confirmation would come from sustained volume and a push above the 50-day moving average. For selling, if we break below 0.1722, it’s a sign to exit, as the downtrend could resume.
✍️ Final Thoughts
Stay level-headed, trade with precision, and let’s capitalize on the market’s top opportunities!
This is our analysis, not financial advice always do your own research.
What do you think? Share your ideas below and pass this along to friends! ❤️

BITCOIN Sell everything in October!Yep, kind of a clickbait title but it doesn't fail to serve justice to this very important Bitcoin (BTCUSD) chart.
Today's analysis displays in the most illustrative way the extremely tight symmetry between BTC's Cycles and how this can help us time our Sell at the Top of the Cycle and equally have the patience to buy as close to the next Bottom as possible.
As you see, in the past +10 years since the 2014 Bear Cycle, every Cycle has almost identical time ranges/ durations. All three Bear Cycles since then, lasted for approximately 1 year, and both Bull Cycles for almost 3 years (152 weeks, 1064 days to be exact). More specifically, the last two Bear Cycles were exactly 1 year long, the 2018 one started on the week of December 11 2017 and ended on December 10 2018 and the next Bear Cycle started on November 15 2021 and ended on November 07 2022. So it's been December-to-December and November-to-November Bear Cycles respectively.
If this high degree of symmetry continues to hold, counting 1064 days from the last Cycle Bottom o November 07 2022, gives a time estimate for the next Cycle Top on (the week of) October 06 2025. If also that holds for the Bear Cycle, expect an October-to-October duration, with an approximate bottom on October 12 2026.
So Sell everything up to October 2025 and Buy back as we get close to October 2026 is the strategy?
Feel free to let us know in the comments section below!
-------------------------------------------------------------------------------
** Please LIKE 👍, FOLLOW ✅, SHARE 🙌 and COMMENT ✍ if you enjoy this idea! Also share your ideas and charts in the comments section below! This is best way to keep it relevant, support us, keep the content here free and allow the idea to reach as many people as possible. **
-------------------------------------------------------------------------------
💸💸💸💸💸💸
👇 👇 👇 👇 👇 👇

BTCUSDTHello Traders! 👋
What are your thoughts on BITCOIN?
Bitcoin is still struggling to break through the specified resistance zone.
As long as this resistance level remains unbroken, it is better to wait before entering a buy position. However, as long as Bitcoin does not fall below the specified support level, we can remain optimistic about its potential to rise.
Our outlook remains bullish, but we will wait for the breakout above the resistance before entering a buy. Once the level is broken, we will look for an opportunity to enter long positions.
Will Bitcoin break through resistance and continue higher? Share your thoughts below!
Don’t forget to like and share your thoughts in the comments! ❤️

Phemex Analysis #73: Pro Tips to Trade OM Upon the 90% CrashMANTRA (OM) experienced a dramatic price crash of over 90% last Sunday (April 13th). While many initially suspected a "rug pull" event, similar to what happened with Luna and FTX, OM Founder JP Mullin attributes the massive sell-off to forced liquidations at an exchange, triggering a panic sell-off. While the exact cause of this 90% crash is still unconfirmed, this volatility presents significant trading opportunities.
We suggest that traders use smaller time frames, such as 1-hour or 15-minute charts, to identify more trading opportunities in this volatile situation.
Here are possible scenarios on the 15-minute chart:
Possible Scenarios
1. V-Shaped Recovery
If strong buying pressure emerges and quickly pushes the price back up to pre-crash levels, it could signal a V-shaped recovery. This would indicate that the market has absorbed the sell-off and buyers are back in control.
Pro Tips:
Watch for large green candles with significant volume on the 15-minute chart, that rise above $0.89 or $1.0.
Consider entering a long position on the breakout above key resistance levels ($0.89 & $1.0).
Place a stop-loss order below a recent swing low to protect against a reversal.
2. Consolidation and Accumulation.
The price may consolidate in a range after the crash, as the market tries to find a new equilibrium. This consolidation phase could represent a period of accumulation, where buyers are slowly absorbing the remaining supply.
Pro Tips:
Identify key support and resistance levels within the consolidation range, which is $0.89 to $0.73 or $1.0 to $0.55.
Consider range-bound trading strategies, such as buying near support and selling near resistance.
Alternatively, use Phemex Grid Bots to capitalize all the small price movement during the accumulation phase.
3. Further Decline
If the selling pressure continues or new negative information emerges, the price could decline further. This scenario would be characterized by continued large red candles and a lack of significant buying interest.
Pro Tips:
Monitor key support levels ($0.73, $0.55 & $0.45); a break below these levels could trigger further selling.
Consider exiting any long positions to avoid further losses.
Be cautious about entering new long positions until a clear bottom has been established.
Consider shorting opportunities if the price breaks down through significant support, but manage risk carefully.
Conclusion
The 90% crash in MANTRA (OM) has created a highly volatile trading environment. While the cause of the crash remains debated, the current market conditions offer substantial trading opportunities. By analyzing price action on smaller time frames, such as the 15-minute chart, and considering the scenarios outlined above, traders can potentially profit from both upward and downward price movements. However, it is crucial to exercise caution, manage risk effectively, and stay informed about any new developments related to MANTRA (OM).
Pro Tips:
Elevate Your Trading Game with Phemex. Experience unparalleled flexibility with features like multiple watchlists, basket orders, and real-time adjustments to strategy orders. Our USDT-based scaled orders give you precise control over your risk, while iceberg orders provide stealthy execution.
Disclaimer: This is NOT financial or investment advice. Please conduct your own research (DYOR). Phemex is not responsible, directly or indirectly, for any damage or loss incurred or claimed to be caused by or in association with the use of or reliance on any content, goods, or services mentioned in this article.

BITCOIN's ultimate VIX bottom signal-Last time gave +100% profitBitcoin (BTCUSD) is attempting to make yet another green day, yesterday not only did it close above its 1D MA50 again but was also the 4th green day in the last 6. This attempt is showing that the trend is gradually shifting again towards long-term bullish but today we'll present to you another one, this time in relation to the Volatility Index (VIX).
BTC's (orange trend-line) recent rise is naturally on a negative correlation with VIX (red trend-line) which is currently pulling back after it's most aggressive spike since the COVID flash-crash (March 2020).
Their ratio BTCUSD/VIX (blue trend-line) made a very interesting contact with the Higher Lows trend-line that has been holding since the August 24 2015 Low, which was the bottom of the 2014 Bear Cycle. Since then it made Higher Lows on March 16 2020, August 05 2024 and the most recent, April 07 2025. Every time it was a bottom indication and a massive rally followed. The 'weakest' of all was the previous one, which 'only' gave a +105% rise approximately. Based on that, there is no reason not to expect BTC to hit at least $150k by the end of this Bull Cycle.
Do you think that's a plausible target? Feel free to let us know in the comments section below!
-------------------------------------------------------------------------------
** Please LIKE 👍, FOLLOW ✅, SHARE 🙌 and COMMENT ✍ if you enjoy this idea! Also share your ideas and charts in the comments section below! This is best way to keep it relevant, support us, keep the content here free and allow the idea to reach as many people as possible. **
-------------------------------------------------------------------------------
💸💸💸💸💸💸
👇 👇 👇 👇 👇 👇

ETHUSD: Prepare to buy if this trendline breaks.Ethereum remains bearish on its 1D technical outlook (RSI = 41.779, MACD = -115.050, ADX = 39.213) despite an encouraging start to the day as the 4 month Channel Down is intact. The 1D RSI is supported and is trading sideways and ETH itself is back to historic buy levels. We are willing to buy only after a break over the 1D MA50 validates the trend change technically. If that happens we will aim for the 2.0 Fibonacci extension (TP = 2,800). You can use as an extra validation condition a potential break of the 1D RSI above the R1 level.
## If you like our free content follow our profile to get more daily ideas. ##
## Comments and likes are greatly appreciated. ##

TradeCityPro | AVAXUSDT Watch the Altcoins!👋 Welcome to TradeCityPro Channel!
Let’s dive into the analysis of one of my favorite coins, which is likely to make a move this week. Let’s break it down and take a closer look together!
🌐 Overview Bitcoin
Before starting the analysis, I want to remind you again that we moved the Bitcoin analysis section from the analysis section to a separate analysis at your request, so that we can discuss the status of Bitcoin in more detail every day and analyze its charts and dominances together.
This is the general analysis of Bitcoin dominance, which we promised you in the analysis to analyze separately and analyze it for you in longer time frames.
📊 Weekly Timeframe
On the weekly timeframe, the AVAX chart is one of the smoothest and most technical charts I’ve seen—support and resistance levels work like a charm, and price patterns are fairly predictable.
After getting rejected at the key resistance of 53.62—a historically significant level—sellers stepped in, pushing us into a deep correction. The failure to break this level was partly because we didn’t enter overbought territory on the weekly chart.
For buying, the weekly chart is currently very bearish, so jumping in now isn’t logical. However, a break above 53.82 would be our most reliable trigger for an upward move. For exiting, if we drop below 21.02, I’d personally cash out. If we climb back above 21.02, I’d buy again—this time with fewer AVAX but the same USDT amount to manage risk.
📉 Daily Timeframe
In the daily timeframe, after a rejection at 53.96 that led to a correction, it seemed likely we’d test this resistance again. However, after the rejection, we broke below 44.21, forming a price range box.
Right now, we’re not paying much attention to resistance levels. Our trendline is showing lower highs but flat lows, indicating that our movement is driven by the trendline rather than traditional support and resistance.
With that in mind, a break of the trendline could spark a move, but we still need a trigger. The 22.71 level is our breakout trigger—not just a resistance. If we break it, we could enter a buy with a risky stop loss at 16.00. Confirmation would come from a spike in volume. For selling, if we get rejected at the trendline and break below 16.00, I’d personally exit.
✍️ Final Thoughts
Stay level-headed, trade with precision, and let’s capitalize on the market’s top opportunities!
This is our analysis, not financial advice—always do your own research.
What do you think? Share your ideas below and pass this along to friends! ❤️

Chainlink - 1W
Overview
Chainlink (LINK) is experiencing an interesting price movement on the weekly timeframe, forming a Symmetric Triangle pattern. This pattern is a strong technical formation that often precedes significant price movements upon breaking one of its sides. This analysis focuses on the pattern, key resistance and support levels, and price expectations if the resistance is broken.
Symmetric Triangle Pattern
Pattern Formation: The Symmetric Triangle forms as price volatility gradually contracts, creating two converging trendlines (a descending resistance line and an ascending support line). On Chainlink’s weekly timeframe, this pattern is clearly visible, indicating a consolidation period before a major price move.
Time Duration: The pattern has persisted for several weeks, enhancing its technical significance, as longer-term patterns are generally more reliable.
Trading Volume: A gradual decrease in trading volume is observed as the price approaches the triangle’s apex, a typical behavior reflecting traders’ anticipation of an imminent breakout.

XLM/USD Main trend. Timeframe 1 week. Channel. Radiant Star of 2218) One of the most “silent” cryptocurrencies. Unlike its fellow clone, pumped up by the community on the ears of pseudo-esoterics (although 589 is not going anywhere, which is, that is, it is not price))))....
Note that past secondary trend reversals are shrinking after significant dips. We are now in the lower zone of the channel, but not at the lowest potential values. Never “catch” the lows and highs, but work most of your position near those values, and you will be happy and relaxed.
I advise you to combine pyramiding (up) + martingale (down), and you won't care where the price goes, because you'll be happy with either direction. It is also rational to protect your profits with stops, but not near intraday volatility.
It is also natural for your peace of mind to forget about two things if you have a mind:
1) Forget margin trading. Work only on spot.
2) Forget the 1 “world's most reliable exchange” (diversification of trading and storage).
Coinmarket: XLM
About the enlightenment: .
1) Instant (less than 3 sec) transactions,
2) Conditionally free transactions $0.000001 (0.00001 XLM micro payments),
3) No network congestion (30 sec refund in case of failed transaction (not to be confused with exchange),
4) Smart contacts and NFT (2022),
5) "Transaction rollback" (this is an advantage, not a disadvantage for real use, not speculation),
6) Support for multi-currency transactions.
7) Interest in XLM blockchain by states.
And much more...
Roughly speaking, all the best worked out solutions from thousands of temporary “faith cryptocurrencies” over the last 10+ years.
Incidentally, many states will be making “transitional” fiat currencies on this blockchain. For example, the long-suffering Ukraine. But then when there will be “total sadness”. Creating a problem—presenting a ready-made solution.
Here's what this important zone looks like on the 1-day timeframe. Key reversal or trend continuation zone.
Breakout of the local symmetrical triangle +10% to the mirror resistance level of 0.2022.

BTCUSD – Bullish Breakout Loading ?
📈 *Bitcoin Daily Chart Analysis – April 14, 2025*
Bitcoin is looking 🔥 as it pushes higher from a key **accumulation zone** after a sharp recovery from recent lows. The previous **rising channel** was broken to the downside, but now the price is forming a solid **bullish structure**, suggesting a strong comeback is in play!
---
### 🔍 Technical Highlights:
- ✅ **Demand Zone Bounce:** Clean rebound from the highlighted green box (accumulation area), signaling buyer strength.
- 📈 **Higher Highs Incoming?** Price is now consolidating near **$85,000**, with bullish momentum building.
- 📊 **Upside Target:** Eyes on $87,000 → $88,500 if momentum sustains and daily closes continue above resistance.
- 📌 **Key Support:** $84,000 holds the line — invalidation below that would shift bias.
---
### 🧠 Trader's Insight:
The structure is setting up for a **potential bullish continuation**. Momentum traders should watch for a confirmed break and close above $85,400 for further upside! 🚀
💬 *"Patience in accumulation pays in breakout."*
Ready to catch the next leg up? 📲 Let’s trade smart and ride the wave.

87-88K seems natural targetMorning folks,
So, our 80-85K trade was nice. Now we think that it is not time for big trades, mostly because many markets, and especially US bonds and dollar are overextended. That's why for a few sessions we're focused on near standing targets.
BTC daily chart shows strong resistance around 87-89K area, which is also might be the neckline of potential reverse H&S. We already talked about this previously.
It is the 2nd reason why it would be better to focus on something close. Thus, on 1H chart setup might be looking like you see on the chart. We hope that 83K support will hold. Otherwise, this trade has no sense, because stop placement below 81K support makes risk/reward ratio unattractive.
Thus, supposedly 87-88K is an upside target. And we hope that BTC will stay above 83K.

BITCOIN's 1D MA50 Flip = GREEN LIGHT for the NEXT BIG PUMP!Bitcoin (BTCUSD) closed Saturday's 1D candle above the 1D MA50 (blue trend-line) for the first time in more than 2 months (since February 03)! The 1D MA50 got tested and rejected the price 6 times since then. At the same time, the price marginally broke above the Lower Highs trend-line that started on the January 20 All Time High (ATH).
This is the most powerful short-term bullish combination as it was staged on a Bullish Divergence 1D RSI, which is on Higher Lows against the bearish trend's Lower Lows. Technically such break-outs immediate Target is the 2.0 Fibonacci extension, which now happens to be just below the $100k mark at $99500. In not such a coincidental fashion, that is he last Resistance level that run through February 05 - 21 before BTC's strong tariff sell-off.
So do you think the 1D MA50 break is the green light for a $99500 rally? Feel free to let us know in the comments section below!
-------------------------------------------------------------------------------
** Please LIKE 👍, FOLLOW ✅, SHARE 🙌 and COMMENT ✍ if you enjoy this idea! Also share your ideas and charts in the comments section below! This is best way to keep it relevant, support us, keep the content here free and allow the idea to reach as many people as possible. **
-------------------------------------------------------------------------------
💸💸💸💸💸💸
👇 👇 👇 👇 👇 👇

Bitcoin at the pivotBitcoin now is trying to break the April pivot ( which is easy IMO ) and as soon as pass that, it can get to 93k resistance
Buyers Still in Control?Price surged from 0.4000, broke the previous high, and reached the 0.4852 resistance level. The current sideways movement around the resistance suggests that sellers lack the strength to push the price lower. Even if a pullback occurs, the 0.4579 – 0.4455 area is expected to act as a support zone, potentially holding the price and allowing the uptrend to continue toward 0.5534 – 0.5652.

(ETH) ethereum one day chart,. I confused the week chart setting for the day and found more optimism than there truly is. Still the line are converging and separating and creating time as a chart to distance oneself from reality only to get lost in the timeframes of trade.

ZEC ANALYSIS🔮 #ZEC Analysis
🌟🚀 #ZEC is trading in an Ascending Triangle Pattern and here we can see that #ZEC testing the ascending trendline. Also there is an instant major support zone. We can see a pullback from its major support zone.
🔖 Current Price: $32
⏳ Target Price: $40
⁉️ What to do?
- We have marked crucial levels in the chart . We can trade according to the chart and make some profits. 🚀
#ZEC #Cryptocurrency #Breakout #DYOR

Algorand Consolidation "Pointing" To An End??Here we can see COINBASE:ALGOUSD is about finished forming a Continuation Pattern, the Bullish Wedge!
Price has made an impressive .50 increase since Trump taking office but has slipped into quite a steep Consolidation Phase where Price has made run for the 88.6% Retracement and seems to be filling out the rest of the "Point" of the Wedge!
Accompanying the Chart Pattern is a Decrease in Volume as well, signaling the tight Consolidation could be looking to make a break soon!
*With a True Breakout, we will want to be vigilant of multiple factors coming into play with Increase of Volume to Validate the Break of Pattern!
Once the Pattern is Confirmed and a Breakout Validated, based on the "Flagpole" of the Pattern, we could expect a potential extension of price to go behind the current Swing High of .6133 and up into the .70 area!

TradeCityPro | VETUSDT Keep an Eye on the Charts!👋 Welcome to TradeCityPro Channel!
Let’s dive into the days when the world is buzzing with interesting events—countries are forming alliances, and news of Trump’s tariffs to negotiations is everywhere. You need to keep a sharp eye on the financial markets and your assets!
🌐 Overview Bitcoin
Before starting the analysis, I want to remind you again that we moved the Bitcoin analysis section from the analysis section to a separate analysis at your request, so that we can discuss the status of Bitcoin in more detail every day and analyze its charts and dominances together.
This is the general analysis of Bitcoin dominance, which we promised you in the analysis to analyze separately and analyze it for you in longer time frames.
📊 Weekly Timeframe
After the bullish move from the 0.01963 support, we got rejected at 0.08271, essentially wiping out the entire move and fully retracing our steps.
We’ve now returned to the 0.01963 support, where we’re forming a solid green indecision candle, backed by noticeable buying pressure. This level has shown a strong reaction, acting as a reliable support.
This could serve as a decent buy trigger with low risk, offering a good entry point. Personally, though, I’m holding off on buying until we see stronger momentum in the chart and market, and until Bitcoin dominance experiences a deeper pullback.
📉 Daily Timeframe
In the daily timeframe, VET is among the coins that have faced a brutal sell-off! From its last peak, it’s dropped roughly 77%, and those without proper risk management have likely been wiped out.
After forming a support box between 0.04224 and 0.05298, we saw a fakeout above the box, signaling further downside. The last time we held support at 0.04224, we couldn’t reach the box’s ceiling, leading to a sharp drop. But after hitting 0.01942, the price has calmed down a bit.
For buying in spot or even futures positions, we’d need a break of the trendline and its trigger at 0.02352 to confirm entry, given the trendline’s retracement nature. If we get rejected from this trendline, a short position in a lower timeframe could make sense. Should 0.01942 break, the downtrend will likely continue. For spot entry confirmation, a surge in volume and a break above 48.68 RSI would be a strong signal.
✍️ Final Thoughts
Stay level-headed, trade with precision, and let’s capitalize on the market’s top opportunities!
This is our analysis, not financial advice always do your own research.
What do you think? Share your ideas below and pass this along to friends! ❤️

LONG BTCBuyers have stepped in and are absorbing all sales by shorts. BTC should trade higher during the following weeks.

BTC/USDT Monthly Outlook📊 BTC/USDT Monthly Outlook – Smart Money Perspective
Bitcoin is currently trading around $83,565, with price consolidating after a Market Structure Shift (MSS) on the higher time frame.
🔹 Key Highlights:
A strong bullish impulse led to a break of monthly structure (MSS), creating Fair Value Gaps (FVG) both above and below.
Price is currently within a monthly FVG, showing indecision and potential for either continuation or deeper retracement.
Liquidity buy side rests near $110,000, marking a logical target if price respects current FVG support.
On the downside, a deeper retracement could aim for the lower FVG and sweep sell-side liquidity around $48,000–52,000.
📌 Scenarios:
Bullish case: Rejection from current FVG zone, followed by continuation toward the buy-side liquidity.
Bearish case: Break below current FVG, targeting the next zone and filling imbalances below.
🧠 Watch how price reacts to the current FVG. Smart money will likely seek liquidity before committing to a clear direction.
⚠️ This analysis is for educational purposes only and not financial advice.
