BTCUSD: Staying bullish with this breakthrough analysis.Bitcoin remains marginally neutral on its 1D technical outlook (RSI = 45.889, MACD = -2304.900, ADX = 28.298) as it erased yesterday's Fed gains. Nevertheless, this doesn't make us lose sight of the bigger picture. On this 1M chart, we have selected all Decembers, as they hold critical importance for BTC Cycles. Both bottoms and tops tend to be priced around them and in between two consolidation phases take place. Don't let the short term volatility cloud your long term perspective. This Cycle hasn't topped yet. Stay bullish.
## If you like our free content follow our profile to get more daily ideas. ##
## Comments and likes are greatly appreciated. ##
Cryptocurrency

ETHUSD: Different asser, same pattern, same ending.Ethereum remains bearish on its 1D technical outlook (RSI = 40.440, MACD = -154.200, ADX = 29.206) but sits at the bottom of its 1 year Megaphone. This is the same pattern that Bitcoin traded on last year and Gold during its most recent Bear Cycle. In all instances, when the price found support on the MA50 and broke over the Megaphone, it reached the 2.0 Fibonacci. According to this, it won't be surprising if we see ETH at 9,000 by the end of the year.
## If you like our free content follow our profile to get more daily ideas. ##
## Comments and likes are greatly appreciated. ##

90-91K seems interesting for short sellingMorning folks,
So, our worryings were not in vain - we've got action to 88-89K area. Now our 4H "222" Sell is completed.
At the same time, now we have the bigger one on a daily chart. Since 90-91K is a rather strong resistance area, we suggest that attempt to sell there should be relatively safe, once the upside AB=CD target around 90.5K will be completed.
So, I mark this idea as "bearish" although price could raise a bit more.

BITCOIN The Ultimate Cycle Model calls for $160k!Bitcoin (BTCUSD) is rebounding following yesterday's Fed Rate Decision. Technically the rebound has already started 10 days ago after the market nearly bottomed on the 1W MA50 (red trend-line). This is the strongest long-term Support level, as it is where BTC priced Lows and rebounded on August 05 2024 and September 11 2023, but it is not the only one.
With the current 2023 - 2025 Bull Cycle pattern being a Channel Up, this is the absolute and ultimate model that has been guiding the price action and can help estimate any future moves. Given that, it's also the 0.382 Fibonacci retracement level that supported both Lows (as well as the current one) on the 1W MA50 mentioned above. As a result, we are so far on a double Support cluster.
The 1W RSI comes in as the 3rd Support, as it hit and is rebounding now on its 2-year Support level, where the bounces of September 07 2024 and September 11 2023 happened. It is also important to mention that the Channel Up can be divided into two phases, Phase 1 (green Channel Up), which traded within the 0.0 - 1.0 Fibonacci range and Phase 2 (blue Channel Up), which trades within the 0.5 - 1.5 Fibonacci range.
The symmetry within those patterns are so high that the two Bullish Legs of Phase one have both rallied by +100.64%. If Phase 2 follows the same dynamic, and there is no reason to assume it won't as the Bearish Legs have been almost identical, we can assume that the Bullish Leg that has just started will rise by +121.48%, same as the previous one (Aug - Dec 2024). That gives us a Target estimate of $160000.
So do you think that BTC has bottomed on this Triple Support Cluster and if so, can it reach $160k by the end of this Cycle? Feel free to let us know in the comments section below!
-------------------------------------------------------------------------------
** Please LIKE 👍, FOLLOW ✅, SHARE 🙌 and COMMENT ✍ if you enjoy this idea! Also share your ideas and charts in the comments section below! This is best way to keep it relevant, support us, keep the content here free and allow the idea to reach as many people as possible. **
-------------------------------------------------------------------------------
💸💸💸💸💸💸
👇 👇 👇 👇 👇 👇

Bitcoin (BTC/USD) – Bullish Breakout in Progress📈 Chart Pattern:
Bitcoin has been trading inside a descending channel for several weeks. Recently, BTC has broken out of the channel’s upper boundary, indicating a potential shift in momentum.
🔹 Key Levels:
Support: $80,043.75 (Critical stop-loss level)
Resistance: $87,500 (Short-term)
Target: $92,944.17 (Upside projection)
📊 Trading Plan:
BTC might retest the breakout zone before continuing the upward move.
A confirmed higher low formation could signal strong bullish momentum.
If BTC remains above $85,500, further upside toward $92,944.17 is possible.
⚠️ Risk Management:
If BTC drops below $80,043.75, the bullish setup could become invalid.
Traders should wait for confirmation before entering long positions.
💡 Conclusion:
This breakout could lead to a strong uptrend, but traders should watch for a successful retest before making a move. 🚀🔍

USDJPY BEARISH CHART ANALYSIS IN 1-HHello Guys Here Is Chart Of USDJPY in 1-H AT
Entry Level: SELL Around 149.800
Resistance: 150.100
Target Will Be : 148.500
If USDJPY breaks upper resistance level, Then It went to go up more and setup invalid

Phemex Analysis #69: Pro Tips for Trading FARTCOIN. FARTCOIN ( PHEMEX:FARTCOINUSDT.P ), once a highly sought-after AI meme coin, experienced a meteoric rise of over 500%, reaching an all-time high of $2.75 following its listing on Phemex. The euphoria was palpable, with investors reveling in their newfound gains.
However, as is often the case in the volatile crypto market, the winds changed. A broader market downturn ensued, and FARTCOIN was not spared. Its price plummeted by more than 92%, hitting a low of $0.1987. The once-celebrated coin seemed to be gasping for air, leaving many to wonder if it would ever regain its former glory.
But in the world of cryptocurrencies, narratives can shift rapidly. FARTCOIN began showing signs of life, bouncing back from the $0.19 area and forming higher lows and higher highs—a classic indicator of a potential bullish run. The community buzzed with speculation: Was this the dawn of a new era for FARTCOIN?
Possible Scenarios and Pro Tips
1. Bullish Reversal
The recent price movements suggested that FARTCOIN might be gearing up for a resurgence. If it could sustain levels above key resistance points, it would signal renewed investor confidence and an upward trend.
Pro Tips:
Breakout Entry: Should the price break above the $0.42 resistance level with substantial trading volume, traders might consider entering long positions, targeting subsequent resistance levels at $0.59, $0.88, and $1.29.
Accumulate Gradually: For those wary of immediate market volatility, employing Phemex's scaled orders to build a position between $2.00 and $4.00 could be a prudent strategy.
2. Continued Downtrend
Yet, the crypto seas are unpredictable. If FARTCOIN failed to maintain its support levels, it could test lower price points, especially if broader market sentiments turned sour.
Pro Tips:
Short Positions: Seasoned traders might explore short-selling opportunities, particularly if the price dips below established support levels at $0.26 or $0.23 with high trading volume.
Buying at Support Levels: Conversely, if the price drops below these support levels with low volume, long-term investors might see this as an opportunity to accumulate FARTCOIN near strong support zones, such as $0.20.
3. Consolidation Phase
There was also the possibility that FARTCOIN would enter a consolidation phase, trading within a defined range as the market sought direction. This sideways movement could persist until new catalysts emerged.
Pro Tips:
Range Trading: Identifying key support levels at $2.6, $2.3, and $2.0, and resistance levels at $0.42 and $0.59, could enable traders to execute buy and sell orders effectively within this range.
Grid Trading: Utilizing Phemex's Grid Bot could allow traders to automatically capitalize on small price movements within the trading range, optimizing gains during periods of consolidation.
Conclusion
FARTCOIN's journey reflects the dynamic nature of the cryptocurrency market. From its rapid ascent to its subsequent decline and potential recovery, FARTCOIN exemplifies the volatility inherent in digital assets. By staying informed, employing strategic trading approaches, and exercising prudent risk management, traders can better navigate the opportunities and challenges presented by such assets.
Tips:
🔥 Break free from "buy low, sell high"! Our new Pilot Contract empowers you to profit from ANY market direction on DEX coins with up to 3x leverage. Go long, go short, go further!
Check out Phemex - Pilot Contract today!
Disclaimer: This is NOT financial or investment advice. Please conduct your own research (DYOR). Phemex is not responsible, directly or indirectly, for any damage or loss incurred or claimed to be caused by or in association with the use of or reliance on any content, goods, or services mentioned in this article.

MSTR: Is 300 Enough?MicroStrategy is seeing tremendous strength off the lows along with the rest of the crypto space. We are eyeing this 300 level to see if it offers a proper buy zone to coincide with Bitcoin 85,000 which has also seen tremendous outperformance relative to equities. Watch the overhead trendline drawn here as well as Bitcoin 90,000 for profit takes or continuations. We will decide which if and when we get there.

FLOKIUSD Channel Up bottomed. Best buy level for $0.001FLOKI is trading inside a Channel Up since the June 13th 2022 Bear Cycle bottom.
As the 1week RSI touched 35.00 and is holding, this is technically a strong buy indicator long term.
The price just broke below the 0.5 Fibonacci level and touched the bottom of the 3 year Channel Up.
There is no better buy signal than this. Buy and target 0.001 (just under the 1.5 Fib extension).
Follow us, like the idea and leave a comment below!!

BNBUSD Cup and Handle can now target $1000Binance Coin / BNBUSD is trading inside a Cup and Handle pattern for the entirety of its Cycle.
Right now it is forming the Handle part with the 1week RSI neutral. Technically that is an ideal long term buy opportunity.
Last week could be the bottom and we expect another +98.69% rebound such as on August 5th 2024.
Buy and target $1000.
Follow us, like the idea and leave a comment below!!

DOGEUSD preparing the final rally to $1.00Dogecoin / DOGEUSD has hit this month and so far holding its 1month MA50.
This Cycle isn't that different from the previous two, although it is naturally a not as aggressive as the market has matured.
According to the 1week RSI, the market is at the bottom of the final Bull Cycle pull back before the final rally for the Cycle Top.
We expect it to reach at least $1.00 by the end of this year.
Follow us, like the idea and leave a comment below!!

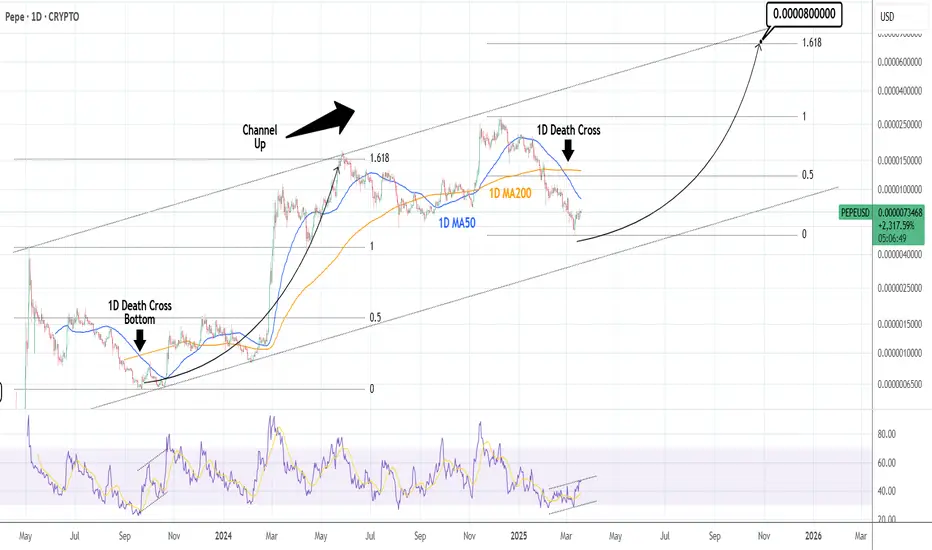
PEPEUSD: Bottom highly likely priced. Target 0.00008.Pepe turned neutral on its 1D technical outlook (RSI = 46.389, MACD = 0.000, ADX = 26.088) as it has been on a small short term bounce but still limited under the 1D MA50. The latter is the level to break as it has been the Resistance of this bearish wave of the 2 year Channel Up with two rejections on Jan 17th and Jan 2nd. The recovery on the 1D RSI is a strong sign of a bottom, much like September 20th 2023. Technically that took place on a 1D Death Cross, a formation we completed 4 weeks ago. The bullish wave that started then, hit the 1.618 Fibonacci extension. Long term trade is buy, TP = 0.00008.
## If you like our free content follow our profile to get more daily ideas. ##
## Comments and likes are greatly appreciated. ##
ETHEREUM Megaphone bottom like March 2020Ethereum (ETHUSD) is currently on the first week of rebound after 3 straight red weeks when it was unable to break above the 1W MA50 (blue trend-line). This is taking place on a Lower Lows trend-line, technically the bottom of a 1-year Megaphone since the March 11 2024 High.
The market is no stranger to long-term Megaphone consolidation periods like that as last time we saw this was on the June 2019 - March 2020 Megaphone, which eventually broke upwards after the brutal COVID crash Bearish Leg that touched bottom. This is quite similar to the current Bearish since late December. Notice how perfectly aligned the Fibonacci retracement levels are.
Based on this, we expect at least a 1.5 Fibonacci extension test at $6000 before this Cycle tops at the end of the year.
-------------------------------------------------------------------------------
** Please LIKE 👍, FOLLOW ✅, SHARE 🙌 and COMMENT ✍ if you enjoy this idea! Also share your ideas and charts in the comments section below! This is best way to keep it relevant, support us, keep the content here free and allow the idea to reach as many people as possible. **
-------------------------------------------------------------------------------
💸💸💸💸💸💸
👇 👇 👇 👇 👇 👇

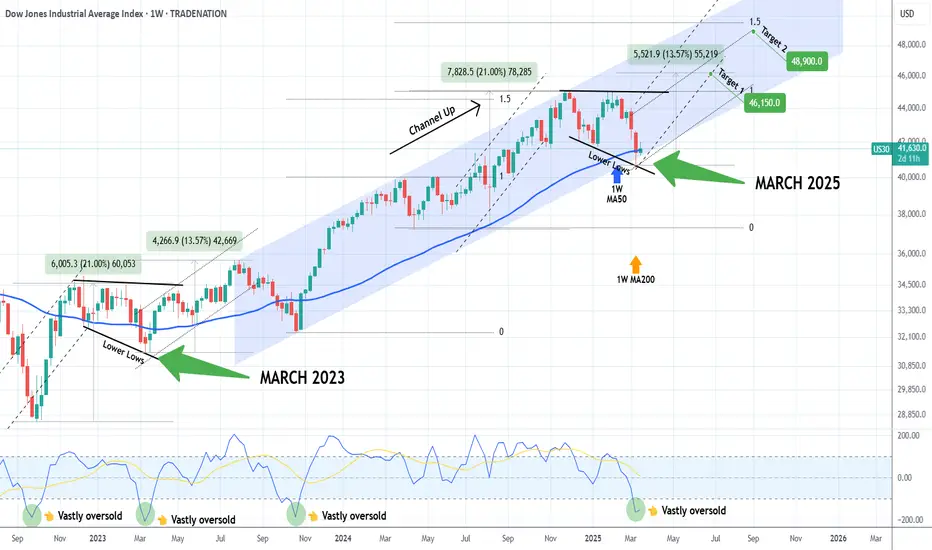
DOW JONES This is why chances of a brutal rebound are so high.Dow Jones (DJIA) has been trading within a Channel Up since the July 31 2023 High and last week it hit (marginally breached) its 1W MA50 (blue trend-line) for the first time since the week of October 30 2023. The price went on to test the bottom of the Channel Up and rebounded back above the 1W MA50.
This is an incredibly strong long-term bullish signal and it is not the only one. The market also made a Lower Low rebound on the 3-month trend-line while the 1W CCI got oversold below -150.00 and is rebounding. The last time we got these conditions fulfilled was exactly 2 years ago on the March 13 2023 Low.
That was when the index made a similar Megaphone Lower Low rebound on oversold 1W CCI that initiated a +13.57% rally. Both Megaphone fractals emerged after Dow rose by +21.00%.
In fact, every oversold 1W CCI rebound has produced very aggressive rallies. Based on those similarities with the March 2023 fractal, we expect the index to hit 46150 (+13.57%) minimum by July. If the more aggressive scenario of the November 25 2024 rally that made a Channel Up Higher High on the 1.5 Fibonacci extension prevails, then our more optimistic scenario is 48900 (Target 2) by September, which could technically be the end/ Top of the current Bull Cycle.
-------------------------------------------------------------------------------
** Please LIKE 👍, FOLLOW ✅, SHARE 🙌 and COMMENT ✍ if you enjoy this idea! Also share your ideas and charts in the comments section below! This is best way to keep it relevant, support us, keep the content here free and allow the idea to reach as many people as possible. **
-------------------------------------------------------------------------------
Disclosure: I am part of Trade Nation's Influencer program and receive a monthly fee for using their TradingView charts in my analysis.
💸💸💸💸💸💸
👇 👇 👇 👇 👇 👇
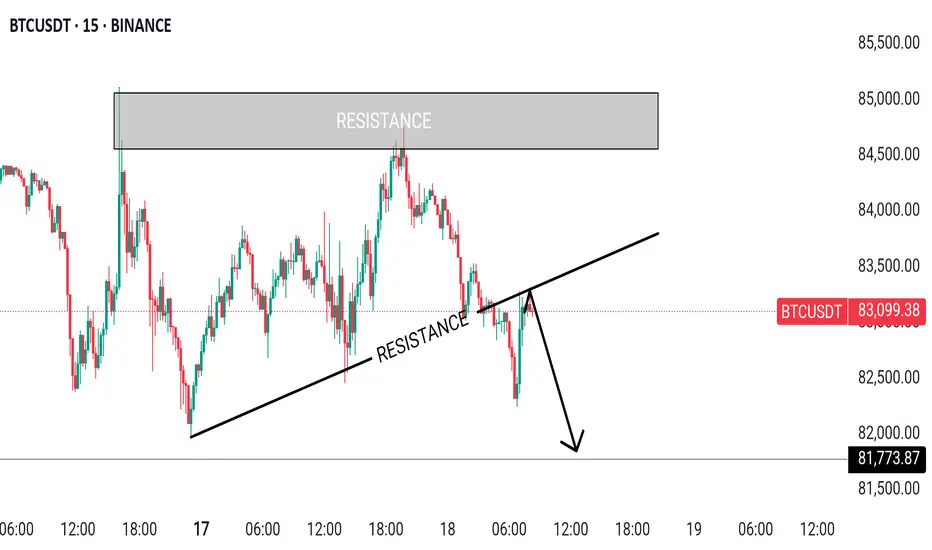
BTCUSDT IN 15-M CHART MAPPINGHello Guys Here Is Chart Of BTCUSDT in 15-M AT
Entry Level: SELL Around 83200
Resistance: 84200
Target Will Be : 81700
BTC Retest below this level, And then it went to more further downside could.
The Bitcoin Google trends wedge pattern. Good day traders & investors,
Is the Google trends search for Bitcoin about to explode ?! The chart pattern is a bullish one. The Google trend search topped out back in 2017 and has been in a wedge pattern since then. The search/interest recently broke out of this 8 year wedge pattern and this month retested the breakout. This is typically a bullish pattern and shows the interest and search volume is picking up and could very soon explode again.
The settings for this search was world wide , bitcoin and a custom time interval set from Jan 1st 2009 to Mar 19th 2025
Since inception the interest for Bitcoin gained volume/growth until it peaked in 2017. Ever since then the interest and searches has been making lower lower highs until very recently (last Oct) where it made a higher high as it broke out of this wedge. Also, since 2017 while making lower highs the google trend has been making higher lows, thus forming this wedge pattern. The break out and retest of this pattern is what shows the signs of strength and a possible explosion of interest in the near future.
I have underlaid both timelines of the price and the Google trend to match, and we can clearly see that when the search trend rises, so does the price which shows a strong correlation.
All of my other cycle analysis shows that May/June time could see higher prices, so you could say this is a sneak peak or confluence to other indicators.
Let me know what you think in the comments below what you think. Does Google trend holds any weight? Do you think this wedge pattern and break out could lead to anything big?
Please like and share. My socials are listed in the bio
Kind regards,
WeAreSatoshi

BITCOIN The 2021 Pivot trend-line that is coming to its rescue.Bitcoin (BTCUSD) has stayed stable after last week's rebound on the 1W MA50 (blue trend-line), which has been the level that offered support on the Bull Cycle Channel's previous Higher Low (August 05 2024).
Technically however, that is not the only major Support level that may be coming to BTC's rescue as we've identified the Pivot trend-line that started on the April 12 2021 High as a Resistance and since then made another 2 contacts (as rejections). This is the first time now that is being tested as Support.
During the previous Cycle (2018 - 2021) a similar Pivot trend-line was the level that supported Bitcoin during the last year of its parabolic rally on January and June 2021. The June 2021 contact in particular tested the 1W MA50 as well, which is the exact situation we're in right now. That double support hold initiated the final rebound towards the Cycle's new All Time High (ATH).
Check also how similar the 1W CCI patterns between the two fractals are and based on that, a 1W CCI reading at 200.00 would be a solid level to sell and take profit. As a result, we expect this Cycle's Channel Up to accelerate the current rebound, technically its Bullish Leg and make a new ATH, which would be the Cycle's new Top, ideally with a CCI at 200.00.
So do you think this cyclical Pivot trend-line is coming along with the 1W MA50 to BTC's rescue? Feel free to let us know in the comments section below!
-------------------------------------------------------------------------------
** Please LIKE 👍, FOLLOW ✅, SHARE 🙌 and COMMENT ✍ if you enjoy this idea! Also share your ideas and charts in the comments section below! This is best way to keep it relevant, support us, keep the content here free and allow the idea to reach as many people as possible. **
-------------------------------------------------------------------------------
💸💸💸💸💸💸
👇 👇 👇 👇 👇 👇

Bitcoin weekly RSI levelthe bitcoin price & RSI level is so get involved together.
the RSI weekly level at 44 & weekly candles at 80k seems a very strong support now.

BTCUSD: This isn't the Top by any meansBitcoin remains slightly bearish on its 1D technical outlook (RSI = 41.137, MACD = -3097.700, ADX = 33.471) as even though it appears its trading on a macro bottom, just over the 1W MA50 (1W RSI = 45.068), it hasn't broken out yet. The market undoubtedly took a psychological hit with February's drop but despite the voices calling for a new bear market, we are here to show you why this Cycle hasn't topped yet and is still far from doing so.
This metric measures BTC's temporary stops/ tops during a Bull Cycle. It is a Halving-to-Halving method, starting on the most recent Halving and ending on the next one. Stop 1 is where the starting Halving takes place and the market pulls back. Stop 2 is the next pullback on the 0.236 Time Fibonacci level. The 0.382 Fib prices Stop 3 and basically the Cycle Top. This has been happening on both previous Cycles exactly as described and on the 2012-14 Cycle it just had to be adjusted a little before the 1st Halving due to the Cycle being much shorter since it was the earliest. Nevertheless, it fits the Stop points perfectly.
Note also that distance from the Halving (Stop 1) to Stop 3 has always been 76/78 weeks. This suggests the we can have a new Cycle Top by October 20th 2025 the latest.
## If you like our free content follow our profile to get more daily ideas. ##
## Comments and likes are greatly appreciated. ##

Ethereum wooing toward 2022 lowsEthereum's momentum has been underwhelming to say the least. WIth network upgrades and future developments not showing a whole lot of pizzaz, Ethereum looks as it is heading toward 2022 lows near the $1,200 level. Is it a buy from there?

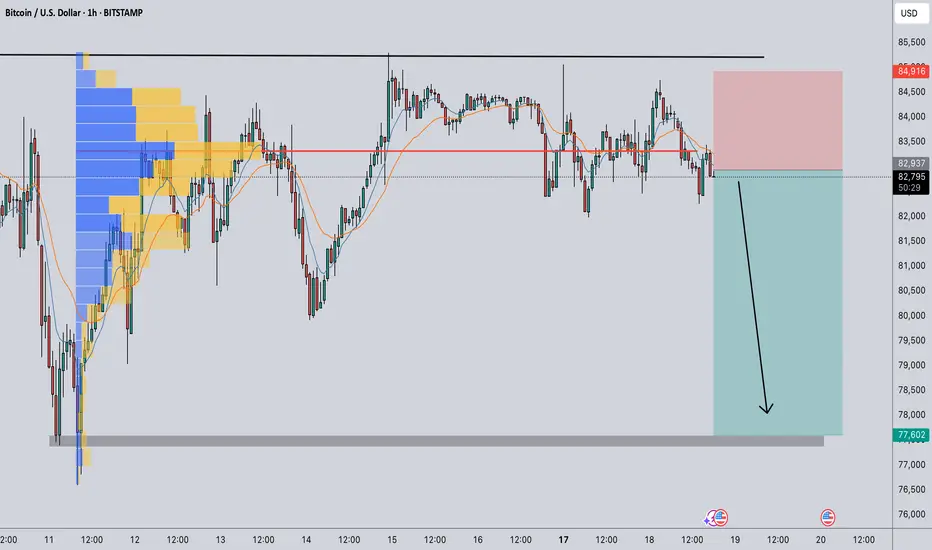
BITCOIN HEADING TO 77600 LEVELIt seems that there's an atmosphere of panic. When traders see significant price drops, it can lead to a cascade of selling, with more people fearing losses. This fear can create a liquidity trap where those entering long positions are quickly taken out as prices continue to decline.
In such scenarios, liquidations occur when leveraged positions are forcibly closed by exchanges to prevent further losses, which adds even more selling pressure. The cycle can become self-reinforcing; as prices dip, more traders panic and sell, leading to further declines.
Based on this scenario, I am confident in entering a short position with a favorable risk-to-reward ratio toward the 77600 level.
Follow me for more analysis
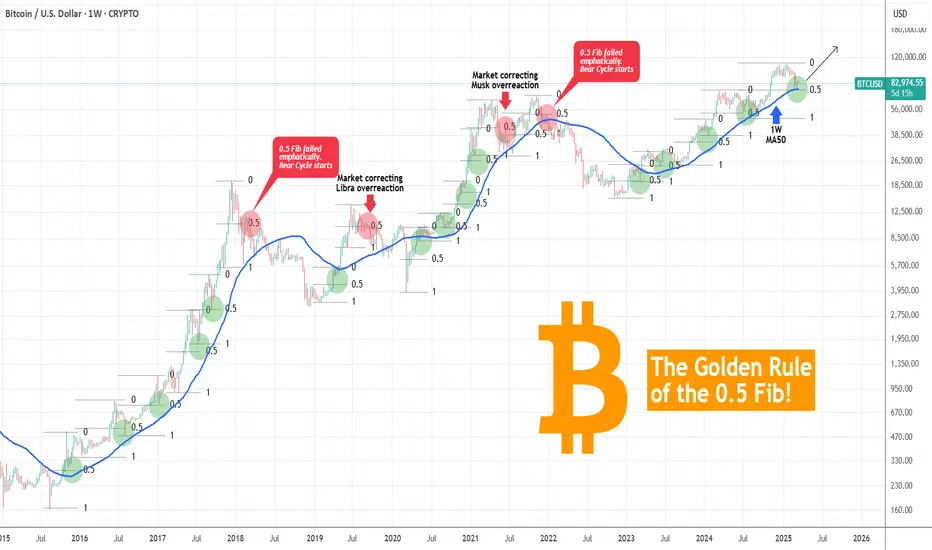
BITCOIN The 0.5 Fib Golden Rule! This is not a Bear Market yet!Bitcoin (BTCUSD) shook the bullish market sentiment last month, as late February saw it drop aggressively not just from the 109k All Time High (ATH) but also below the key psychological Support of $90000. We have discussed already how the 1W MA50 (blue trend-line) coming to its rescue, is the critical Support and rightfully so, but there is also another critical condition that is currently showing incredible strength, keeping BTC into Bull Cycle territory (for now).
That is the 0.5 Fibonacci retracement level Golden Rule. This suggests that BTC's corrections/ pull-backs up to the 0.5 Fib level are technical and perfectly systemic, especially with the 1W MA50 supporting. If anything, such pull-backs during a Bull Cycle are the most optimal buy opportunities. We are currently on an exact such opportunity as the price hit last week both the 1W MA50 and the 0.5 Fib.
In the past 10 years since the August 2015 Bear Cycle bottom, every correction up to the 0.5 Fib was a buy. In the 4 cases it broke, 2 were the signals of the 2018 and 2022 Bear Cycles and the other 2 signals of the market correcting the bullish overreaction to the Libra (2019) and Musk (2021) rallies. The latter though was still contained above the 1W MA50 and so would the 2019 one if it wasn't for the March 2020 COVID crash.
As a result, we still see no cause for concern (yet) and so far this is the best buy opportunity for Bitcoin since last year and the August 05 2024 Low.
But what do you think? Is this 0.5 Fib Golden Rule coming to push Bitcoin higher to its next ATH? Feel free to let us know in the comments section below!
-------------------------------------------------------------------------------
** Please LIKE 👍, FOLLOW ✅, SHARE 🙌 and COMMENT ✍ if you enjoy this idea! Also share your ideas and charts in the comments section below! This is best way to keep it relevant, support us, keep the content here free and allow the idea to reach as many people as possible. **
-------------------------------------------------------------------------------
💸💸💸💸💸💸
👇 👇 👇 👇 👇 👇
XAUUSD BULLISH PENNANT PATTERN IS HEREHello Guys Here Is Chart Of XAUUSD in 1-H AT
Entry Level: BUY Around 2997
Support: Lower Level of Pennant 2990 -2985
Target Will Be : 3020 ALL TIME HIGH
XAUUSD already breaks resistance level, The Pennant pattern is Actived Gold touch around new higher level.
