ZEN/USDT VOLUME INCREASEZEN/USDT VOLUME INCREASE
This coin shows a new volume start which can be confirmed.
Cryptocurrency

ETHUSD: MA Bullish Cross triggering rally to 4,300Ethereum is marginally neutral on its 1D technical outlook (RSI = 55.733, MACD = -18.850, ADX = 38.044), which along with today's rise, indicates the high upside potential of this move. The 1D MA100 has crossed over the MA200, forming a rare Bullish Cross that we last saw on December 12th 2023 and March 3rd 2023. That was a technical buy signal that targeted on a minimum the 4.0 Fibonacci extension. That is our target (TP = 4,300).
## If you like our free content follow our profile to get more daily ideas. ##
## Comments and likes are greatly appreciated. ##

Ice/UsdtOKX:ICEUSDT
**Ice Coin Overview**
- **Market Cap**: $39.5M 📊
This represents the total market value of all Ice Coin in circulation. It’s a key indicator of the asset's size in the crypto market.
- **24h Volume**: $10M 💵
This is the total trading volume in the last 24 hours. A higher volume usually indicates increased interest and activity in the coin, which could lead to price changes.
- **Fully Diluted Valuation (FDV)**: $126.32M 💎
FDV represents the total value of the coin if all tokens were in circulation. It gives a sense of the potential market value based on the total supply.
- **Total Supply**: 2.115B (2.115 billion coins)
This is the maximum number of Ice Coin that will ever exist. The current circulating supply may be smaller, but this is the cap for the coin's supply.
- **Current Price**: $0.005967 💰
This is the current trading price of the Ice Coin in the market. At this price, the coin is relatively low, and small price changes could have a larger percentage impact.
---
### **Resistance and Support Levels Explained**
- **Resistance**: $0.00600 📈
Resistance levels are price points where selling pressure is strong enough to halt the price from going higher. For Ice Coin, **$0.00600** is the immediate resistance level. If the price breaks and holds above this point, it could indicate continued bullish momentum (price moving up).
- **Next Resistance Levels**:
- **$0.0069534** 🚀
- **$0.00700** 🚀
These are the next levels where price could face resistance after breaking the $0.00600 mark. If the price successfully reaches and holds these levels, it indicates strong upward momentum. Traders will likely be watching these points to see if Ice Coin can break through and continue growing.
---
- **Support**: $0.05643 ⚖️ & $0.05500 ⚖️
Support levels are price points where buying pressure is expected to be strong enough to prevent the price from falling lower. If Ice Coin doesn't manage to break through the $0.00600 resistance, it could fall back to these support levels. If the price holds at these points, it may bounce back upward.
- **Next Support Levels**:
- **$0.00500** ⚖️
- **$0.00400** ⚖️
These are critical support levels where the price could find a strong buying interest if it falls below $0.05643. If the price drops below these support levels, it may indicate a bearish trend, and the price could continue to fall.
---
### **What This Means for Traders**
- **Increased Volume**: If trading volume increases, it could signal that more people are interested in buying or selling Ice Coin, which could push the price either upward (bullish) or downward (bearish), depending on how the buying and selling balance out. The volume is a key indicator to watch.
- **Breaking Resistance**: If the price breaks the $0.00600 resistance and holds above it, this would be seen as a bullish signal, meaning the price could keep rising. The next target would be $0.0069534 or $0.00700.
- **Falling Below Support**: If the price can’t hold the support levels at $0.05643 or $0.05500, the next downside targets are at $0.00500 and $0.00400. This would be seen as a bearish trend, and traders would be cautious about the price dropping sharply.
---
**⚠️ Important Note**:
This is **not financial advice**. Cryptocurrency is highly volatile, and prices can change quickly. Always do your own research (DYOR) and consider consulting with a financial advisor before making any trading decisions. 🚫
---

TradeCityPro | DYDX: Daily Trend Line Reaction & Momentum Shift👋 Welcome to TradeCityPro!
In this analysis, I will examine the DYDX coin, which is associated with the DYDX exchange, one of the well-known decentralized exchanges (DEXs) with a focus specifically on futures.
📅 Daily Timeframe: Reaction to the Curved Trend Line In the daily timeframe, after a price drop and recording new lows, we observed a rounding at the bottom of the chart which gradually reduced the bearish momentum and selling volume in the market, followed by an influx of bullish volume and momentum.
✨ After breaking through $1.4362, the price moved upwards more freely, breaking the $1.8702 area and continuing its movement up to $2.5747. However, it could not stabilize in these areas and started correcting, eventually falling back to $1.4362.
📈 The market volume has been decreasing during the bearish phase, gradually diminishing, which indicates the strength of the bullish trend. In my opinion, if we observe a trend change in the shorter timeframes, the next price leg will begin.
🛒 The main price trigger for going long is breaking $2.5747, but an earlier and riskier trigger would be $1.8702. For spot purchases, the trigger at $2.5747 is suitable, but the main trigger will be at $4.3949.
📝 Final Thoughts
This analysis reflects our opinions and is not financial advice.
Share your thoughts in the comments, and don’t forget to share this analysis with your friends! ❤️

ETH ChartHey,
Since December 9th, markets have mostly pulled back, with ETH and RUNE doing what we expected and shared in our community.
My bullish conviction on ETH was a bit too strong with the crazy inflows, but my overall outlook remains positive for 2025.
ETH is now stalling on its upper wedge trend line, likely consolidating before new highs.
ETF holdings for ETH have grown by 64%, showing continued bullish sentiment.
Expecting more upside and the ETH target remains the same for me.
Kind regards,
Max Nieveld

SUIUSD Still holding the 1D MA50 after 4 months! Bullish to $10.Sui (SUIUSD) has been trading within a Channel Up since the August 05 2024 market bottom. The last 10 days of December are seeing a vicious test of the 1D MA50 (blue trend-line), which is so far holding as Support.
In fact the last time we had a 1D candle close below it, was 4 months ago (September 05 2024). With the 1D RSI making a bullish reversal and breaking above its MA (yellow trend-line) while the 1D MACD is about to make a Bullish Cross, both indicators in similar fashion as the bottoms of October and September 2024, we treat the current consolidation above the 1D MA50 as the strongest buy signal of the past 2 months.
The previous two Bullish Legs both rose by exactly +219.25%, so our Target is currently a little below that margin at $10.000.
-------------------------------------------------------------------------------
** Please LIKE 👍, FOLLOW ✅, SHARE 🙌 and COMMENT ✍ if you enjoy this idea! Also share your ideas and charts in the comments section below! This is best way to keep it relevant, support us, keep the content here free and allow the idea to reach as many people as possible. **
-------------------------------------------------------------------------------
💸💸💸💸💸💸
👇 👇 👇 👇 👇 👇

RAY ANALYSIS📊 #RAY Analysis
✅There is a formation of Descending triangle pattern on 8hr chart with a breakout 🧐
Pattern signals potential bullish movement incoming after a consolidation
👀Current Price: $5.366
🚀 Target Price: $6.390
⚡️What to do ?
👀Keep an eye on #RAY price action and volume. We can trade according to the chart and make some profits⚡️⚡️
#RAY #Cryptocurrency #TechnicalAnalysis #DYOR

Phemex Analysis #49: How to Trade FARTCOIN Like a Pro. FARTCOIN ( PHEMEX:FARTCOINUSDT.P ) has taken the crypto world by storm this week, skyrocketing nearly 100% in value and capturing the attention of traders everywhere. This meteoric rise is fueled by its unique positioning as a blend of AI agents and meme coin culture, a combination that has resonated with the market. Riding the wave of the surging AI Agents category—led by heavyweights like VIRTUALS and AI16Z—FARTCOIN has solidified its place as one of the hottest tokens in the space.
But with such explosive growth comes volatility, and traders are now asking: What’s next for FARTCOIN? Today, we’ll analyze its key support and resistance levels to craft a trading plan that prepares for multiple scenarios. Whether you’re chasing highs or looking to buy dips, understanding these levels is crucial to navigating FARTCOIN’s unpredictable journey.
Scenario 1: The Bullish Surge Continues
Imagine this: FARTCOIN’s rally shows no signs of slowing down. Buyers keep piling in, pushing the price past its immediate resistance at $1.433, followed by $1.482—both key levels that could signal continued bullish momentum. If this breakout happens with high trading volume, it might present an opportunity for traders to ride the wave higher.
However, it’s essential to remain cautious as prices approach psychological resistance levels like $2.00 and $3.00. These round numbers often act as profit-taking zones where traders cash out, creating potential pullbacks. For those looking to capitalize on this scenario, timing is everything—chasing highs can be lucrative but also risky if momentum fades.
Scenario 2: A Healthy Retracement
Even the hottest coins need to catch their breath after a massive rally, and FARTCOIN might be no exception. In this scenario, we could see a temporary retracement as the price dips back toward $1.25—a key support level—to consolidate and build strength for another move upward.
If trading volume decreases during this pullback, it could signal that sellers are losing steam while buyers quietly accumulate positions. Prices might bounce between $1.25 and $1.43 during this phase, forming a base for the next leg up.
For traders considering an entry during this consolidation phase, risk management is critical. Setting a stop-loss just below $1.25 can help protect against unexpected drops. Alternatively, you could wait for a confirmed breakout above $1.43 before entering to ensure momentum is back on your side.
Scenario 3: The Bearish Reversal
While optimism surrounds FARTCOIN’s recent performance, it’s important to remember that anything is possible in the volatile world of crypto trading—including a bearish reversal. If prices break below $1.25 with high selling volume, it could signal a deeper correction ahead.
In this case, traders should watch for support levels at $1.08, $1.00, and even as low as $0.88. These zones might attract long-term bullish investors looking to “buy the dip,” but caution is warranted if bearish momentum continues to dominate.
For those who believe in FARTCOIN’s long-term potential, these lower levels could present attractive buying opportunities—but only if you’re prepared to weather short-term volatility.
Trading FARTCOIN Like a Pro
Navigating FARTCOIN’s wild price movements requires discipline and adaptability. Here are some tips to trade like a pro:
•Stay flexible: Prepare for all three scenarios—bullish breakout, consolidation, or bearish drop—and adapt your strategy accordingly.
•Manage risk: Use stop-loss orders to protect your capital in case of unexpected reversals.
•Take profits strategically: Don’t get greedy; consider taking partial profits near key resistance levels like $2.00 or $3.00.
•Follow the Volume: High trading volume often confirms the strength of a breakout or breakdown, so keep an eye on this critical indicator.
•Be patient: If you’re unsure about entering during consolidation or retracements, wait for clear signals before committing your funds.
FARTCOIN’s story is far from over—it’s just getting started. Whether it continues its meteoric rise or takes a breather before its next move, understanding key levels and scenarios will help you trade with confidence amidst the chaos of crypto markets!
Tips:
Elevate Your Trading Game with Phemex. Experience unparalleled flexibility with features like multiple watchlists, basket orders, and real-time adjustments to strategy orders. Our USDT-based scaled orders give you precise control over your risk, while iceberg orders provide stealthy execution.
Disclaimer: This is NOT financial or investment advice. Please conduct your own research (DYOR). Phemex is not responsible, directly or indirectly, for any damage or loss incurred or claimed to be caused by or in association with the use of or reliance on any content, goods, or services mentioned in this article.

IOTA/USDT NEW INCREASE PossibilityIOTA/USDT NEW INCREASE Possibility
Data shows that IOTA can show new volume coming time frames.

BTCUSD: Williams bounce points to $119k next.Bitcoin is neutral on its 1D technical outlook (RSI = 52.385, MACD = -483.200, ADX = 34.048) and just today it hit its 1D MA50, which is the first sign of restoring the bullish trend. The strongest bullish indicator is the Williams%R, which has rebounded rapidly since turning oversold at -93.00. Every time it hit that level and rebounded since July 2024, it rallied by +30%. Consequently, we aim for just under that level (TP = 115,000).
## If you like our free content follow our profile to get more daily ideas. ##
## Comments and likes are greatly appreciated. ##

TradeCityPro | MEMEUSDT Potential Breakout from the Range Box👋 Welcome to TradeCityPro Channel!
Let’s dive into analyzing our coins in the current market conditions to identify potential triggers before the next move begins.
🌐 Overview Bitcoin
Before starting today’s altcoin analysis, as usual, let’s first check Bitcoin on the 1-hour timeframe. Bitcoin has finally initiated a wave, breaking through the 95753 resistance.
However, I’m not fond of the volume in these recent candles, and it needs to increase. You can consider opening positions upon entering the overbought zone.
Additionally, today saw a short-term wave with some green candles, accompanied by a decline in Bitcoin dominance. Now, as Bitcoin prints green candles, its dominance is also rising, indicating that the next wave moving toward Bitcoin’s peak might come with increased dominance.
📊 Weekly Timeframe
On the weekly timeframe, the altcoin MEME rejected the top of the range and the significant 0.01790 resistance, pushing it back toward the range’s bottom.
The buy trigger hasn’t activated yet, and this rejection has made the trigger even more critical. If you’re interested in buying this altcoin, consider adding it to your mid-term portfolio after breaking 0.01790.
If you’ve already bought at any level on this chart, it’s logical to exit and cut losses if the range’s bottom breaks. A break below 0.00997 would suggest forming new lows, so it’s better to liquidate and look for a fresh trigger later.
📈 Daily Timeframe
On the daily timeframe, following a heavy rejection from the 0.1795 resistance, MEME returned to the range, resulting in continued oscillations within this area.
We must consider that, price-wise, the market is at a logical level for buying. However, time-wise, it might range here for a while before starting a potential upward move. This makes it somewhat reasonable to take small spot risks during these days.
Based on the above, you can make a risky buy at 0.01132, with a stop-loss at 0.00861, after breaking the level. However, personally, I’ll hold onto liquidity for lower levels.
For example, if I have 30% of my funds in cash, any purchases I make here would amount to just 5% overall, assuming stop-losses are hit! For a more logical entry, I’ll monitor for a break above 0.01795.
⏱ 4-Hour Timeframe
On the 4-hour timeframe, MEME has been ranging for days within the 0.01007–0.01139 box. A breakout from either side of this range will provide a clear trigger without bias.
📈 Long Position Trigger
the rejection at the 0.01139 resistance has increased its significance. Once this level breaks, I’ll open a futures long position with a large stop-loss at 0.01.
📉 Short Position Trigger
momentum can be tracked on lower timeframes, and positions can be opened with triggers on these smaller timeframes. The 0.01 support level could be used for a small stop-loss and low-risk, quick profit management.
📝 Final Thoughts
Stay calm, trade wisely, and let's capture the market's best opportunities!
This analysis reflects our opinions and is not financial advice.
Share your thoughts in the comments, and don’t forget to share this analysis with your friends! ❤️

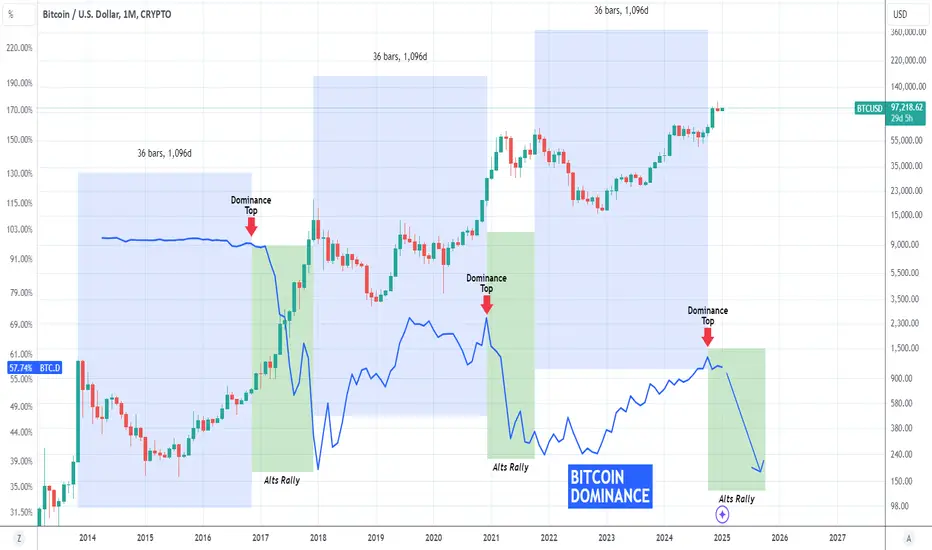
BITCOIN Dominance drop is about to trigger a massive Altseason!Bitcoin (BTCUSD) closed December on a marginally bearish 1M candle and is expected to start the 3rd year (2025) of the current Bull Cycle on strong bullish pressure.
As you can see on this chart, BTC Dominance (blue trend-line) has started to decline already since October 2024. That is when Bitcoin completed 36 months (1096 days) from the previous Cycle top (green candle).
This is a highly cyclical pattern as BTC Dominance during previous Cycles dropped every time Bitcoin completed 36 months from the previous All Time High (ATH). That was when the Altseason started, which is the most aggressive part of the Altcoin market.
Based on this chart we are about to see an accelerated drop on Bitcoin's dominance, with earnings and added capital being transferred to Altcoins, causing a new Altseason.
-------------------------------------------------------------------------------
** Please LIKE 👍, FOLLOW ✅, SHARE 🙌 and COMMENT ✍ if you enjoy this idea! Also share your ideas and charts in the comments section below! This is best way to keep it relevant, support us, keep the content here free and allow the idea to reach as many people as possible. **
-------------------------------------------------------------------------------
💸💸💸💸💸💸
👇 👇 👇 👇 👇 👇
W/USDT BREAK POSSIBILITYW/USDT BREAK POSSIBILITY
Following the last volume data which can have a break in the coming time.

First Bitcoin Super Cycle closingWe might be nearing the end of the first Bitcoin Super Cycle. There will be lots of volatility and fear among the retails. But on-chain observation shows that big players are storing coins on unprecedented levels.
What the next Super Cycle will be, can't tell. More data is needed in its beginning.
But financial institutions needs a more predictable, more controllable and most of all fixed cap assets. I am not talking about Bitcoin only, but in general about crypto currencies. There are interesting PoW projects that resembles Bitcoin, but has added extras like privacy and smart contracts.
But when time comes, crypto prices will skyrocket and there will be no corrections and no bear markets until the transitional period ends. Most retails will sell cheap and re-enter with more than 90% loss in coins.
It is NOT a financial advice.

AAVE, Break out and bullish move eminent? Aave looks like it's building momentum that could break out of the bull flag/pennant. A break out of this formation could lead to $175 move in fairly short deration.
The technical trade is the break out and a hold of the break out. If it were to fall back in the zone it is considered a fake out.
Either way you cut it, AAVE is good price here for long term growth.
Let me know what you think AAVE and this analysis down below.
Kind regards
WeAreSat0shi

SOLUSD charging for the 1D MA50. New rally started.Solana (SOLUSD) made a new 10-day High as it is rising aggressively today towards the 1D MA50 (blue trend-line), which is the first level of Resistance. We expect this rally to be the start of the new Bullish Leg of the 5-month Channel Up for three reasons.
Firstly, last week's Low was exactly on Support Zone 2, which is the pivot level of the October 29 High. We've had the same bounce on Support Zone 1 when the previous Bullish Leg of the Channel Up started on September 06 2024.
Secondly, the December Low almost tested the 1D MA200 (orange trend-line) before rebounding, which is the long-term Support. This is now exactly on the bottom of the Channel Up.
Thirdly, the December 22 Low also made the 1D RSI rebound on the oversold barrier (30.00). As you can see, every time the RSI touched this oversold level since April 13 2024, it was a strong buy signal to at least the 0.786 Fibonacci retracement level.
As a result, our short-term Target 1 is $242.00 (the 0.786 Fib). Beyond that, if the price breaks above Resistance 1 (265.00), we will buy the bullish break-out and target the top (Higher Highs trend-line) of the Channel Up at $380 (Target 2). As you can see, that would be a +119% rise from the December Low, similar to the % rise of the first Bullish Leg.
-------------------------------------------------------------------------------
** Please LIKE 👍, FOLLOW ✅, SHARE 🙌 and COMMENT ✍ if you enjoy this idea! Also share your ideas and charts in the comments section below! This is best way to keep it relevant, support us, keep the content here free and allow the idea to reach as many people as possible. **
-------------------------------------------------------------------------------
💸💸💸💸💸💸
👇 👇 👇 👇 👇 👇

TradeCityPro | ANKR: Weekly Long-Term Box and Gradual Channel👋 Welcome to TradeCityPro!
In this analysis, I will examine the ANKR coin, which is part of the infrastructure for Web3 and other blockchain projects, with significant partners like Binance and Polygon.
📅 Weekly Timeframe: Long-Term Box with a Slight Incline Channel I will perform this analysis mainly using Fibonacci levels to identify crucial areas. In this timeframe, we can see the price movement from the previous alt season, which had significant growth followed by a decline after breaking the 0.236 Fibonacci level, correcting down to the 0.5 Fibonacci level.
🔍 The support at $0.01728, which coincides with this Fibonacci level, is currently the most crucial support on this chart. Since the price bottomed out in this area, we have seen a very gently sloping upward channel that has reacted three times and had one fake break above the ceiling before returning to the box.
📊 Given the greater ratio of buying to selling volume, I see a higher likelihood of the channel breaking upwards and the price increasing. The RSI has also risen from the 50 level, which could generate bullish momentum. The current main ceiling appears to be $0.06131, which coincides with the 0.236 Fibonacci level and represents a strong resistance.
📈 If the price rises and breaks through $0.06131, the next resistance will be at $0.19012, which is the all-time high (ATH) for the price. I will determine higher targets using Fibonacci extensions.
🔽 In a bearish scenario, the first support is the dynamic floor of the channel. If this support breaks, the primary supports at $0.02223 and $0.01728 are very important levels, and reaching any of these supports could introduce bullish momentum into the market and prevent further declines. If these supports break, the next support will be at the 0.618 Fibonacci level.
✨ Moving on to finding targets based on Fibonacci, as you've seen, the price has corrected to the 0.5 Fibonacci retracement and has good momentum for continuing the upward move. According to Fibonacci rules, when a price corrects to 0.5, the likelihood of moving to the previous high with a break increases.
🧩 The previous price peak is at $0.19418, which coincides with the 0.5 Fibonacci extension. From a market cap perspective, this coin's price could move up to $0.34361. Therefore, we can consider logical targets between $0.19418 and $0.34361. Although the target box size is large and nearly 100% different, this is a weekly trend, and this target is approximate; we must wait for the price reaction to this range to find a more precise target.
🚀 I believe this range is a logical target for this coin, but if the market cap of the project increases and it becomes one of the more significant cryptocurrencies, the price could potentially move to the 1 or even 1.272 Fibonacci points.
📝 Final Thoughts
This analysis reflects our opinions and is not financial advice.
Share your thoughts in the comments, and don’t forget to share this analysis with your friends! ❤️

Doubts are confirmed. Watching for 100.5KMorning folks,
Last time we decided to take a pause, because too weak performance on supposedly bearish market has confused us. Now our doubts are confirmed, indeed the action that we see now is not typical and natural for bearish market. It is too wobble and slow. This is not the way how bearish market normally moves.
It doesn't mean that potentially bearish scenario and deeper retracement are cancelled totally. It means that they could start with different patterns. Thus, on daily we're watching for something like this, although do not exclude that it might be Double Top later as well:
Since the shoulder stands around ~100.5K, we do not consider any shorts until it will be reached. 1H chart shows upside AB-CD with the same extension target. We consider no longs.

Pnut/UsdtBINANCE:PNUTUSDT
"$Pnut is currently priced at 0.7032, but the resistance levels are pretty close—around 0.7545, 0.8433, and 0.9345. 🚧 What that means is that the price is likely to face some strong pushback when it tries to go higher, so don’t expect a massive surge in the short term. ⚠️
If you’re holding $Pnut right now, I’d be careful. 💭 I wouldn't recommend holding it at these levels for too long because it could potentially retrace. Instead, you might want to keep an eye on the support levels, which are at 0.600 and 0.0600. 🛑 If the price drops towards those areas, it could be a good spot to watch for a possible bounce or buy opportunity. 📊
Just a reminder—this isn't financial advice, just sharing my observations. 💡"

PHB ANALYSIS🔮 #PHB Analysis
💲💲 #PHB is trading in a Symmetrical Triangle Pattern. If the price of #PHB breaks and sustain the higher price then will see a pump. Also there is an instant strong support zone. We may see a retest towards the support zone first and then a reversal📈
⁉️ What to do?
- We have marked crucial levels in the chart . We can trade according to the chart and make some profits. 🚀
#PHB #Cryptocurrency #Support #Resistance #DYOR

Bitcoin Analysis (1 hour time frame)According to my personal analysis I observes a clever bearish trend here.
Read for more details
Note: This post is for educational purpose only. I am not a certified trader or a financial advisor
1. Key Observations on the Chart
Resistance Zone:
The price is near $95,300, which is a resistance level (red zone). The chart shows that the price is struggling to go above this level. This often indicates that sellers are stronger than buyers at this point.
Support Zones:
Below the current price, there are green zones that represent support levels. These are areas where the price may stop falling if it moves downward because buyers may step in.
Indicators:
The Exponential Moving Averages (EMA) (blue and yellow lines) are currently below the price, showing that the market is still bullish for now.
The CCI (Commodity Channel Index) at the bottom of the chart is coming down from a high level, which could mean that the buying pressure is reducing.
---
2. What Does This Mean?
If the price fails to break above $95,300 (the red zone), it is likely to go down toward the green zones (support levels).
The red arrows drawn on the chart suggest the expectation of a bearish movement (price falling) toward the lower green zones if resistance holds.
---
3. Possible Scenarios
Scenario 1: Bearish Trend (Price Falls)
The price fails to break the resistance ($95,300).
It starts to move downward toward the first support zone around $94,400–$94,300.
If this level is broken, the price could fall further to the second support zone near $93,000.
Scenario 2: Bullish Trend (Price Rises)
If the price breaks above the resistance at $95,300 and stays above it, the market might continue upward toward $96,000 or higher.
---
4. What to Watch For?
Price Behavior Around $95,300:
If the price forms long wicks (indicating rejection) or red candles, it’s likely to fall.
If the price closes strongly above this level, it might continue upward.
Support Zones:
Watch if the price holds or breaks the support levels below ($94,400 and $93,000).
---
Conclusion
The chart currently suggests a bearish possibility because:
1. The price is facing resistance.
2. Momentum (CCI) is reducing.
3. The drawn arrows show an expected downward move.
However, you should wait for confirmation from the next price movements before making any decisions.

Phemex Analysis #48: How to Trade Ethereum like a Pro Trader. Ethereum ( PHEMEX:ETHUSDT.P ) has been on a rollercoaster ride recently, with its price declining from a high of $4,112 to a low of $3,100. After this significant drop, the market seems to be finding its footing, with ETH now trading around the $3,400 mark. Traders are closely watching the charts to determine the next big move. Here’s a breakdown of the possible scenarios and how they might unfold:
The Calm Before the Storm: Consolidation Phase
At present, ETH appears to be consolidating within a range, oscillating between $3,550 and $3,215. This phase of sideways movement often reflects indecision in the market as buyers and sellers battle for control. For traders, this is a time to exercise patience. A breakout from this range—either upward or downward—will likely set the tone for ETH’s next major trend.
If ETH continues to consolidate, it’s essential to avoid jumping into trades prematurely. Instead, wait for a decisive breakout beyond $3,550 or below $3,215 before making any trading decisions. Consolidation can be frustrating for momentum traders, but it also provides an opportunity to prepare for the next big move.
Scenario 1: The Bulls Charge Ahead
A bullish breakout above $3,550 could signal that Ethereum is regaining its upward momentum. Such a move would likely need to be accompanied by high trading volume to confirm its strength. If this happens, traders may consider entering long positions.
However, it’s important to keep an eye on key resistance levels. The $4,100 mark looms as a significant barrier where selling pressure could intensify. This level represents the previous high before ETH’s recent decline and could act as a psychological hurdle for buyers. As such, taking partial profits near $4,100 might be a prudent strategy to lock in gains while reducing exposure to potential reversals.
Scenario 2: The Bears Take Control
On the flip side, if ETH breaks below $3,215 with high volume, it could indicate renewed bearish pressure. In this case, the price might test the recent low of $3,100 or even dip further into the $3,000 zone. For long-term investors or those looking for value entries, this could present an opportunity to buy ETH at a discounted price.
However, caution is warranted if ETH drops below the critical $3,000 level. A break below this psychological threshold could signal deeper weakness in the market and might suggest staying out until signs of stabilization or recovery emerge.
Navigating Uncertainty: A Professional Trader’s Mindset
The current state of ETH/USDT highlights the importance of adaptability in trading. Whether the market consolidates further or breaks out in either direction, having a clear plan is crucial. Here are some key takeaways for navigating these scenarios:
(I) During consolidation: Stay patient and avoid overtrading. Wait for clear signals before committing capital.
(II) In case of a bullish breakout: Watch for volume confirmation and manage risk by setting stop-loss orders and taking profits near resistance levels.
(III) If bearish momentum takes over: Look for buying opportunities near support levels but remain cautious if prices fall below critical thresholds like $3,000.
By preparing for multiple scenarios and staying disciplined in execution, traders can position themselves to capitalize on Ethereum’s next big move while managing risk effectively. As always in trading: plan your trade and trade your plan!
Tips:
Elevate Your Trading Game with Phemex. Experience unparalleled flexibility with features like multiple watchlists, basket orders, and real-time adjustments to strategy orders. Our USDT-based scaled orders give you precise control over your risk, while iceberg orders provide stealthy execution.
Disclaimer: This is NOT financial or investment advice. Please conduct your own research (DYOR). Phemex is not responsible, directly or indirectly, for any damage or loss incurred or claimed to be caused by or in association with the use of or reliance on any content, goods, or services mentioned in this article.

Bitcoin Year 2025Market analysts and crypto experts anticipate that Bitcoin could soar to $600K this year, fueled by supportive policies and growing institutional adoption. Key drivers include deregulation efforts and pro-crypto measures under the current administration. President Trump has also reshaped the political landscape by appointing lawmakers who strongly advocate for cryptocurrency, setting the stage for a potential rally.
