Hi chances on reversalMorning folks,
So, by introducing $Trump Token, old Donny has put the start of global US Dollar devaluation. And Melania probably will add today...
All our short-term targets are done - weekly grabbers and H&S failure has worked fine, BTC has challenged the top of 108K. We consider this action as hype and emotional. Mostly due euphoria around D. Trump inauguration.
Due to oversold on Monthly and Daily time frames, chances on reversal are significant. So we intend to watch for DRPO "Sell" pattern on weekly chart.
Still, Donny could tell us a lot today, and madness could continue a little bit. We do not exclude that BTC could try to reach nearest upside extension around 113.5K before reversal starts.
We do not call right now for taking short positions, let's see what will be on Thu, prefer to wait for patterns and signs for reversal first. But we call to consider long positions close or, at least tight stops around them.
Take care.
Cryptocurrency

BTC UPDATENow the BTCUSDT price has gone in bearish CHoCH in H1 and H4 timeframe..
so i will be looking for shorts as seen in the chart as 1 and 2 scenarios..
but what if it just is a liquidity sweep for the next move.
then I will wait for the double ChoCH to happen and will look to go long from the last supply level as seen from scenario 3.

BTC at major Resistance Zone? Will it drop to 102,100 $?COINBASE:BTCUSD is trading in a robust resistance zone that aligns with prior price rejections and key supply levels. This area has in the past attracted strong selling interest, making it a critical point to watch.
If bearish confirmation appears, such as strong upper wicks or bearish candlestick patterns, I anticipate a move toward 102,100. Conversely, a break above this level could signal further upside and invalidate the bearish setup.
Traders should carefully evaluate price action at this zone before entering positions. Do you see this playing out similarly?
Let’s discuss in the comments below!

ETH to $15000 LONGChart Analysis: Ethereum is currently forming an ascending triangle pattern, which is typically a bullish continuation pattern. The price action has been creating higher lows while encountering resistance at a level around $4000.
As the pattern evolves, a breakout above the resistance level could signal a continuation of the upward trend.
Trade Setup:
Pattern: Ascending Triangle
Resistance Level: $4000 (key horizontal resistance)
Target: The pattern suggests a potential move of approximately 445% upward, with a projected target of $21,908 (a significant potential move).
Stop Loss: Place the stop loss below the recent support trendline, around $2,200 to manage risk.
Take Profit: Set the initial take profit target at $15000 with further targets at $26000 and depending on how the price progresses after the breakout.

BINANCE VALID BULLISH SYMMETRICAL TRIANGLEBINANCE:BNBUSDT Good Afternoon trader, my UPDATE idea for BNBUSDT. 4H on 19/01/2025.
We got a valid triangle pattern in binance price action because the price did not break through at $729,97 price area . If we observed carefully, 5 waves (W1-W5) will formed in this information, which is related to the Elliot Wave theory.
So my prediction the price will continue get the support triangle at $675,30 area price before continue bullish to break the pattern.
Please discuss about this thing, comment on below

Is AIDOGEUSDT Ready to Bark Back? Key SignalsAIDOGEUSDT is sitting at a critical juncture with the current price at $0.002035, reflecting a steep decline of 78.08% from its all-time high of $0.009286, set just under a year ago. After bouncing 25.07% off its absolute low, the asset finds itself on a knife’s edge—oversold according to the RSI14 at 19.2. This could indicate a brewing shift in momentum.
Recent patterns in sell volumes and VSA buy signals are fighting for dominance, with key resistance levels like $0.002174 looming ahead. Coupled with macroeconomic uncertainty and rising speculative interest, the question remains: is this a trap or the start of a reversal?
For traders and investors, the urgency is palpable. With long-term averages slumping below key supports, and a convergence of powerful resistance near $0.0024, today’s setup demands attention. Will AIDOGEUSDT claw its way back, or is the worst yet to come?
Stay tuned—this could be your defining moment in this unpredictable crypto saga.
Roadmap: Tracing the Momentum of AIDOGEUSDT through Recent Patterns
Dive deep into the pulse of AIDOGEUSDT as we dissect the most recent series of patterns using a roadmap that tracks not just their presence but their actual impact on price action. Here's how the action played out:
1. VSA Buy Pattern Extra 1st (2025-01-19 09:00 UTC)
Direction: Buy
Analysis: The "VSA Buy Pattern Extra 1st" signaled potential upward momentum after the close at $0.002174. Despite this signal, the next pattern saw a "Sell Volumes" direction take control, showing no upward breakout from the previous trigger. This invalidated the buy setup, making it a "watch-and-wait" moment for traders.
2. Increased Sell Volumes (2025-01-19 11:00 UTC)
Direction: Sell
Analysis: Here comes the game-changer. With a close at $0.002035, the sell direction hit hard, accurately reflecting the downward momentum predicted by the pattern. The next movement confirmed the strength of the selling wave, solidifying this as a reliable bearish signal.
3. VSA Buy Pattern Extra 1st (2025-01-19 08:00 UTC)
Direction: Buy
Analysis: The earlier "Buy Pattern" appeared again, but the rally was short-lived as subsequent sell volumes dampened enthusiasm. This reiteration failed to confirm a buy breakthrough, showcasing the dominance of bearish pressure.
4. VSA Sell Pattern 3rd (2025-01-18 15:00 UTC)
Direction: Sell
Analysis: True to its nature, this sell pattern accurately set up a bearish swing, with the next candles reflecting a consistent downward drift. A textbook example of pattern precision that delivered what it promised.
5. Increased Buy Volumes (2025-01-18 00:00 UTC)
Direction: Buy
Analysis: Bulls finally showed some teeth here, pushing the price from $0.002649 to $0.002776. This pattern proved spot-on, as it marked the beginning of a brief recovery before sellers regained control.
6. VSA Manipulation Sell Pattern 3rd (2025-01-17 17:00 UTC)
Direction: Sell
Analysis: Bears ruled the show again, with the price tracking downward in line with the signal. The movement reinforced the bearish bias and gave traders a clear shorting opportunity.
7. Buy Volumes Max (2025-01-17 02:00 UTC)
Direction: Buy
Analysis: This buy signal didn’t disappoint, as the price pushed upward momentarily. While it didn’t lead to a long-term trend change, it offered short-term traders a golden scalp opportunity.
8. VSA Buy Pattern 3 (2025-01-14 21:00 UTC)
Direction: Buy
Analysis: The buy pattern highlighted an early rally, but its short lifespan reflected the broader market weakness. The directional signal worked in the moment, although macro bears soon overwhelmed the momentum.
Conclusion
Patterns don't just tell a story—they set the stage for actionable insights. For AIDOGEUSDT, the roadmap reveals a fascinating interplay of bullish and bearish pressures, with sell patterns delivering some of the most reliable setups. Keep this roadmap in mind as we watch the next moves, and remember: in the crypto game, patterns are your allies, but confirmation is king.
Technical & Price Action Analysis: Key Support and Resistance Levels
Here's the breakdown of the most critical levels for AIDOGEUSDT that every trader should have on their radar. These zones will act as battlefields between bulls and bears. If they fail to hold, expect these same levels to flip and become stubborn resistance on the way back up.
Support Levels:
These are the lifelines for the bulls. Watch for bounces here:
0.002174 – The immediate support zone that needs to hold to maintain any bullish vibe.
0.002392 – A deeper dip could see buyers stepping in here to defend.
0.002806 – A solid mid-range level that can act as a springboard for recovery.
Resistance Levels:
These levels are where the bulls will face heavy resistance if the price moves upward:
0.003052 – A critical line in the sand. A break and hold above this could ignite bullish momentum.
0.003158 – The upper limit where sellers might hit back hard.
Powerful Support Levels:
Stronger zones that bulls must guard fiercely:
0.004612 – A major inflection point. If price reaches this, it’s a do-or-die level.
0.005384 – Bulls would need to regroup here if the sell-off gets intense.
0.00743 – A key long-term zone that may decide the trend direction.
Powerful Resistance Levels:
Big money might step in here to cap upward moves:
0.001873 – Immediate resistance that’s been a thorn for bulls.
The Takeaway
Respect these levels like they’re your trading roadmap. If a support fails, it’s not the end of the story—it’s the beginning of a new resistance. Keep your eyes sharp, manage your stops tight, and let the price action guide your decisions.
Trading Strategies with Rays: A Systematic Approach to Market Movements
Concept of Rays
The "Rays from the Beginning of Movement" methodology leverages Fibonacci-based dynamic levels that align with natural proportions. Unlike traditional analysis focused on static extremum points, these rays adapt to new patterns and highlight interaction zones where price either reverses or continues its trend. By incorporating moving averages (MAs) as dynamic factors, this system offers a robust approach to identifying trade setups.
How It Works
Fibonacci Rays: Define key movement boundaries based on the initial movement pattern.
Dynamic Interaction: Price reactions at ray intersections with MAs confirm trade opportunities.
Action Zones: Use VSA rays and MAs for confirmation before entering positions.
Scenarios: Price moves from one ray to the next, creating clear targets for trades.
Two Scenarios: Optimistic and Pessimistic
Optimistic Scenario: Price interacts with ascending rays and finds support at dynamic MA levels, signaling a bullish continuation.
Entry Zone: $0.002174 (immediate support and ray interaction).
Target 1: $0.002392 (first ascending ray).
Target 2: $0.002806 (next ray with strong resistance potential).
Moving Averages: A price break above MA50 and MA100 strengthens bullish confidence.
Pessimistic Scenario: Price fails to hold critical support and interacts with descending rays, leading to bearish continuation.
Entry Zone: $0.002035 (near powerful resistance, now acting as support).
Target 1: $0.001873 (next descending ray).
Target 2: $0.001627 (powerful historical support ray).
Moving Averages: A breakdown below MA233 confirms further downside pressure.
Suggested Trade Setups
Buy Setup (Bullish Scenario): Enter long at $0.002174 if the price interacts positively with ascending rays and MA50. Exit partially at $0.002392 and hold for $0.002806.
Sell Setup (Bearish Scenario): Short at $0.002035 if the price breaks below descending rays and MA233. Partial profits at $0.001873, and hold for a possible test of $0.001627.
Scalp Strategy: Use ray-to-ray movements for quick trades, focusing on dynamic resistance and support zones, such as $0.002174 to $0.002392.
Swing Trade: Aim for extended movements, aligning with ray trajectories and MA trends, such as $0.002035 to $0.001627 in a bearish scenario.
Key Notes
Every trade begins with interaction at the rays and requires confirmation from volume analysis (VSA) or price patterns. Whether bullish or bearish, the journey from one ray to the next provides traders with clear, actionable targets while minimizing guesswork.
Trading is all about precision, understanding, and growth—and I’m here to help you navigate the market with confidence. If you’ve got questions about this analysis or want to share your thoughts, drop them in the comments below. Let’s discuss, learn, and grow as a community.
If you found this roadmap useful, don’t forget to hit that Boost button and save the idea to revisit later. Track how the price reacts to the levels and rays I’ve outlined—because mastering those key points is the foundation of successful trading.
My custom indicator draws all the rays and levels automatically, making analysis faster and more accurate. It’s currently available privately, so if you’re interested in trying it out, feel free to send me a private message for details.
Need analysis on another asset? Let me know in the comments! I can create setups for any instrument, and while some will be free for public access, I’m open to creating personalized setups for private use as well. My rays work on any asset, so whether it’s crypto, forex, stocks, or commodities, I’ve got you covered.
If you enjoy this kind of content, make sure to follow me here on TradingView. It’s where I share all my ideas and strategies to help traders like you make informed decisions.
Let’s build something amazing together—one trade at a time. 🚀

VELO Ready for Its Next Big Move?As the crypto market continues to fluctuate, VELOUSDT is at a crossroads. Currently trading at $0.02188, the asset has retraced -43.85% from its recent peak of $0.038965 set just three days ago. This places it in a prime zone of interest for both bulls and bears. With a low RSI14 at 21.15, VELO is heavily oversold on the 1-hour chart, suggesting a potential rebound is on the horizon. Meanwhile, the 60-period MFI at 26.60 hints at waning selling pressure.
The emergence of consecutive VSA Buy Patterns in the past few sessions supports the hypothesis of a possible reversal. However, a break above the resistance at $0.026136 would provide stronger confirmation for a bullish move.
Could this be your chance to catch a trend early, or will VELO test deeper waters before turning? Keep an eye on these levels, and stay tuned for the next steps in its journey. Are you ready to trade with precision?
Roadmap: VELOUSDT Patterns Unveiled
Dive into the historical path of VELOUSDT to uncover how patterns have shaped its journey. This roadmap highlights confirmed moves, discarding noise to reveal actionable insights for traders.
1. VSA Manipulation Buy Pattern 2nd - January 19, 09:00 UTC
Main Direction: Buy
Opening Price: $0.023559 | Closing Price: $0.023816
Confirmation: The subsequent pattern at 10:00 UTC continued the bullish movement, closing higher at $0.022719 despite minor fluctuations. The direction aligned perfectly, validating the bullish forecast. This move showcased a strong rebound from a previous sell-off, marking a turning point for VELO.
2. VSA Buy Pattern Extra 1st - January 19, 10:00 UTC
Main Direction: Buy
Opening Price: $0.023816 | Closing Price: $0.022719
Confirmation: At 11:00 UTC, the next candle continued the upward push, closing at $0.02188. While the price dipped initially, it tested lower support levels before rebounding in alignment with the bullish signal. This pattern highlighted a retest scenario before breaking out to higher levels.
3. Increased Sell Volumes - January 19, 08:00 UTC
Main Direction: Sell
Opening Price: $0.025608 | Closing Price: $0.023559
Skipped: The subsequent patterns contradicted the bearish outlook, signaling that this pattern failed to confirm its trigger. This inconsistency marks it as a noise event in the roadmap.
4. VSA Manipulation Sell Pattern 2nd - January 18, 08:00 UTC
Main Direction: Sell
Opening Price: $0.02829 | Closing Price: $0.02705
Confirmation: The following VSA Buy Pattern Extra 1st at 07:00 UTC indicated a minor reversal, but the broader trend remained downward. The sell signal was validated as prices continued to respect resistance levels and declined further.
5. Increased Buy Volumes - January 18, 11:00 UTC
Main Direction: Buy
Opening Price: $0.026342 | Closing Price: $0.026624
Confirmation: Subsequent price action upheld the bullish move, rising toward $0.027213. This pattern was instrumental in identifying a shift in sentiment, with buyers reclaiming control after a prolonged sell-off.
Key Takeaways for Investors
Patterns like the VSA Buy Pattern 2nd consistently highlighted key turning points, offering valuable entry points.
Noise events such as "Increased Sell Volumes" underline the importance of trigger confirmation in trading decisions.
The roadmap demonstrates how aligning with confirmed patterns can improve forecasting accuracy and trading confidence.
VELOUSDT's historical patterns showcase the critical role of precise analysis in navigating market volatility. Ready to capture the next move? Follow the roadmap and take control of your trading game!
Technical & Price Action Analysis
Support Levels:
0.026136 – This level has been tested multiple times and shows solid buyer interest. If it breaks, expect it to flip into resistance, paving the way for lower action.
0.029519 – Another critical support zone. If buyers fail to hold this, sellers will likely push through, making it a tough ceiling on the next retest.
Powerful Support Levels:
0.037063 – This is the fortress for bulls. A breakdown here signals a significant shift in sentiment, with the level becoming a prime resistance to watch.
Resistance Levels:
0.034017 – This area has capped recent upside moves. If bulls can break and close above, it could signal a trend reversal. Otherwise, it’ll remain a tough nut to crack.
0.036148 – Another ceiling for the price. Watch how price reacts here; failure to break will likely lead to another round of selling pressure.
Powerful Resistance Levels:
0.013717 – Key battleground for sellers. A clear rejection here strengthens the bearish case. A break could open the floodgates for further bullish momentum.
0.011988 – Strong historical resistance; a failure to close above this confirms seller dominance, turning it into a high-confidence short zone.
0.010637 – This level acts as a line in the sand. A breakthrough could ignite new buying interest, but until then, it’s a key roadblock.
0.00956 – Bottom-line resistance. If bulls can’t clear this, the bears will likely dominate the near-term price action.
Failure to respect these levels can quickly flip them into critical zones for the opposite side of the trade. Stay nimble and keep your risk tight—the market’s watching, and so should you.
Concept of Rays: Trading Strategies Based on Dynamic Levels
Core Idea
My proprietary analysis method revolves around "Rays from the Beginning of Movement," constructed using Fibonacci mathematical and geometric principles. These rays form a system of dynamic levels to predict asset movements, emphasizing interactions rather than static levels. By analyzing price interaction with these rays, traders can infer scenarios of reversal or continuation—but only after confirming dynamic factors and patterns.
Why Specific Levels Are Not Predictable
Financial markets are complex, nonlinear systems influenced by numerous variables such as liquidity, market sentiment, and macroeconomic forces. Instead of pinpointing exact levels, we focus on probabilities at pre-determined zones. Rays provide key insights into the direction and intensity of price movements when these zones are engaged.
How Rays Work
Fibonacci Rays: Each ray aligns with significant angles derived from natural proportions and is anchored at the origin of movement.
Primary Advantage: Unlike traditional methods, rays are constructed from the movement’s starting point, enabling precise adjustments for new trends or corrections.
Adaptability: Rays dynamically adjust with emerging patterns, offering fresh insights into movement boundaries.
Ascending and Descending Rays: These define the movement channel’s limits and highlight interaction zones for potential entries.
Optimistic Scenario
If the price reacts positively to support levels, we expect movement along ascending rays to achieve successive targets:
First Target: $0.026136 (Resistance Level 1)—Price interaction suggests continued bullish momentum after breaking through.
Second Target: $0.029519—A key resistance zone where price momentum will likely face its next challenge.
Third Target: $0.034017—Major resistance that aligns with the upper boundary of dynamic rays and Moving Averages.
Pessimistic Scenario
If the price fails at resistance and interacts negatively with descending rays:
First Target: $0.02188 (Current Price Level)—A probable retest of support.
Second Target: $0.011988—Dynamic interaction with powerful support, marking a critical zone to evaluate bearish persistence.
Third Target: $0.00956—Final support level where sellers may dominate before potential consolidation.
Dynamic Factors
Moving Averages—Levels at MA50 ($0.02873) and MA100 ($0.03257) act as additional dynamic resistance points. Interaction here confirms strength or weakness.
VSA Rays—Key zones on the chart interact with Volume Spread Analysis rays to offer enhanced clarity. Price moves between rays, using each as a potential stepping stone.
Proposed Trades
Trade 1: Long Position from $0.026136 to $0.029519—Enter on interaction with ascending ray and confirmation of bullish momentum.
Trade 2: Short Position from $0.034017 to $0.02188—Triggered by rejection from upper resistance and descending ray.
Trade 3: Long Position from $0.011988 to $0.026136—A high-probability reversal from powerful support.
Trade 4: Short Position from $0.029519 to $0.011988—Dynamic resistance at MA100 confirms bearish continuation.
Price movement along these rays allows traders to predict targets confidently. The beauty of this method lies in its flexibility and reliance on real-time interaction, ensuring adaptability in any market scenario.
Got questions? Let’s discuss! Drop your thoughts and queries in the comments below—I’ll be happy to clarify or dive deeper into the analysis. Don’t forget to hit Boost and save this idea to revisit it later and see how the price follows the roadmap. Tracking key levels and reactions is the cornerstone of trading success.
By the way, my proprietary indicator automatically plots all the rays and levels you see here. It’s available privately, so if you’re interested, feel free to message me directly to learn more.
Need analysis for a specific asset? I’ve got you covered! I’m open to creating detailed markups—some I can share publicly, and others can be tailored exclusively for you. Whether it’s a broad market idea or a private strategy, let’s connect and find a solution that works for you.
Remember, these rays work across all assets, guiding price movements with uncanny precision. If you have assets you’d like analyzed, give this post a Boost and mention them in the comments—I’ll do my best to include them in future updates.
Finally, don’t miss out on more insights and strategies! Hit follow here on TradingView to stay updated with all my latest ideas and detailed analyses. Let’s navigate the markets together!

BAL ANALYSIS📊 #BAL Analysis
✅There is a formation of Descending Channel Pattern in weekly chart. Currently #BAL is in bearish way.
After a breakout of the pattern and major resistance level we would see a bullish momentum otherwise the price will drop more 🧐
👀Current Price: $2.750
⚡️What to do ?
👀Keep an eye on #BAL price action and volume. We can trade according to the chart and make some profits⚡️⚡️
#BAL #Cryptocurrency #Breakout #TechnicalAnalysis #DYOR

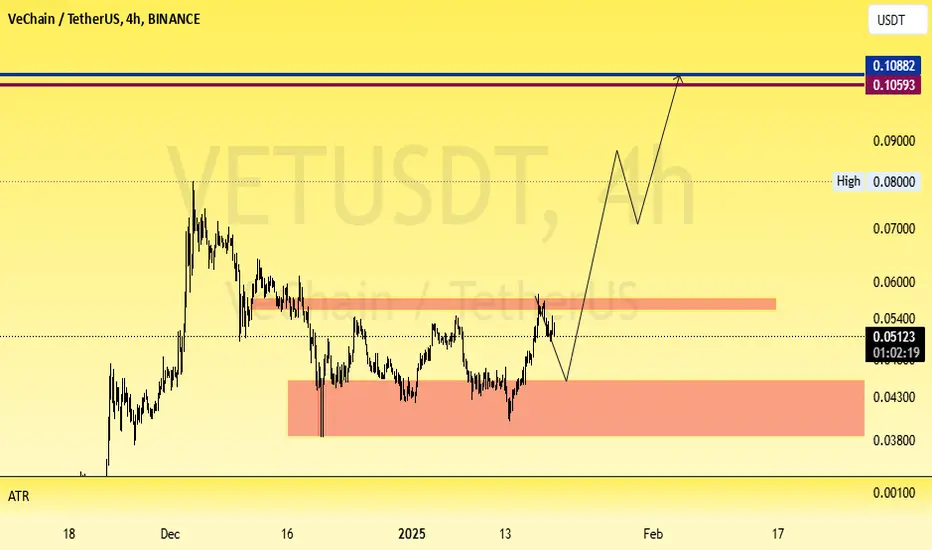
VETUSDT Wave AnalysisHello Friendes. According the chart of VETUSDT I expected to this movement and 0.105$ . This Way possible by cottrction but see that price.
LADYS Meme Coin Sees Whale Activity: Bullish Breakout Ahead?The daily price chart for LADYS/USDT reveals significant developments in its technical analysis, suggesting the potential end of a prolonged downtrend and the onset of upward momentum.
The price had been consolidating within a falling wedge pattern, a structure marked by converging downward-sloping orange lines. Falling wedges are typically considered reversal patterns, and this case aligns with that narrative. The trend took a decisive turn with a breakout characterized by a prominent "whale candle in hourly timeframe," signifying strong upward movement and increased buying interest.
Following the breakout, a retest confirmed the former resistance line as a new support level, reinforcing the validity of the move. This technical confirmation has set the stage for a bullish outlook, with the chart's green box marking a projected price target around 0.000000089121 USDT.
Adding further strength to this analysis is the presence of key support zones. The purple-shaded area below the current price acted as a support in earlier price action and remains a critical level for maintaining the bullish structure. Similarly, the falling wedge's former resistance line now serves as an additional support layer.
At present, LADYS/USDT is trading at 0.00000007719 USDT. If the bullish momentum continues, it could align with the chart's projection, presenting potential opportunities for traders.
Understanding LADYS: The Milady Meme Coin
LADYS represents Milady Meme Coin, trading against Tether (USDT). As a meme coin, its value is heavily influenced by social sentiment, online trends, and speculative trading. While the chart suggests technical bullishness, it is essential to note the high volatility typically associated with meme coins.
Risks and Considerations
The broader cryptocurrency market's sentiment will inevitably impact LADYS/USDT's trajectory. Traders should approach this analysis with caution, considering both the potential reward and the inherent risks of trading meme coins. Effective risk management, such as setting stop-loss orders and staying informed on market conditions, is crucial for navigating this space.
In conclusion the breakout from the falling wedge and the subsequent retest indicate a strong bullish scenario for LADYS/USDT. While the technical setup points toward upward momentum, traders should remain cautious given the speculative nature of meme coins like Milady. Careful planning, thorough research, and a balanced approach are key to capitalizing on the opportunities presented by this chart.
Disclaimer: This is not a financial advise. This analysis is purely for informational purposes and should not be considered as investment advice. Trading involves risk, and you should consult with a financial professional before making any decisions.

Ethereum’s Next Big Move: Don’t Miss This Game-Changing Setup!I am back and live on January 18th with a crucial Ethereum (ETH) breakdown! 🚀 In this video, we dive into potential bullish momentum for Ethereum, identifying key levels for buying opportunities and explaining the recent market reaction to altcoin rotations, including the hype around Trump’s meme coin.
We start on the weekly time frame, reviewing the inverted head-and-shoulders pattern and the strong bounce off the $2,930 support level. On the H4 time frame, we analyze critical market structure breaks and price sweeps, signaling ETH could push towards $3,599 and potentially $3,760.
If we get a candle closure above $3,320, this could be the weekend setup you don’t want to miss! 🚨 Let’s break it down and capitalize on this opportunity.
📊 Targets:
• $3,599
• $3,760
⚠️ Are you ready for the next Ethereum move? Watch the video for detailed insights, setups, and market sentiment analysis.

BTC ANALYSIS👑 #BTC Analysis :
🔮 As we can see that there is a breakout of trendlind in daily timeframe in #BTC. We would see a bullish movement after a small retest.
⚡️What to do ?
👀Keep an eye on #BTC price action. We can trade according to the chart and make some profits. ⚡️⚡️
#BTC #Cryptocurrency #Breakout #DYOR

ONDO ANALYSIS🔴 #ONDO Analysis : ❓❓
🔮There is a formation of "Bullish Pennant Pattern" in #ONDO in 2D time frame. We can expect around $1.58 bullish move if the price break the pattern.📈
⚡️What to do ?
👀Keep an eye on #ONDO price action. We can trade according to the chart and make some profits. ⚡️⚡️
#ONDO #Cryptocurrency #Breakout #DYOR

Falling Wedge Breakout: Is MEW/USDT Ready to Surge?The chart analysis for MEW/USDT on the daily timeframe (1D) reveals a compelling narrative for potential bullish movement, underpinned by a falling wedge pattern breakout and subsequent confirmation of support levels. Each candle on the chart represents a day's worth of price action, capturing a longer-term trend that appears poised for upward momentum.
Technical Analysis of MEW/USDT
Before the formation of the current triangle pattern, MEW was in a clear uptrend, indicating a bullish market bias. This was followed by a consolidation phase, culminating in the development of a falling wedge pattern—a classic bullish indicator. The breakout from this pattern, marked explicitly on the chart as a "Downtrend break and re-testing" point, is a strong signal of a potential price rally. The price has successfully retested the broken resistance line, which now serves as a new support, bolstering the bullish case.
A rectangle box on the chart highlights the anticipated target zone, emphasizing a defined price objective for traders watching this breakout. Below this, a purple-shaded area marks a historical support/resistance zone, a key level that has been tested multiple times, further reinforcing its significance in determining price action.
The combination of these technical signals—breakout, retest, and historical support zones—paints a bullish outlook for MEW/USDT. The broader uptrend that preceded the consolidation phase strengthens the likelihood of this pattern playing out to its projected target.
Understanding MEW Meme Coin
MEW, or "Cat in a Dogs World," is a Solana-based meme coin gaining attention in the cryptocurrency space. Its playful branding and community-driven nature align with the characteristics of other meme coins. However, as with many assets in this category, its value is largely speculative and driven by factors like social media trends, community engagement, and overall market sentiment.
As a meme coin, MEW presents high volatility, with the potential for sharp price swings in either direction. Built on Solana’s blockchain, it benefits from the platform's speed and scalability, making it more robust compared to meme coins on slower networks. However, as an emerging asset, MEW’s long-term value and viability remain uncertain, and investors should approach it with caution.
Conclusion
The technical setup for MEW/USDT suggests a bullish continuation, supported by the falling wedge breakout, retest, and historical support zones. However, as a meme coin, MEW's performance is highly influenced by market sentiment and speculative interest. While the chart presents a compelling case for upside movement, investors must weigh the high volatility and speculative nature of meme coins against their risk tolerance. As with all investments, combining technical analysis with fundamental research is crucial when evaluating opportunities in the cryptocurrency market.
Disclaimer: This is not a financial advise. This analysis is purely for informational purposes and should not be considered as investment advice. Trading involves risk, and you should consult with a financial professional before making any decisions.

Solana's "Impulse" ATH Bound To ContinueWave 1) Low @ $110 to All Time High @ $264.63 -
Wave 2) Golden Ratio Retracement from ATH to $169.22 -
Wave 3) Price Exhaustion around $323.54 After Valid Break -
Wave 4) Retracement to Previous Break of Structure -
Wave 5) Final Leg Before Correction -
The announcement of the Official Trump coin being launched has started an interesting turn of events and may be helping usher COINBASE:SOLUSD into an Elliot Impulse Wave! With the Solana-based meme coin reaching $8 Billion in Market Cap, value increase by 300% and $1 billion in trading volume we see COINBASE:SOLUSD at an $118 Billion Market cap, currently 15% value increase on the day and close to $14 Billion in trading volume!
In a couple of days, the Pro-Crypto Trump Administration who plan to make "US the Crypto Capitol of the World" is pegged to take Office in just a couple days with expectations of actions being taken that will start to boost the Crypto Market.
I suspect we will see the Extension of Wave 3 that will break Wave 1 confirming the sequence in which we will be looking for Price to Exhaust around the $323 area to then start Wave 4 by Pulling back to Retest the Break of Previous Structure being the High of Wave 1. IF support is then found, we could see the Final Leg of Wave 5 with a Range Target @ ( $418 - $477 )

SOLUSDT: Ellio Wave analysis Hello Everyone. This idea from elliot wave analysis . According to the chart we see a correction abc and above to 240$ to X wave so I expected another wave abc to complete the Y wave .

ETHUSDT LONG TRADEAfter sweeping H4 lows price has given CHoCH in H1 to the upside.
So there are 2 levels which i have identified in H1 to go long from.
We can enter at those levels according to individual's entry model.

BITCOIN (BTCUSD): Test of All Time High Soon?!
Looks like Bitcoin is going to retest the resistance cluster
based on a current all time high soon.
The price is currently retesting a recently broken horizontal resistance.
A bullish wave may initiate from that.
❤️Please, support my work with like, thank you!❤️

2021 Resistance Broken: 1INCH Eyes Major Bullish PotentialThe 1INCH/USDT monthly chart provides a compelling glimpse into the long-term price action and potential future trajectory of the cryptocurrency. The chart captures key market dynamics, highlighting a prolonged downtrend and a recent breakout that could signal the beginning of a new bullish cycle.
The overall context suggests that 1INCH has experienced a significant long-term downtrend, marked by a descending white trendline originating from its peak price of 7.3345. This trendline underscores consistent selling pressure and a bearish market sentiment that persisted for an extended period. However, the broader picture also reflects the cyclical nature of markets, with an initial strong rally in early 2021, followed by a protracted consolidation phase, and now the possible emergence of a fresh upward trend.
A pivotal development is the recent breakout above the downward-sloping trendline. Such a breakout often indicates a shift in market momentum from bearish to bullish, signaling that the downward pressure may be easing. This breakout is further underscored by annotations on the chart suggesting that the price is “ready for re-test.” This refers to the likelihood of the price pulling back towards the broken trendline to confirm it as a new level of support before continuing its upward trajectory. Retests are a natural and critical component of breakout scenarios, offering traders an opportunity to validate the strength of the breakout.
The chart also highlights a projected target price of 7.9266, indicated by a green rectangle. This ambitious target represents a substantial increase from the current price of 0.4005, suggesting the potential for a significant rally if the bullish momentum holds. Additionally, key support levels are identified at 0.3286, 0.2600, and 0.2304, providing important reference points for risk management and trade planning.
From a trading perspective, the breakout sets the stage for a bullish outlook, with the re-test offering a potential entry point. Traders might wait for the price to dip towards the broken trendline or one of the identified support levels and observe whether these levels hold as support. Confirmation of support can come in various forms, such as the formation of a higher low or a strong green candle signaling buyer strength.
However, trading based on this analysis should include proper risk management. Setting a stop-loss near critical support levels can help mitigate potential losses if the breakout fails or market conditions reverse unexpectedly. Furthermore, traders should remain aware of the high volatility inherent in cryptocurrency markets and adjust their strategies accordingly.
It’s also essential to acknowledge that this analysis is based on a monthly timeframe, which means the trends and price movements are likely to unfold over an extended period, spanning weeks or months. While the technical setup appears promising, it’s important to incorporate fundamental factors such as news, project developments, and broader market sentiment to gain a more comprehensive view.
In conclusion, the 1INCH/USDT monthly chart reveals a promising bullish scenario with the potential for significant upside, provided the breakout holds and the market aligns with the technical projections. Observing the re-test and confirming the newly established support levels will be key steps in navigating this potential rally.
Disclaimer: This is not a financial advise. This analysis is purely for informational purposes and should not be considered as investment advice. Trading involves risk, and you should consult with a financial professional before making any decisions.

Cardano Breakout Alert: Is the Bull Run Back?After Trump's victory in the U.S. presidential election on November 6, Ada experienced a 318% growth in 30 days. After that, sellers were only able to retrace 50% of the previous impulsive wave within 40 days. Currently, the price is struggling to break above the descending trendline. If it successfully does so, it may reach 1.4780, representing a 31.41% increase.
What are your thoughts on ADA's next move? 👀
Drop your predictions in the comments below and don’t forget to like if you found this analysis helpful! ❤️🔥

SPXUSDT is perhaps one of the best short term crypto investmentsSPXUSDT is having an enormous day so far that is about to test its All Time High.
The rebound is taking place after the 1day MA50 was tested and held, right at the bottom of the Channel Up.
Ahead of a 1day MACD Bullish Cross, this is a strong technical buy entry for the short term.
You can target the top of the Channel Up at 9.000, which would be a +9.38% rise, symmetrical with the coin's first.
Follow us, like the idea and leave a comment below!!

Key Insights from the BTC Market Analysis1. Market Overview
BTC Price: $102,624.90, up +3.83%.
Market Cap: $2.03T, with 24h Volume at $103.12B (+13.99%), signaling robust trading activity.
Dominance: 56.34% (+0.43%), showing BTC’s growing share of the market.
2. Indicators of Sentiment
Crypto Fear & Greed Index: 75, indicating strong "Greed" and bullish market sentiment.
Exchange Balances: BTC exchange balance slightly decreased (-0.06%), suggesting hodling and reduced selling pressure.
3. Derivatives Insights
Open Interest (OI): Up +5.39% to $149.62B, showing new positions are opening, potentially setting up larger moves.
Funding Rates: Positive across major exchanges, indicating more bullish positions.
Long/Short Ratio: Mixed sentiment with Binance net long (1.66) and OKX net short (0.67), which may lead to pockets of volatility.
4. Technical Indicators
Support: $101k–$101.5k, deeper support near $100k if a pullback occurs.
Resistance: $103k–$103.3k. Breaking above this could push BTC toward $105k.
RSI: Cooling slightly (~58–60), signaling consolidation or potential pullback after recent gains.
5. Short-Term Scenarios
Bullish: A reclaim of $103k could push BTC to $105k.
Neutral: Consolidation between $100k and $103k.
Bearish: Profit-taking near $103k might drop BTC to $100k or lower.
6. Confidence Level
Overall Bias: Moderately bullish.
Positives: Increasing OI, reduced exchange balances, and bullish funding rates.
Cautions: Slightly cooling RSI and large options OI increase (+45.30%) suggest potential for high volatility.
Final Thoughts
BTC remains in a strong position as long as it holds above $101k. A breakout above $103k could lead to further upside, but cautious risk management is essential given mixed sentiment across derivatives and short-term cooling indicators.

VVAIFU/USDT INCREASE DAY TRADEVVAIFU/USDT NEW INCREASE DAY TRADE
The study shows that Morpho has a good chance to break in the coming time for this reason a follow.
We choose the coins not based on what we expect or think but on what the data shows as having the highest chance of increasing. And then it will still be unexpected market. There are no guarantees in markets.
