DOGE ANALYSIS🔮 #DOGE Analysis
🌟🚀 #DOGE is trading in an Ascending Triangle Pattern and here we can see that #DOGE testing the ascending trendline. Also there is an instant major support zone. We can see a pullback from its major support zone.
🔖 Current Price: $0.34820
⏳ Target Price: $0.41960
⁉️ What to do?
- We have marked crucial levels in the chart . We can trade according to the chart and make some profits. 🚀
#DOGE #Cryptocurrency #Breakout #DYOR
Cryptocurrency

TradeCityPro | SAND: Analyzing the Key Support & Resistances👋 Welcome to TradeCity Pro!
In this analysis, I will review the SAND coin. The Sandbox project is one of the largest metaverse projects in crypto, and during the previous bull run, it received significant attention from market participants. Recently, with Bitcoin’s latest upward move, SAND experienced a growth of nearly 300%.
📅 Daily Timeframe: Corrections and Key Supports
As mentioned, the daily timeframe shows a strong upward trend, which extended up to $0.9327. After reaching this level with significant volume, the price entered a corrective phase.
🔍 Currently, the price has corrected to the $0.5414 level, a critical support zone overlapping with the 0.5 Fibonacci level. This creates an important support range between the 0.5 and 0.618 Fibonacci levels. It appears the price is forming a base in this area to potentially regain bullish momentum and start the next leg upward. However, the possibility of a trend reversal and further decline also exists.
📊 In recent candles, buying volume in the market increased. However, with the release of yesterday’s news favoring the US dollar, nearly all assets, including US stocks and crypto, experienced declines. SAND also followed this trend with a red daily candle, engulfing the previous bullish candle.
🧩 It’s possible for the market to form a range box between $0.5414 and $0.6983, setting up a new bullish or bearish structure. Given SAND’s recent 300% growth, the likelihood of forming a bullish structure is higher. However, this is only a possibility, and we need to wait for the market to establish a new structure.
✨ The RSI oscillator is also within a box between 41.60 and 61.04. Breaking either of these levels could introduce momentum into the market. Overall, the current market volume still favors buyers.
📈 Long Positions:
The first trigger for a long position is $0.6983, which is considered a risky trigger. However, the rejection candle from yesterday adds importance to this level.
The main trigger is $0.93277, which is the major price ceiling. If this level is broken, the next resistance will be at $1.4155.
📉 Short Positions:
The first support zone is the range between 0.5 and 0.618 Fibonacci levels, as marked. If this zone breaks, the price could see the next corrective leg down to $0.4042.
If this level is broken, it would suggest the bullish trend has ended, with subsequent targets at $0.3068 and $0.2342.
📝 Final Thoughts
This analysis reflects our opinions and is not financial advice.
Share your thoughts in the comments, and don’t forget to share this analysis with your friends! ❤️

BITCOIN Cycle Top can be as high as $200kBitcoin (BTCUSD) has started 2025 on high volatility amidst geopolitical and economic news input. 2025 is the last year of this Bull Cycle, according to the Cycles Theory which for more than a decade has been very accurate at predicting Cycle Tops and Bottoms.
** LGC, MMB and Pi Cycle *
On today's analysis we present to you this view in more detail by displaying Bitcoin's Logarithmic Growth Channel (LGC) with the addition of the Mayer Multiple Bands (MMB) and the Pi Cycle trend-lines. From the MMB we use its extremes, the 3SD above (red trend-line), which is the Mayer Top and the 3SD below (black trend-line), which is the Mayer Bottom. From the Pi Cycle we use a tighter range, its top trend-line (orange) and bottom trend-line (green), which form a zone that typically serves as more of a 'Fair Value' before the Bear Cycle's extreme selling and Bull Cycle's extreme buying (Parabolic Rally).
** Current Cycle in 2025 **
As mentioned, BTC has entered the last year of its current Bull Cycle. Based on this cyclical pattern, the 3 previous Tops have been either on a November or December. As a result, we expect the new Cycle Top to start forming by November 2025. The last one was formed above the Pi Cycle Top (never hit the Mayer Top) and on the 2nd LGC Zone from the top.
This suggests that even if the price barely tests the bottom for the LGC 2nd Zone from the Top, by November 2025 we should be close to $200000. Technically the projected Peak Zone should be within the 180k - 200k range. That may still be below the Pi Cycle Top, so technically we can argue that it is a fair scenario to expect and not an overly optimistic.
Unrealistic or not, this is what 3 separate traditional long-term models suggest.
But what do you think? Is a $180-200k Top a realistic expectation within 2025? Feel free to let us know in the comments section below!
-------------------------------------------------------------------------------
** Please LIKE 👍, FOLLOW ✅, SHARE 🙌 and COMMENT ✍ if you enjoy this idea! Also share your ideas and charts in the comments section below! This is best way to keep it relevant, support us, keep the content here free and allow the idea to reach as many people as possible. **
-------------------------------------------------------------------------------
💸💸💸💸💸💸
👇 👇 👇 👇 👇 👇

TOTAL3 ChartHey,
This is really a text book chart, together with many others in the crypto atm..
A lot of fear and greed is currently in the market, you see that in the PA.
But that is old news, cuz I shared that a long time ago already.
For me more upside from this zone is very likely, if it fails...
I have to go back to the drawing board and see what is the next area of weekly or monthly demand to time when and where price is likely to move towards.
Have a good one, more charts soon.
Make sure you follow us :)
Kind regards,
Max Nieveld

DOGE LongDoge bullish target is 0.5760 level. Current situation is not ideal for buying but after prices retest 0.41 level we can identify how to enter long position.

BTCUSDT: Elliot Wave End of 5 WaveHello friends. According by Elliot Wave theory I see the end of 5th wave and we are in correction waves as ABC .So with rising the price better than for sell don't try to buy .

Expect ETHEREUM to start outperforming BITCOINOn this analysis we compare Bitcoin's last two Cycles to Ethereum's.
The recent underperformance of ETH against BTC has got many worried but in our view, there is no reason for concern.
This 'lagging' is something ETH did on its previous Cycle as well. While Bitcoin already broke to a new ATH in December 2020, Ethereum was still significantly under it.
Once the break out happened, ETH outperformed BTC by double the rise to the Cycle's Top (+789% against +337%).
As Ethereum is once more lagging but it is holding its 1week MA50, we expect to start outperforming Bitcoin again, which is leading with a break out.
In our view the time to move to the 'undervalued' Ethereum is now.
Follow us, like the idea and leave a comment below!!

XRPUSD: Will the 1D MA50 hold?XRP turned neutral on its 1D technical outlook again (RSI = 52.270, MACD = 0.080, ADX = 20.430) as it failed to extend the uptrend and instead is pulling back today. The 1D MA50 is still holding and as long as it does, the trend will stay bullish on the short term. Technically it reminds us of the April 2017 consolidation, which after keeping the 1D MA50 intact, it posted another rally to the 1.618. The similarities between those time periods are obvious and that keeps us bullish on XRP, aiming for just under the 1.617 Fib (TP = 8.000).
## If you like our free content follow our profile to get more daily ideas. ##
## Comments and likes are greatly appreciated. ##


#Monero $XMRUSD One Year AnalysisCRYPTO:XMRUSD
Keylevels / Range
$120: Lowest trend price. If the price closes below this level, it would signal a bearish trend.
$163: Lowest range price. A close below this level would unlock a new lower zone extending down to $120.
$203: Current price.
$233: Upper limit of the current channel/wedge.
$370: Long-term target.
Analysis:
Monero has been trading within a range of $183 to $206 for the past two weeks. The price has closed above $197 for the first time since May 2022. This move potentially unlocks a new range, reaching at least $233, where the upper limit of the current channel/wedge and a monthly/weekly supply zone are located.
A weekly close above $237 would strongly indicate the unlocking of a new charted zone extending from $237 to $370.
Coin Bio:
Monero (XMR), is a privacy-focused cryptocurrency launched in April 2014. It was originally forked from the Bytecoin blockchain. Unlike many other cryptocurrencies, Monero's primary focus is on ensuring the anonymity and untraceability of transactions.
Key features include:
Ring Signatures: Obfuscate the sender's identity.
Ring Confidential Transactions (RingCT): Hide the transaction amount.
Stealth Addresses: Create unique, one-time addresses for each transaction, obscuring the receiver's identity.
These features make Monero attractive to individuals seeking financial privacy and are a core differentiator in the cryptocurrency space. It's developed by an anonymous community of developers and has gained significant traction for its commitment to private and fungible transactions. While its focus on privacy can be controversial, it remains a prominent cryptocurrency with a dedicated user base. XRMUSD specifically refers to the trading pair of Monero against the US Dollar.
#CRYPTO #MONERO #XMRUSD #XMR #CRYPTOCURRENCY #AHMEDMESBAH

SPX JAN 7 2025| READ DESCRIPTION |Here we need to understand the power of money & risk management.If it goes to 6200 from here then our RR is just 1: 1.08 .
The RR is the heart & soul of a trade. One should be discplined enought to understand this & if you are not getting minimum 1:2 & I have used the word minimum, then there is no point taking that particular trade.
You need to think what if a trade goes against me?
Always be open to both sides understanding the RR
If you are not following RR & rules then this business will eat all your wealth
You mind is actually the most powerful thing in the world.

First 2025 prediction Cloud/usdt $0.65prediction Cloud/usdt $0.65 with time
this coin has a good chance to gain $0,65, after studying the data of this coin.
The best way is to follow this coin's low day frame with the day trend.
This update is not a trading update, but a prediction update.
Know that there is no guarantee that this price will become a reality, our study is based on the data study which can be confirmed.
There is also a day trading follow updates by this update
Let the time show us if this coin is going to get the expected break.
Markets going on their way, and it can take time before this coin can show a result. also, this update depends not on the small time frame changes. it's a large picture for the coming times.

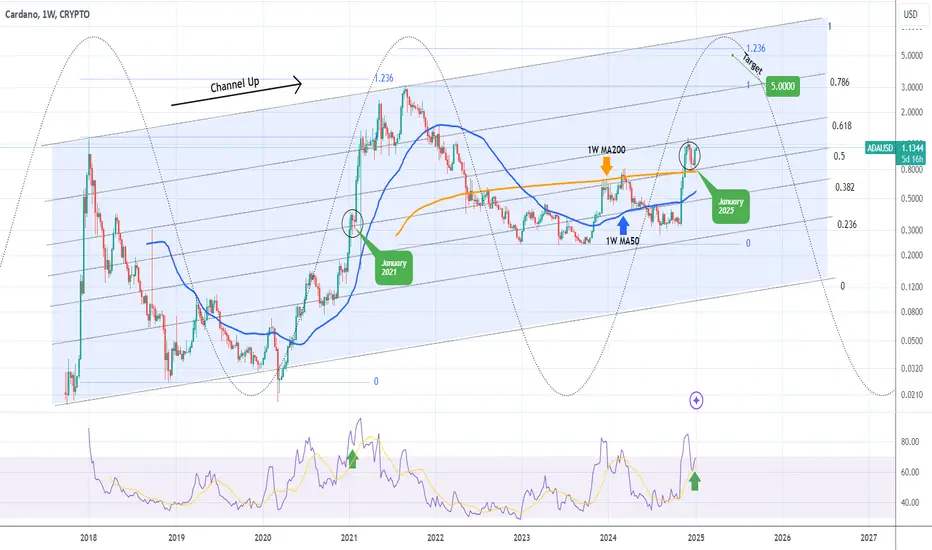
CARDANO Mega rally starting first to $3 then top expected at $5Last time we looked at Cardano (ADAUSD) we gave a confident medium-term buy signal (November 18 2024, see chart below):
Today, having seen a very strong closing to the year last week and especially since the price bounced off the 1W MA200 (orange trend-line), we are making a long-term call towards the top of the Cycle.
Technically ADA's historic pattern is a Channel Up and if we draw its Fibonacci levels, the price is currently within the 0.5 - 0.618 range. That is exactly where it was during the same stage of the previous Cycle in January 2021. As the 0.5 Fib held, once it closed a 1W candle above the 0.618, the price skyrocketed to the 0.786 Channel Fib and tested the previous All Time High (ATH).
We can see the amazing symmetry between the Cycles on the 1W RSI fractals too. As a result, our next immediate Target for ADA is near the previous ATH at $3. Beyond that, we expect the Cycle to top at $5, which is marginally below the 1.236 Fibonacci extension, which was where the August 2021 Cycle Top was priced.
-------------------------------------------------------------------------------
** Please LIKE 👍, FOLLOW ✅, SHARE 🙌 and COMMENT ✍ if you enjoy this idea! Also share your ideas and charts in the comments section below! This is best way to keep it relevant, support us, keep the content here free and allow the idea to reach as many people as possible. **
-------------------------------------------------------------------------------
💸💸💸💸💸💸
👇 👇 👇 👇 👇 👇
Phemex Analysis #50: How to Trade SOLANA Like A ProSolana ( PHEMEX:SOLUSDT.P ) has been relatively subdued during the recent November and December 2024 bull run, rising approximately 100%, a stark contrast to its explosive growth of over 1000% during the October 2023 to March 2024 rally. However, the fundamentals of Solana remain robust, with its Total Value Locked (TVL) increasing from $0.3 billion in October 2023 to an impressive $9.5 billion today—a staggering 3166% rise. This demonstrates that Solana’s ecosystem is stronger than ever.
In this article, we’ll analyze possible scenarios for SOL’s price movement over the next few days and provide actionable trading strategies to help you trade like a pro.
1. Bullish Breakout Scenario
Since January 1, 2025, SOL has rebounded by 17%, currently consolidating around the $210 level as it gathers momentum for its next potential move. If SOL manages to break through the $234 resistance level and subsequently surpass $247, there’s a high probability that it could continue its upward trajectory and form a new all-time high (ATH). This bullish momentum could be fueled by developments such as the launch of Solana ETFs or advancements in AI agent integrations within its ecosystem.
Trading Strategy:
If SOL breaks above $234 with high trading volume, consider opening a Long position. And set your stop-loss at $210 to manage risk effectively.
Remember to monitor key news or announcements that could act as catalysts for further price surges.
2. Bearish Drop Scenario
On the downside, if SOL fails to hold above $210 and breaks below this level with significant volume, it could trigger a drop toward the $180 or $175 support levels. Should overall market sentiment turn bearish—especially if Bitcoin also declines—SOL might test deeper support zones at $155 or even $135.
Trading Strategy:
For advanced traders, consider opening a Short position if SOL drops below $210 with substantial volume. Take profits at key support levels such as $180 or $175.
For long-term holders, these levels ($180, $175, $155, and $135) present potential buy-the-dip opportunities based on your risk tolerance.
Key Considerations for SOL Traders
I. Fundamental Strength: Solana’s growing TVL and ecosystem development are strong indicators of its long-term potential. Keep an eye on updates such as ETF launches or institutional adoption.
II. Technical Indicators: The Relative Strength Index (RSI) is currently above the midpoint, signaling potential bullish momentum. Watch closely for price action around key resistance levels ($234 and $247) and support levels ($210, $180).
III. Market Sentiment: Recent data shows a net inflow of $224 million in SOL to centralized exchanges over the past week—a trend that could signal increased selling pressure or preparation for derivatives trading. Be cautious of sudden shifts in sentiment.
Conclusion
Trading SOL like a pro requires adapting your strategy to evolving market conditions. Whether you’re aiming to capitalize on a bullish breakout or hedge against a bearish drop, understanding key price levels and market dynamics is crucial. Always combine technical analysis with fundamental insights and practice disciplined risk management.
By staying informed and prepared for multiple scenarios, you can navigate Solana’s market movements with confidence and precision.
Tips:
Trade Smarter, Not Harder with Phemex. Benefit from cutting-edge features like multiple watchlists, basket orders, and real-time strategy adjustments. Our unique scaled order system and iceberg order functionality give you a competitive edge.
Disclaimer: This is NOT financial or investment advice. Please conduct your own research (DYOR). Phemex is not responsible, directly or indirectly, for any damage or loss incurred or claimed to be caused by or in association with the use of or reliance on any content, goods, or services mentioned in this article.

MAGIC/USDT NEW INCREASEMAGIC/USDT known with name : Treasure
NEW INCREASE
Showing new volume upcoming which can get confirmed for new uptrend

TradeCityPro | ICPUSDT Missed the Market Move? Don’t FOMO👋 Welcome to TradeCityPro Channel!
Let’s analyze the market during a day when it has finally shown some movement, focusing on coins with clear triggers.
💥 Avoid FOMO
The reason we create daily content for this community is to emphasize the importance of analyzing the market daily and identifying triggers before taking trades. This prevents you from acting impulsively and becoming a profit target for others who entered earlier.
🌐 Overview Bitcoin
Before analyzing today’s altcoin, let’s quickly review Bitcoin on the 1-hour timeframe. As mentioned yesterday, Bitcoin’s movement was predicted. After breaking the 98606 trigger, a long position with a stop loss at 97343 was suggested, considering the potential for whale-driven moves at higher levels.
Additionally, if Bitcoin dominance broke the 57.08 resistance, opening positions on Bitcoin was the preferred approach. Otherwise, a switch to altcoins was recommended.
Here’s my position: R/R 3. The triggers I share are the same ones I use in my trades. Remember, not every day requires action!
If you missed the move, should you open a long position after breaking 102208? Not yet. While the current timeframe suggests caution due to overbought conditions, you can consider this on the 15-minute chart. My recommendation: focus on identifying altcoin triggers to stay ahead of the market.
📊 Weekly Timeframe
ICP has seen a significant move since its support at 2.868, rallying by around 400%. Recently, it has consolidated and established strong support at 6.603, which aligns with the 0.5 Fibonacci level and the 50% Dow Theory level, highlighting its importance.
If you entered at lower levels, consider taking out your initial investment or exiting below 6.603. If you bought after the 9.684 breakout, patience is key. Given the potential for an early breakout above 14.879, maintain a stop loss at 6.603.
For re-entry, a break above 9.684 signifies a lift-off from the midline of its horizontal range, suggesting a stronger likelihood of breaking 14.879. Increased volume confirmation post-breakout can validate a buying opportunity.
Let’s address the fake breakout at 14.879. Unlike the 2.868 level, which saw sustained price action and a move upwards post-daily box formation, the 14.879 breakout was merely a single candle spike followed by an immediate reversal.
📈 Daily Timeframe
ICP remains in its large range box, oscillating between 6.691 and 15.22. A sharp move is expected upon breaking either the upper or lower boundary of this range.
ICP has already begun moving after breaking its smaller box resistance at 9.834. It has retested this breakout, unlike some coins that re-enter their boxes, underscoring ICP's bullish momentum compared to peers.
Currently, ICP faces resistance at 12.409, which was previously ignored but has regained significance. Staying above 11.281 provides an opportunity for small preemptive buys, but the main trigger remains 15.22.
⏱ 4-Hour Timeframe
ICP’s chart looks promising, as it has broken out of its 4-hour box and is consolidating below the next resistance level, presenting a potential entry trigger.
Drawing Fibonacci levels from the start of the drop reveals reactions at all levels. Currently below 0.618, breaking this level could propel ICP to the 13.697 resistance. Remaining above 11.333 and the 0.382 Fibonacci level highlights the importance of the 12.476 resistance.
📈 Long Position Trigger
If you didn’t open a position at 11.333, it’s still fine. Momentum has entered this chart. After breaking 12.476, you can open a long position with a tighter stop. Ensure volume increases and RSI enters overbought territory to manage risk.
📉 Short Position Trigger
Currently, I’m not planning any short positions. If 12.476 faces a fake breakout and reverses, I’ll look for short setups in lower timeframes using a fake breakout strategy.
📝 Final Thoughts
Stay calm, trade wisely, and let's capture the market's best opportunities!
This analysis reflects our opinions and is not financial advice.
Share your thoughts in the comments, and don’t forget to share this analysis with your friends! ❤️
