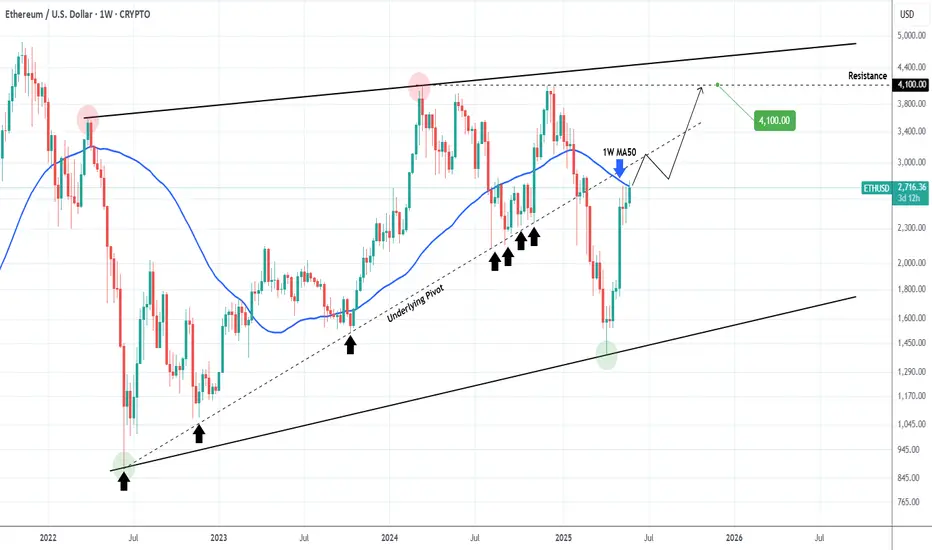
ETHEREUM Break above this level and things get real interesting!Ethereum (ETHUSD) broke above its 1W MA50 (blue trend-line) this week and will attempt to close the week above it to confirm the official restoration of the long-term bullish trend.
Regardless of that, there is another hidden trend-line that may dictate the pace of that potential bullish break-out and is no other than the underlying Pivot trend-line that started on the June 13 2022 market bottom and acted as Higher Lows up until February's Tariff fueled correction.
As a result, this is now posing as a Resistance and a break above it should technically deliver rallies similar to the Bullish Legs of 2023 - 2024.
Our 4100 Target remains intact.
-------------------------------------------------------------------------------
** Please LIKE 👍, FOLLOW ✅, SHARE 🙌 and COMMENT ✍ if you enjoy this idea! Also share your ideas and charts in the comments section below! This is best way to keep it relevant, support us, keep the content here free and allow the idea to reach as many people as possible. **
-------------------------------------------------------------------------------
💸💸💸💸💸💸
👇 👇 👇 👇 👇 👇
Cryptocurrency
TON/USDT on Fire: Bullish Momentum Builds Toward Major Targets!By examining the #TONCOIN chart on the 3-day timeframe, we can see that after correcting down to $3, the price has started pumping again and is showing strong bullish momentum. So far, it has gained over 15%, and I expect this uptrend to continue! The next targets are $3.64, $4.20, and $4.66. The expected return is around 20% in the short term, 40% to 55% in the medium term, and 110% in the long term. Support this analysis and stay tuned for more updates, my friends!
Please support me with your likes and comments to motivate me to share more analysis with you and share your opinion about the possible trend of this chart with me !
Best Regards , Arman Shaban

BTC shell fall!!!?This is how i am looking at market...
I can see a bearish triangle pattern in 4hr chart, which shows that btc may go 109,000-109,800 to complete third spike, then it might fall, main Support level will be 107,000-106,890, if market breaks it successfully then BTC may show 102,000 or if btc respect it's support level, then market may touch all time high 114,000!!!.

BITCOIN Desperately needs that weekly closing!Bitcoin (BTCUSD) broke last week above its January Resistance, effectively making a new All Time High (ATH). Technically, within BTC's dominant 2.5-year Channel Up, that is not enough to generate a bullish extension on its own and the reason is that a 1W candle closing above the Resistance level is needed and not just a break.
At least that's what happened during the last two Bullish Legs, where it required a convincing 1W candle close considerably above the Resistance, to confirm the Bullish Extension. In fact the break-out candles on both previous Bullish Legs is fairly identical.
The minimum % rise on the pattern's three Bullish Legs has been +96.75% with the others not falling way off that range (+98.74% and +106.94%). As a result, the bare minimum Target we can be expecting, in the event of a 1W candle closing above the $109500 Resistance, is $147000.
Do you think that' within the market's immediate reach? Feel free to let us know in the comments section below!
-------------------------------------------------------------------------------
** Please LIKE 👍, FOLLOW ✅, SHARE 🙌 and COMMENT ✍ if you enjoy this idea! Also share your ideas and charts in the comments section below! This is best way to keep it relevant, support us, keep the content here free and allow the idea to reach as many people as possible. **
-------------------------------------------------------------------------------
💸💸💸💸💸💸
👇 👇 👇 👇 👇 👇

Minor advantage on the bullish sideMorning folks,
So, downside AB-CD action is started as we suggested. But, it is very slow and going heavy. Appearing of triangle shape here and early signs of bullish dynamic pressure on daily chart turns the balance slightly on the bullish side.
Still, we do not have yet any clear patterns that makes us sure. So, if you're conservative - it would be better to wait a bit. If you still want to buy inside the triangle - it would be better to place initial stop below OP target, just not to be washed out occasionally, if AB=CD will be completed. Because it doesn't break the bullish context but could give us "222' Buy instead.

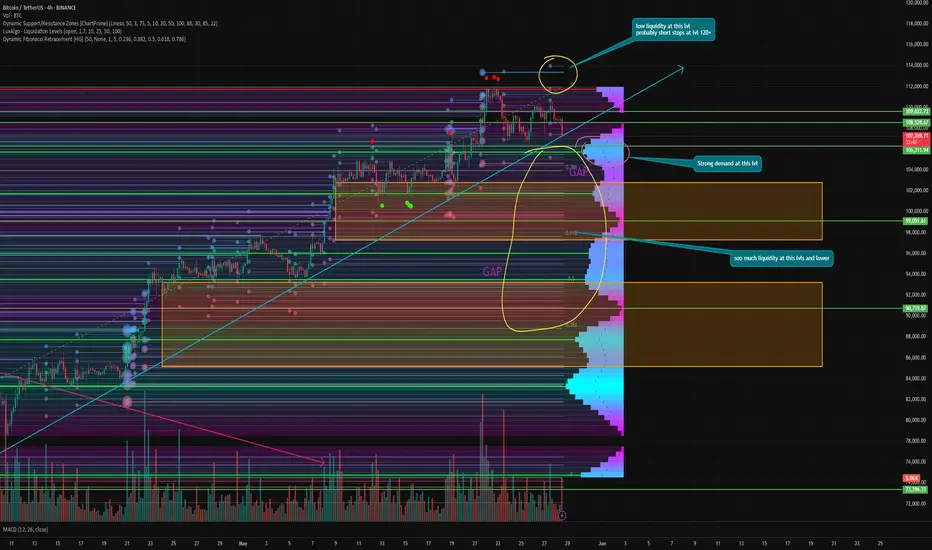
Is the momentum in Bitcoin EXHAUSTED? Or not yet?In recent days, Bitcoin has been actively updating its ATH almost daily. Everyone is already predicting $150,000 by the end of the month.
🔥 But is everything really so rosy? Let's take a closer look!
During the powerful growth over the past month, two gaps have formed below us. The first is at $97,368–102,867. The second is at $85,158–93,232. And as we know, in 99% of cases, gaps close sooner or later.
📊 Technical:
Liquidity zones - as we know, the price moves from liquidity to liquidity, which pushes it in one direction or another. Right now, there is practically no liquidity above us; it is all concentrated below. Only a move to $99,000 can now liquidate more than a billion dollars in longs.
I think short sellers' stops are much higher, at $120,000 and above. There is no point in placing them here when there is still no confirmation of a trend reversal.
⚙️ Metrics and indicators:
Volume - as I say in every review - is not a new growth impulse. It is a technical rebound. It has been moving at reduced volumes all along, which have only continued to decline.
MACD - has already given a bearish crossover , but this is certainly not the best indicator on such a TF. However, in combination with other indicators, it can predict a trend reversal at the right time.
DSRZ - shows the volume of interest at certain levels, and now we see that the first block of interest is concentrated in the $106,000–104,000 zone. These are the first support levels, from which I will expect the first rebound if the correction continues.
Liquidation Levels - as I said, all liquidity is now concentrated at the bottom. Bitcoin is very overheated and it's time to cool it down. Many think that it will be overheated when, as in the previous cycle, funding will be 0.2 and above.
But this is a different cycle, a different time, different traders, and different rules. This has already been proven more than once in this cycle.
📌 Conclusion:
I have said many times that we should not expect much from this momentum and that it is purely a technical rebound. And if something does not push us sharply upward now to bring in retail, we can definitely not expect it before the fall.
Summer is coming, investors and traders will close their positions and go on vacation. The market will be quiet.
So, personally, I am leaning back in my chair, expecting a price of at least $85,000, and watching what happens next. 🥃
XRPUSD This rare signal can send it to $12.5 end of the year.XRP has been practically ranging since the start of the year following the immense rally after the U.S. elections last November. This is technically a Re-accumulation phase supported by the 1W MA50 (blue trend-line), similar to May - November 2017 of XRP's 1st Cycle.
The strong signal that makes this correlation more relevant is the 1M RSI peak above 80.00 and correction back below the oversold barrier (green ellipse), which is identical on both fractals. Also they both took place just below the 1.5 Fibonacci extension level.
The 2017 Re-accumulation, held its 1W MA50 as Support and eventually pushed for one final parabolic rally within the 2.0 - 2.236 Fib range, before the Cycle topped.
As a result, we expect XRPUSD to hit $12.5 by the end of this year.
-------------------------------------------------------------------------------
** Please LIKE 👍, FOLLOW ✅, SHARE 🙌 and COMMENT ✍ if you enjoy this idea! Also share your ideas and charts in the comments section below! This is best way to keep it relevant, support us, keep the content here free and allow the idea to reach as many people as possible. **
-------------------------------------------------------------------------------
💸💸💸💸💸💸
👇 👇 👇 👇 👇 👇

Bitcoin 150k is very likely On weekly timeframe bitcoin broke the yellow resistance few weeks ago, now the support on weekly is about 99.6k and resistance about 148k

BITCOIN No different than all the Bullish Legs since 2023!Bitcoin (BTCUSD) has just completed a Golden Cross on the 1D time-frame, the 4th such pattern since February 05 2023. All those Golden Crosses have been formed marginally after the Channel Up bottoms and start of their respective Bullish Legs.
The current pattern is no different than any other of those Bullish Legs. On top of that, the 1W MACD has also formed its usual Bullish Cross that has technically always preceded the 1D Golden Cross.
Given that, when this happens, BTC tends to be at least near the 0.5 Fibonacci level from the eventual top, we can estimate that the next peak might be around $165000. This is another indicator that makes our $150k Target for this Cycle more than realistic.
But what do you think? Are you also expecting the market to explode past $150k? Feel free to let us know in the comments section below!
-------------------------------------------------------------------------------
** Please LIKE 👍, FOLLOW ✅, SHARE 🙌 and COMMENT ✍ if you enjoy this idea! Also share your ideas and charts in the comments section below! This is best way to keep it relevant, support us, keep the content here free and allow the idea to reach as many people as possible. **
-------------------------------------------------------------------------------
💸💸💸💸💸💸
👇 👇 👇 👇 👇 👇

BNBUSD aiming for $800 and that's only short-term.Binance Coin (BNBUSD) is staging a strong short-term push after holding its 1D MA200 (orange trend-line). This is taking place on the technical Bullish Leg of the 10-month Channel Up.
The 1W RSI broke above its MA trend-line (yellow) and that confirmed this new bullish structure. The previous Bullish Leg peaked a little over the 2.0 Fibonacci extension. Our short-term Target is therefore $800.
-------------------------------------------------------------------------------
** Please LIKE 👍, FOLLOW ✅, SHARE 🙌 and COMMENT ✍ if you enjoy this idea! Also share your ideas and charts in the comments section below! This is best way to keep it relevant, support us, keep the content here free and allow the idea to reach as many people as possible. **
-------------------------------------------------------------------------------
💸💸💸💸💸💸
👇 👇 👇 👇 👇 👇

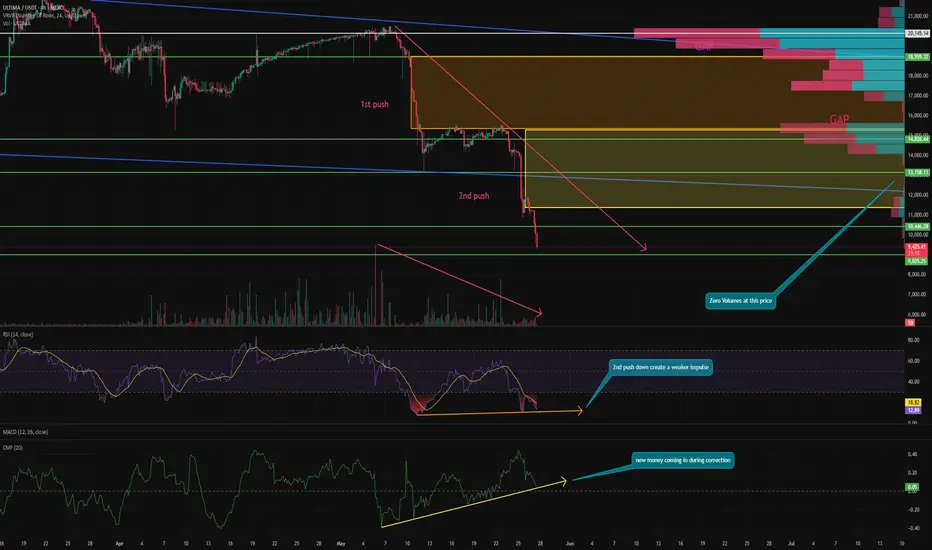
One of the MOST UNDERVALUED assets with huge POTENTIAL? ULTIMA continues its correction and by the looks of it, the end of the correction is getting closer.
⚡️ Let's see why I think there is a huge potential here in the short term.
The current correction is caused by the start of the token unlocking period after the freeze and many of them went straight to the market. However, they are not in a hurry to pay off yet.
Now, above are two huge GAPs. The first one is $11,400 - $15,320 and the second one is $15,400 - $19,000. As you know, GAPs are 99% of the time closed sooner or later. Especially such huge ones that leave behind such untraded areas.
📰 On every impulse, historically, there are 3-4 down pushes. Right now, ULTIMA has completed the second one. Not sure what the 4th will be, given what impulses were on the first two. So the next one (if there is one) could be the last and entail a BOS and a return to growth.
⚙️ Metrics and indicators:
Volume - the entire correction that started as early as $20,000 continues on lower selling volume, signaling seller exhaustion. Potentially signaling a rebound in the short term.
RSI - the second impulse was weaker than the first and a divergence was formed on the indicator chart. Which indicates a potential change of trend back to growth.
CMF - here is the most interesting thing. During the whole correction, fresh liquidity continues to enter the token. Also forming a divergence.
This indicates that holders continue to accumulate the coin. 🔥
VRVP - shows that at the price of $14,000, trading volumes have almost completely disappeared. The asset was probably overheated speculatively as it gave over 500% in a short period of time last year alone. And the current correction is landing gamblers with shoulders that obviously don't want to re-enter and go try their luck further.
Small volumes have started to appear in the $11,000 zone. Which, combined with the fact that we know we could be in for another downward momentum, is very correlative. After all, we are seeing more and more volume at a low price and the next impulse may just spark interest from those who have been waiting for a lower price for a long time.
📌Conclusion:
My first key point was $10,000. The next one will be $8,000. I don't expect a move below $6,000. But am buying at each key point so I don't miss the upside and average the position. Not trying to guess where the long awaited bottom is.
BITCOIN repeating every Cycle's final rally!Bitcoin (BTCUSD) has been on a strong rally since the April 2025 bottom on the 1W MA50 (blue trend-line) and that's perfectly aligned with the 1W MA50 rebound it had on the previous two Cycles in June 2021 and June 2017.
As you can see, those (blue circles) where the All Time High (ATH) Pivot trend-line test before the final (parabolic) rally of the Cycle started, which was its most aggressive part.
In 2017 it was much stronger and the price rallied much higher, which is natural as the market was much less mature (institutionally) than today, but it is not improbable to get a rally similar to July - November 2021.
Can that be enough to push BTC to $150k and beyond? Feel free to let us know in the comments section below!
-------------------------------------------------------------------------------
** Please LIKE 👍, FOLLOW ✅, SHARE 🙌 and COMMENT ✍ if you enjoy this idea! Also share your ideas and charts in the comments section below! This is best way to keep it relevant, support us, keep the content here free and allow the idea to reach as many people as possible. **
-------------------------------------------------------------------------------
💸💸💸💸💸💸
👇 👇 👇 👇 👇 👇

Failed Wedge, New Setup. Is SUI About to Break Out?In my previous post about BYBIT:SUIUSDT , I mentioned a potential falling wedge pattern. However, the breakout above the 4.0040 resistance turned out to be a false breakout, and the price eventually dropped to the invalidation level at 3.5868. This made the setup invalid.
But despite the failed wedge breakout, BYBIT:SUIUSDT remains in a bullish trend overall. During the current consolidation, the price appears to be forming a new bullish pattern — a Descending Broadening Wedge (DBW).
This pattern typically starts with low volatility and gradually widens. Once price reaches its lower boundary, it often experiences a strong breakout to the upside.
Let’s break down the key price action in this DBW setup:
Price is moving within a Descending Broadening Wedge and is currently near the lower boundary of the pattern.
It’s also sitting around a key support level at 3.4833.
A rejection candle formed right at 3.4833, showing the market’s response to this support area.
A reversal confirmation would come if the price breaks above 3.6102.
A bullish divergence is also visible — price is forming lower lows, while the stochastic indicator is forming higher lows.
Based on these five price action signals, it seems that buyers are still in control, even though short-term volatility has created a series of lower lows.
That’s why I still believe BINANCE:SUIUSDT has more room to go up. What’s your take on this?

Phemex Analysis #84: Pro Tips for Trading PEPEIn the vibrant and ever-changing landscape of cryptocurrency trading, PEPE ( PHEMEX:1000PEPEUSDT.P ) has recently captured significant attention from investors. Over the past 30 days, PEPE surged an impressive 130%, showcasing strong bullish momentum after a prolonged downtrend. This recent rally has rekindled investor interest, suggesting that a potential bullish reversal may be underway.
Yet, with volatility remaining high, traders should remain cautious.
Let’s explore several possible price scenarios and strategies to capitalize effectively on PEPE’s movements.
Possible Scenarios
1. Accumulation Followed by Breakout Rise
Currently, PEPE is showing signs of accumulation in the $0.015 to $0.012 range. This sideways consolidation typically indicates that market participants are gathering positions before a potentially significant upward move. If PEPE breaks decisively above the critical resistance at $0.0163, especially accompanied by a notable spike in trading volume, it would be a strong confirmation of bullish sentiment.
Pro Tips:
Entry Strategy: Consider accumulating positions within the consolidation range ($0.015 - $0.012). Wait for confirmation of a breakout above $0.0163 to scale up your positions confidently.
Risk Management: Place stop-loss orders below $0.012 to mitigate downside risk should the breakout fail to materialize.
2. Retesting the $0.007 Support Area
A pullback scenario could also unfold, bringing PEPE’s price down to retest the critical support zone around $0.007. If this retest occurs with relatively low trading volume and the RSI remains higher compared to previous lows—signaling a Double Bottom formation with RSI divergence—this could provide an excellent accumulation opportunity.
Pro Tips:
Accumulation Signals: Monitor trading volume and RSI closely. A successful retest at $0.007 with bullish divergence could indicate strong buying pressure.
Entry Confirmation: Conservative traders may prefer waiting for a confirmed breakout upward from the $0.007 support area before entering positions.
3. Bearish Drop Scenario
Despite the recent bullish signs, a bearish scenario remains possible. If PEPE declines towards the support level at $0.012 with increasing trading volume, and subsequently drops to $0.007 with even higher volume, it could indicate strong bearish momentum and weak market sentiment. Under these conditions, caution is highly recommended.
Pro Tips:
Market Caution: If price action unfolds this way, it’s advisable to refrain from entering positions immediately.
Wait and Observe: Allow price to stabilize before reconsidering any potential entry points, ensuring clear evidence of support.
Conclusion
PEPE’s recent 130% surge represents promising signs of a bullish reversal, yet navigating such volatility demands careful planning and strategic execution. By closely monitoring the outlined scenarios—recognizing accumulation signals, bullish divergences, and maintaining disciplined risk management—traders can maximize their potential returns while minimizing risk exposure. Always stay alert, responsive to market signals, and ready to adapt to changing conditions to trade PEPE confidently and profitably.
Tips:
Trade Smarter, Not Harder with Phemex. Benefit from cutting-edge features like multiple watchlists, basket orders, and real-time strategy adjustments. Our unique scaled order system and iceberg order functionality give you a competitive edge.
Disclaimer: This is NOT financial or investment advice. Please conduct your own research (DYOR). Phemex is not responsible, directly or indirectly, for any damage or loss incurred or claimed to be caused by or in association with the use of or reliance on any content, goods, or services mentioned in this article.

TradeCityPro | ADAUSDT Is It Time to Buy Cardano?👋 Welcome to TradeCityPro Channel!
Let’s dive in and analyze one of the market’s favorite coins, Cardano (ADA), which is in a strong position compared to most altcoins and is holding at higher resistance levels.
🌐 Overview Bitcoin
Before starting the analysis, I want to remind you again that we moved the Bitcoin analysis section from the analysis section to a separate analysis at your request, so that we can discuss the status of Bitcoin in more detail every day and analyze its charts and dominances together.
This is the general analysis of Bitcoin dominance, which we promised you in the analysis to analyze separately and analyze it for you in longer time frames.
Bitcoin Chart
📊 Weekly Timeframe
On the weekly time frame, ADA, like SOL, SUI, XRP, and most of the top ten coins in the market, is still in a better situation, with the price fluctuating at higher levels.
After being rejected at 1.1983 and losing support at 0.7959, we experienced a sharp drop to 0.50, driven by panic in the market due to Trump and U.S. tariffs on other countries.
Currently, in the weekly time frame, we’re still at higher levels compared to most of the market, and we can expect a strong move going forward. It’s worth noting that breaking 1.1988 will provide the best trigger for a buy.
📈 Daily Timeframe
Interesting things are happening on the daily time frame, and we’re clearly still at higher levels than other altcoins. If the market itself undergoes a trend change, we can be ready for a long trigger sooner.
After breaking 0.8204 and losing the 0.236 Fibonacci level, we experienced a sharp decline that also saw high volume. I expected that after this volume, we’d transition from volatility to forming a range box, and that’s exactly what’s happening. We’re forming a box between 0.6777 and 0.8204, but if today’s daily candle closes as it is, the downtrend will continue!
Additionally, after this event, we had a break of the support floor that turned out to be a fakeout, leading us to establish a new support level. Currently, our most important support is 0.6090, and we’re moving along a daily trendline. If we bounce from this trendline and break the 0.8419 resistance, it will be the best trigger for a buy. On the other hand, if the support breaks and we lose the 0.7417 low, we can go for a short position.
📝 Final Thoughts
Stay calm, trade wisely, and let's capture the market's best opportunities!
This analysis reflects our opinions and is not financial advice.
Share your thoughts in the comments, and don’t forget to share this analysis with your friends! ❤️

26/05/25 Weekly OutlookLast weeks high: $111,965.73
Last weeks low: $101,994.78
Midpoint: $106,980.26
New BTC ATHs! Well done to those who capitalized on the move and continue to believe in this Bitcoin.
For the last two weekly outlooks I have talked about the pattern of consolidation for 1 week --> expansion the next. Last week We got our expansion week right on queue and this time around BTC made a new ATH hitting just shy of $112,000.
Should the pattern continue this week will be a week of consolidation/chop, however this week is different now that we're at ATH levels. My gut says a pullback is coming after such an aggressive move up with almost no pullbacks at all.
Should BTCs price drop below the Midpoint I think there will be a big struggle to continue this rally in the short term. Initially target would be weekly low and main HTF target would be $97,000 IMO. That would be a healthy pullback to continue the rally.
For the bulls you don't want momentum to stop in the short term, flipping $110,450 and weekly high would put BTC back into price discovery, once any asset is in price discovery it's very difficult to tell where the sell pressure will come from and so shorting becomes very risky.

Bitcoin to 140k - 170k (26MAY2025)On monthly timeframe we have few trendlines which show us, 140 to $170,000 is likely according to the 100% of Fibonacci Extension as well, but above that is unlikely IMO.

BITCOIN $119k coming shortlyBitcoin (BTCUSD) has been trading within a 6-week Channel Up and Friday's tariff threats led pull-back was its latest Bearish Leg. That pull-back hit the 4H MA50 (blue trend-line) yesterday and rebounded. As long as the 4H MA100 (green trend-line) which is directly below the Channel Up holds, the current rebound is technically the pattern's new Bullish Leg.
All 4 previous Bullish Legs have ended on fairly similar % rises but the weakest has been +11.41%. With the 4H MACD just now completing a Bullish Cross (which has always been a strong buy signal), a repeat of the +11.41% minimum, gives us an immediate $119000 Target.
Do you think that's coming shortly before the beginning of June? Feel free to let us know in the comments section below!
-------------------------------------------------------------------------------
** Please LIKE 👍, FOLLOW ✅, SHARE 🙌 and COMMENT ✍ if you enjoy this idea! Also share your ideas and charts in the comments section below! This is best way to keep it relevant, support us, keep the content here free and allow the idea to reach as many people as possible. **
-------------------------------------------------------------------------------
💸💸💸💸💸💸
👇 👇 👇 👇 👇 👇

CHESS.USDT NEW INCREASE ROUNDEAs a trader, it's important to follow the market and the unexpected trends.
CHESS/USDT shows a possibility for a new increase in the coming time frames, after the long-term breakdown.
Let's follow the data and see if this coin is able to increase as the chart shows.
interesting to follow for the coming time frames for new confirmations.
$0,10 is an important target that this coin could hit in the coming time.
If the cycle gets confirmed, this coin could go to $0,25 as a high target and $0,35 as a best target.
In trading, never expect instant results; the market goes as it needs to go.
Risk management is the key.

ETH cheaper than $1,500 already this SUMMER? Hi! While many are already predicting an alt-season and hundreds of X's, let's see if it's really so? 🤔
While bitcoin is updating ATH day by day. ETH is still trading almost 40% cheaper than its peak in this cycle . And on the low time frame it is already forming a double top pattern, signaling a downside risk in the near future.
With the current growth we have closed a small GAP at the level of 2,250 - 2,650. But there is still a GAP above us in the zone of 2,800 - 3,250. In addition, below us there is now a GAP formed in the range of 1,850 - 2,450. And as we know, 99% of GAPs tend to close sooner or later.
❓ But here's the question - which one will close sooner? Let's get to the bottom of it!
⚙️ Indicators and metrics:
MACD - has already given a bearish section, signaling a potential trend change.
Volume - since February 3, all further declines, the volume of ETH purchases has only declined, signaling a decline in interest in the asset. Even at 1400 and below, buying volumes were still disastrously low . Showing the lack of interest in the asset even at such prices.
VRVP - shows buying and selling volumes at price levels in relation to each other. It is noticeable that at the levels of 2,400 - 2,750 the trading volumes increase significantly , and in both directions. Showing that this level is still a strong resistance , and the mood in ETH is extremely speculative and few people are interested in it at 1,400, but at 2,500 it is good choice! 😁
📌 Conclusion:
In my opinion, this was a purely technical rebound for ETH after a long decline . As well as for the altcoin market as a whole. Those altcoins that were simply declining more rapidly than others are the ones that are growing fastest now.
Besides, I remind you that summer is coming soon and there will be less liquidity on the market. So unless the current market conditions push ETH to 3,000 and above . We can definitely not expect it in summer and the most probable scenario in my opinion is blue. I don't think we will see ETH at 1,500 and below (unless Trump does something weird), but it is possible to close GAP and go to 1,800.

Intraday scenariosMorning folks,
Now we do not see yet any background for a "big game". Market needs time to manifest the next step. We said previously that it might be either direct upside action or big reverse H&S on weekly chart.
Now it is too few time passed to understand this. On a daily chart we have bearish context and engulfing pattern. So all that we have for Mon-Tue is an intraday downside AB=CD setup with ~104 and 101K targets.

TradeCityPro | CFXUSDT A Wild Week of Volatility Ahead?👋 Welcome to TradeCityPro Channel!
Let’s dive in and analyze another altcoin in the market, CFX, which is likely to experience a highly volatile week ahead, offering great trading opportunities.
🌐 Overview Bitcoin
Before starting the analysis, I want to remind you again that we moved the Bitcoin analysis section from the analysis section to a separate analysis at your request, so that we can discuss the status of Bitcoin in more detail every day and analyze its charts and dominances together.
This is the general analysis of Bitcoin dominance, which we promised you in the analysis to analyze separately and analyze it for you in longer time frames.
🕒 Weekly Time Frame
CFX stands out as an older coin with prior bull-run experience. It’s trading above last year’s lows and hasn’t experienced steep declines.
Yesterday, we analyzed this coin briefly, but today, we’ll go into more detail. Unlike most altcoins that began their bullish moves from their lowest levels, CFX has already started its upward trajectory from 0.1219.
Fibonacci analysis shows that 0.1219 aligns with the 50% retracement level—a significant support both in Fibonacci terms and Dow Theory. After forming a range around this level and breaking the 0.1810 trigger, the coin moved toward its first target at 0.2596.
However, we were rejected at 0.2596 and even lost the critical support at 0.1087, dropping to the next support at 0.0647. Currently, it appears we’re pulling back to the key 0.1087 level.
📊 Daily Time Frame
On the daily chart, CFX was in a ranging box, forming higher lows. A breakout above 0.1851 was accompanied by a strong entry candle with buyer momentum, an RSI entry signal, and volume confirmation. Stop-loss was set at the daily low of 0.14.
If you followed this trigger, you’re likely in profit despite the current red daily candle. This correction is healthy, as an uptrend without pullbacks or red candles is often unsustainable.
After breaking the daily box between 0.1046 and 0.1230 and losing its support with an engulfing candle, we experienced a downward move to 0.0647. From there, sellers effectively exited the market, and buyers showed strength. After breaking 0.0823, we formed higher highs and lows. Now, after breaking 0.1046, we can consider buying for spot, with the main trigger being a break of 0.1230.
✍️ Final Thoughts
Stay level headed, trade with precision, and let’s capitalize on the market’s top opportunities!
This is our analysis, not financial advice always do your own research.
What do you think? Share your ideas below and pass this along to friends! ❤️

BItcoin; Heikin Ashi Trade IdeaCOINBASE:BTCUSD
Picture tells more than 1000 words!
Thank you for checking out!
